. 2024 Aug 1:17:5177-5195.
doi: 10.2147/JIR.S467760. eCollection 2024.

Screening of Diagnostic Biomarkers and Immune Infiltration Characteristics Linking Rheumatoid Arthritis and Rosacea Based on Bioinformatics Analysis

Affiliations

Screening of Diagnostic Biomarkers and Immune Infiltration Characteristics Linking Rheumatoid Arthritis and Rosacea Based on Bioinformatics Analysis

Yun Wang et al. J Inflamm Res. .

Abstract

Introduction: Both rheumatoid arthritis (RA) and rosacea represent common chronic systemic autoimmune conditions. Recent research indicates a heightened RA risk among individuals with rosacea. However, the molecular mechanisms linking these diseases remain largely unknown. This study aims to uncover shared molecular regulatory networks and immune cell infiltration patterns in both rosacea and RA.

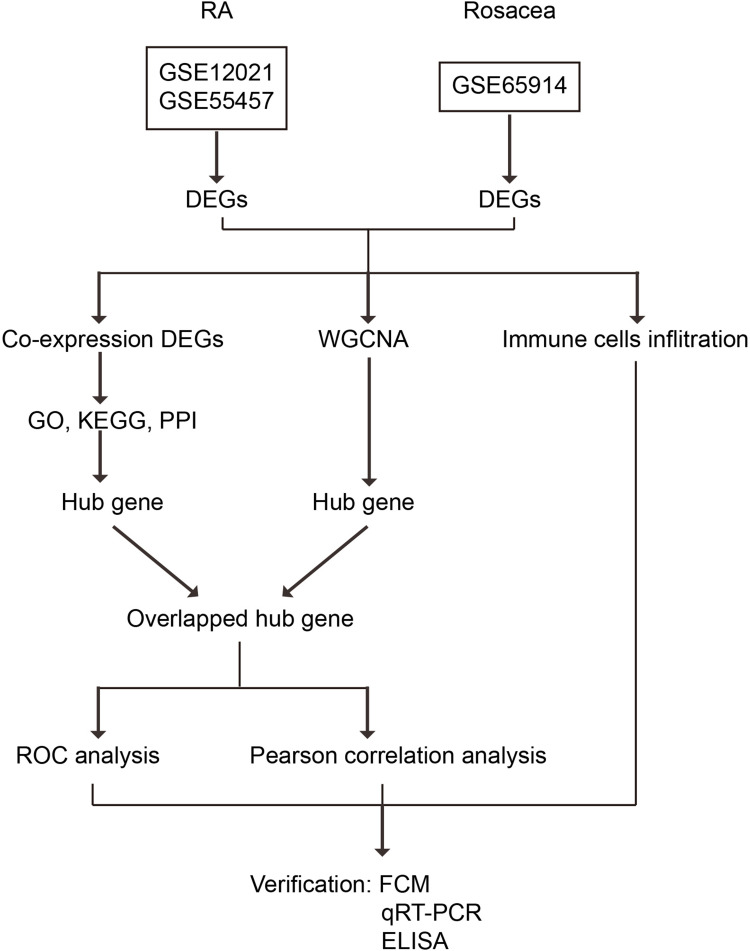
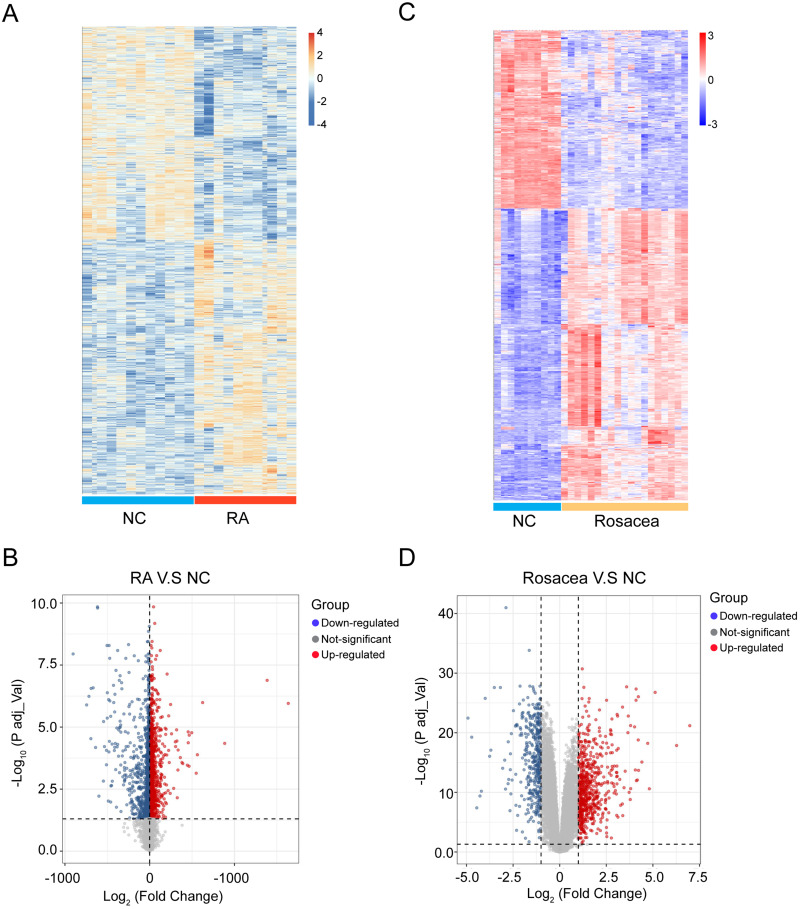
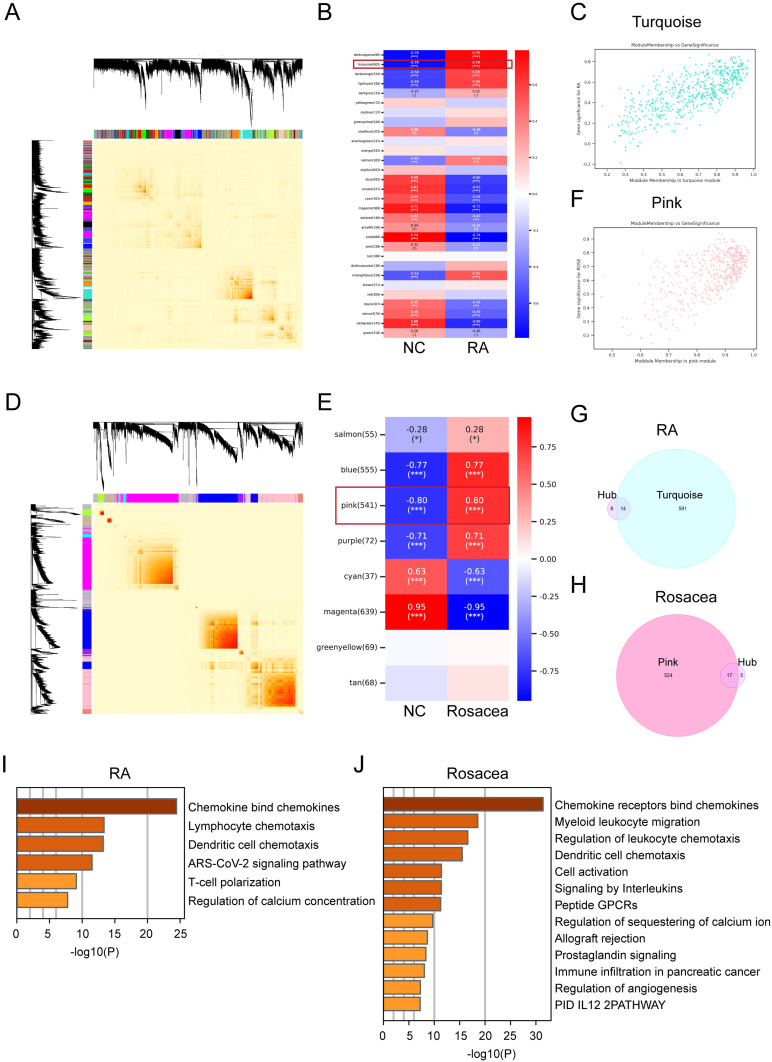
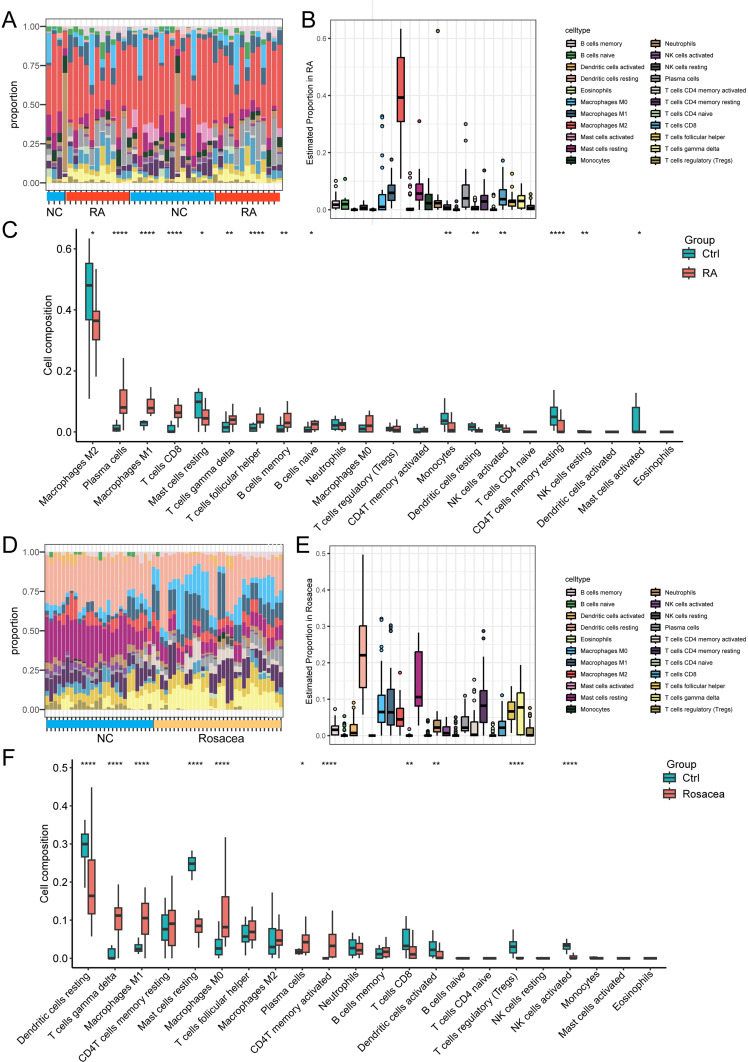
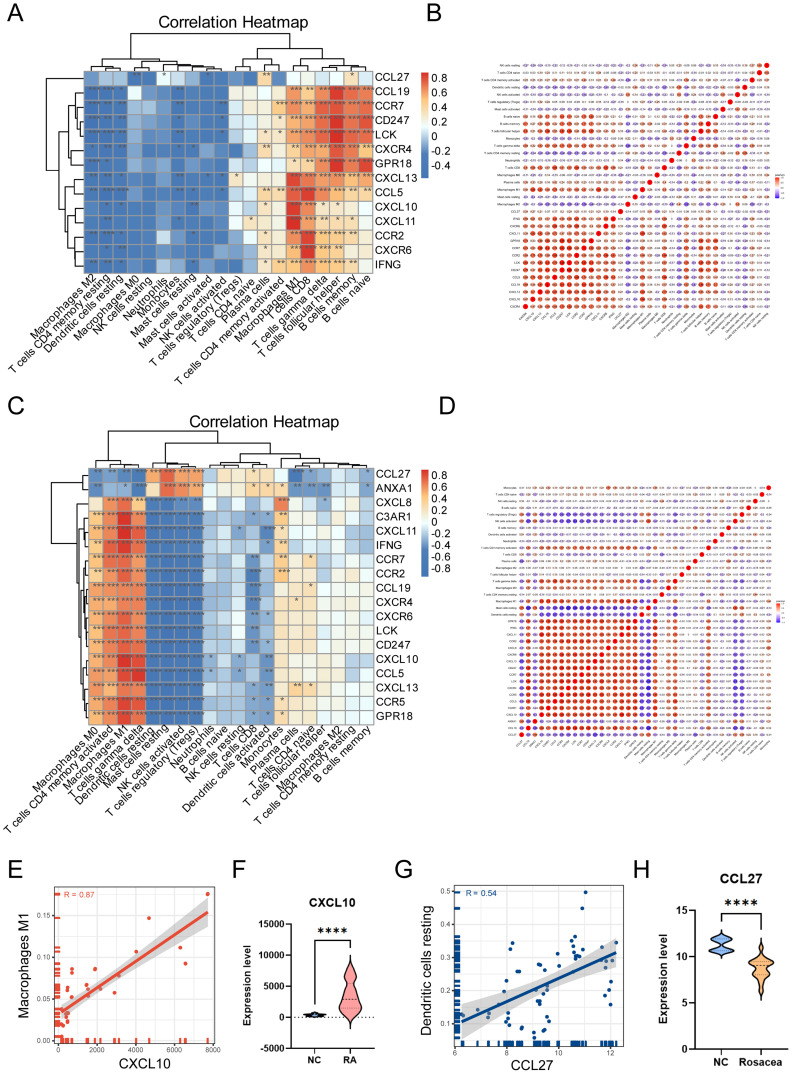
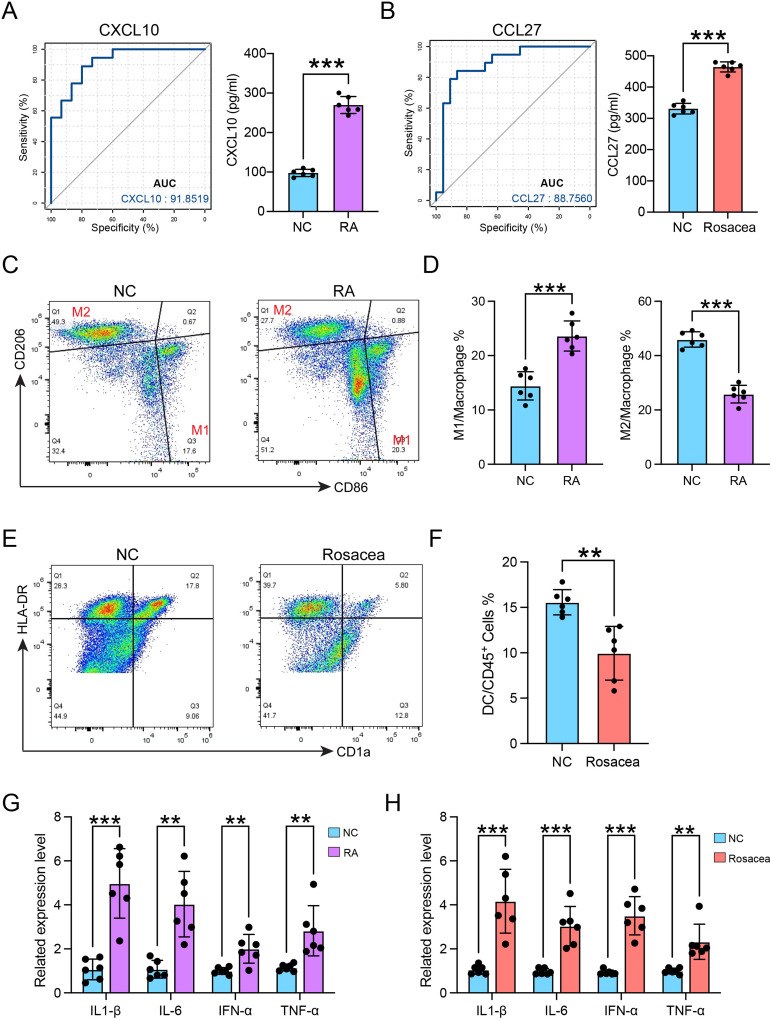
Methods: The gene expression profiles of RA (GSE12021, GSE55457), and the rosacea gene expression profile (GSE6591), were downloaded from Gene Expression Omnibus (GEO) databases, and obtained to screen differentially expressed genes (DEGs) by using "limma" package in R software. Various analyses including GO, KEGG, protein-protein interaction (PPI) network, and weighted gene co-expression network analyses (WGCNA) were conducted to explore potential biological functions and signaling pathways. CIBERSORT was used to assess the abundance of immune cells. Pearson coefficients were used to calculate the correlations between overlapped genes and the leukocyte gene signature matrix. Flow cytometry (FCM) analysis confirmed the most abundant immune cells detected in rheumatoid arthritis and rosacea. Receiver operator characteristic (ROC) analysis, enzyme-linked immunosorbent assay (ELISA), and qRT-PCR were used to confirm biomarkers and functions.

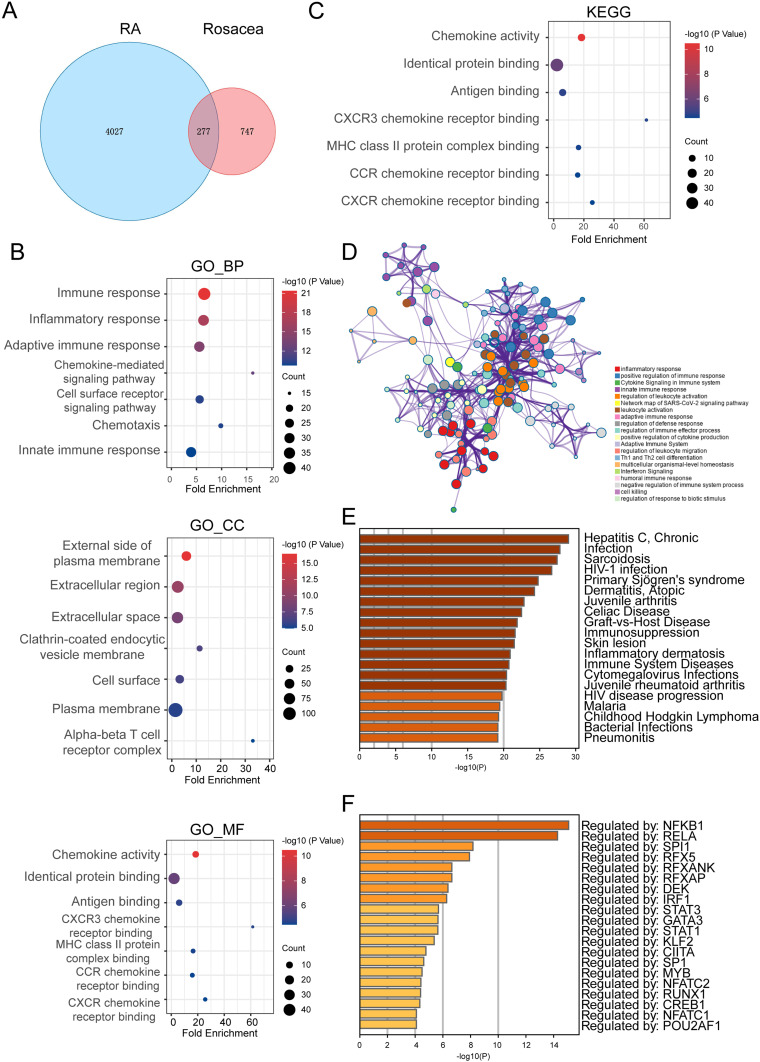
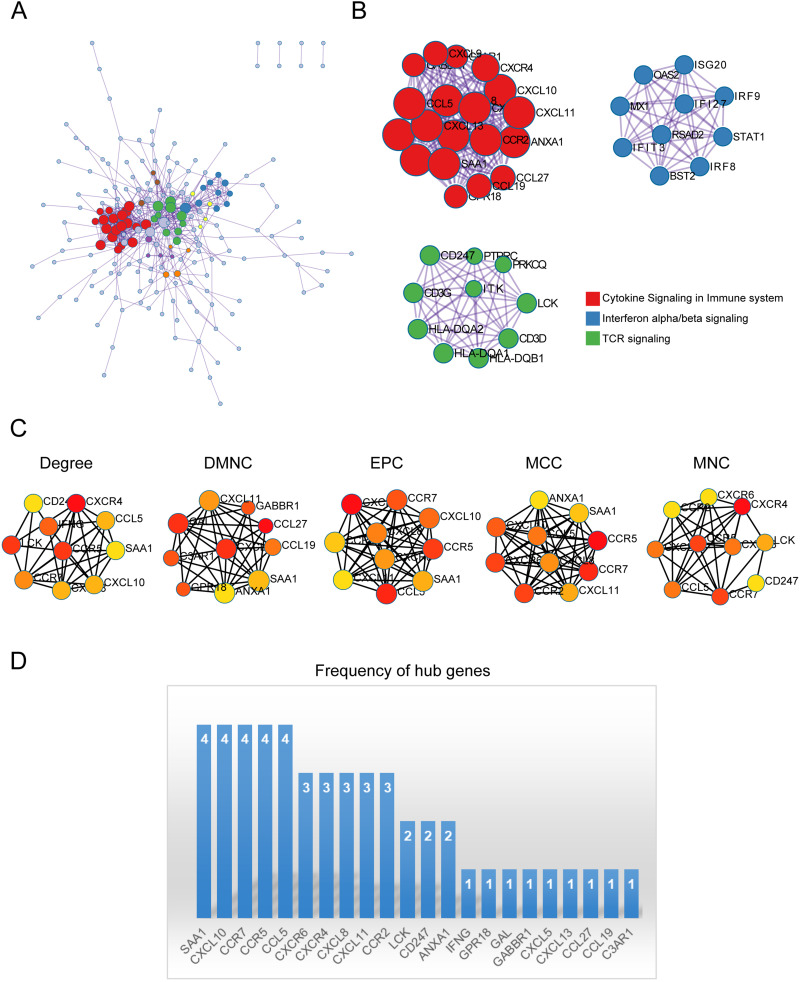
Results: Two hundred seventy-seven co-expressed DEGs were identified from these datasets. Functional enrichment analysis indicated that these DEGs were associated with immune processes and chemokine-mediated signaling pathways. Fourteen and 17 hub genes overlapped between cytoHubba and WGCNA were identified in RA and rosacea, respectively. Macrophages and dendritic cells were RA and rosacea's most abundant immune cells, respectively. The ROC curves demonstrated potential diagnostic values of CXCL10 and CCL27, showing higher levels in the serum of patients with RA or rosacea, and suggesting possible regulation in the densities and functions of macrophages and dendritic cells from RA and rosacea, which were validated by FCM and qRT-PCR.

Conclusion: Importantly, our findings may contribute to the scientific basis for biomarkers and therapeutic targets for patients with RA and rosacea in the future.

Keywords: autoimmune disease; chemokine; diagnostic biomarkers; immune infiltration; macrophage.


Conflict of interest statement

The authors declare that they have no competing interests in this work.

Figures

Figure 1
Figure 1
Study flowchart.
Figure 2
Figure 2
Heatmap and volcano plot for the DEGs identified from the RA and rosacea datasets. (A) DEGs were showed in rows, and the samples of RA cases or controls were showed in columns. The Orange and blue represent DEGs with upregulated and downregulated gene expression, respectively. (B) Red, blue and gray plot dots represent DEGs in RA cases or control with upregulated, downregulated gene and not-significant expression, respectively. (C) DEGs were showed in rows, and the samples of rosacea cases or controls were showed in columns. The red and blue represent DEGs with upregulated and downregulated gene expression, respectively. (D) Red, blue and gray plot dots represent DEGs in rosacea cases or control with upregulated, downregulated gene and not-significant expression, respectively. NC, normal controls.
Figure 3
Figure 3
The Co-Expressed DEGs and Enriched Pathways in Both RA and Rosacea.(A) The Venn graph of co-expressed DEGs in both RA and rosacea. (B) GO enrichment analysis of co-expressed DEGs. (C) The KEGG analysis of co-expressed DEGs. (D) The pathway enrichment analysis of co-expressed DEGs using Metascape (http://metascape.org/gp/index). (E) The disease enrichment analysis of co-expressed DEGs in DisGeNET using Metascape (http://metascape.org/gp/index.). (F) The transcription factor (TF) enrichment analysis of co-expressed DEGs in TRRUST using Metascape (http://metascape.org/gp/index.).
Figure 4
Figure 4
PPI network, and Identification of Hub Genes. (A) PPI network constructed with the co-expressed DEGs in both RA and rosacea. (B) MCODE was used to identify the significant module from the PPI network with a score of ≥ 5.0. Different nodes’ color present different functions. (C) The top 10 hub genes of 5 patterns were discovered by Cytoscape software (version 3.7.2, cytoHubba plug-ins). (D) The frequency of hub genes.
Figure 5
Figure 5
Identification of key module genes via WGCNA in RA and rosacea. (A) Gene co-expression modules represented by different colors under the gene tree in RA. (B) Module–trait relationships in RA. Each cell contains the corresponding correlation and p-value. (C) The correlation between RA and key module genes. (D) Gene co-expression modules represented by different colors under the gene tree in rosacea. (E) Module–trait relationships in rosacea. Each cell contains the corresponding correlation and p-value. (F) The correlation between rosacea and key module genes. (G) The Venn graph of overlapped DEGs in both hub gene got from Figure 4C and key module genes got from WGCNA in RA. (H) The Venn graph of overlapped DEGs in both hub gene got from Figure 4C and key module genes got from WGCNA in rosacea. *, p < 0.05; ***, p < 0.001. (I) The pathway enrichment analysis of overlapped hub DEGs in RA using Metascape (http://metascape.org/gp/index.). (J) The pathway enrichment analysis of overlapped hub DEGs in rosacea using Metascape (http://metascape.org/gp/index.). NC, normal controls.
Figure 6
Figure 6
The infiltration pattern of immune cells among different groups. (A) The relative percentage of 22 types of immune cells in RA datasets, and each column refers to one of the samples of RA cases or controls. (B) The relative percentage of 22 types of immune cells in all samples of RA databases. (C) The difference of immune infiltration between RA and controls. The control group was marked as blue color and RA group was marked as red color. (D) The relative percentage of 22 types of immune cells in RA datasets, and each column refers to one of the samples of rosacea cases or controls. (E) The relative percentage of 22 types of immune cells in all samples of rosacea databases. (F) The difference of immune infiltration between rosacea and controls. The control group was marked as blue color and rosacea group was marked as red color. *, p < 0.05; **, p < 0.01; ***, p < 0.001, ****, p < 0.0001. NC, normal controls.
Figure 7
Figure 7
The correlation between infiltrated immune cells and overlapped hub genes. (A) The heatmap showed the correlation between infiltrated immune cells and overlapped hub genes in RA. The darker the color, the stronger the correlation. Blue graph represents negative correlation, whereas red graph represents positive correlation between infiltrated immune cells and overlapped hub genes. (B) The babble plot showed correlation coefficients (R) among each kind of infiltrated immune cells and every single overlapped hub gene in RA. (C) The heatmap showed the correlation between infiltrated immune cells and overlapped hub genes in rosacea. The darker the color, the stronger the correlation. Blue graph represents negative correlation, whereas red graph represents positive correlation between infiltrated immune cells and overlapped hub genes. (D) The babble plot showed correlation coefficients (R) among each kind of infiltrated immune cells and every single overlapped hub gene in rosacea. (E) The correlation between CXCL10 and M1 macrophages in RA. (F) The expression level of CXCL10 in RA and control. (G) The correlation between CCL27 and dendritic cells resting in rosacea. (H) The expression level of CCL27 in rosacea and control. Data are presented as the mean ± standard error of the mean. Statistical significance (Student’s t-test): *, p < 0.05; **, p < 0.01; ***, p < 0.001. NC, normal controls.
Figure 8
Figure 8
The validation of infiltrated immune cells and diagnostic biomarkers. (A) The diagnostic effectiveness of CXCL10 for RA by ROC analysis (left), and the serum CXCL10 concentration in patients of RA (right). (B) The diagnostic effectiveness of CCL27 for RA by ROC analysis (left), and the serum CCL27 concentration in patients of rosacea (right). (C) The gating strategy for identifying M1 macrophages and M2 macrophages from CD45+ cells. (D) The quantitative analysis of the proportions of M1 and M2 macrophages in control and patients with RA (n=6). (E) The gating strategy for identifying DC cells from CD45+ cells. (F) The quantitative analysis of the proportions of DC cells in control and patients (n=6) with rosacea. (G) The mRNA expression levels of TNF-α, IL-6, IL-1β, and IFN-α in macrophages separated from patients with RA or normal control (NC) after CXCL10 treatment for 24h. (H) The mRNA expression levels of TNF-α, IL-6, IL-1β, and IFN-α in DC cells separated from patients with rosacea or normal control (NC) after CCL27 treatment for 24h. Data are presented as the mean ± standard error of the mean. Statistical significance (Student’s t-test): **p < 0.01, ***p < 0.001. NC, normal controls.

References

    1. Smolen JS, Aletaha D, McInnes IB. Rheumatoid arthritis. Lancet. 2016;388(10055):2023–2038. doi:10.1016/S0140-6736(16)30173-8 - DOI - PubMed
    1. Gibofsky A. Epidemiology, pathophysiology, and diagnosis of rheumatoid arthritis: A Synopsis. Am J Manag Care. 2014;20(7):S128–135. - PubMed
    1. Orr C, Vieira-Sousa E, Boyle DL, et al. Synovial tissue research: a state-of-The-art review. Nat Rev Rheumatol. 2017;13(10):630. doi:10.1038/nrrheum.2017.161 - DOI - PubMed
    1. Aletaha D, Smolen JS. Diagnosis and management of rheumatoid arthritis: A review. JAMA. 2018;320(13):1360–1372. doi:10.1001/jama.2018.13103 - DOI - PubMed
    1. McInnes IB, Schett G. Pathogenetic insights from the treatment of rheumatoid arthritis. Lancet. 2017;389(10086):2328–2337. doi:10.1016/S0140-6736(17)31472-1 - DOI - PubMed

LinkOut - more resources