. 2024 Aug 6;134(18):e174661.
doi: 10.1172/JCI174661.

Hif-2α programs oxygen chemosensitivity in chromaffin cells

Affiliations

Hif-2α programs oxygen chemosensitivity in chromaffin cells

Maria Prange-Barczynska et al. J Clin Invest. .

Abstract

The study of transcription factors that determine specialized neuronal functions has provided invaluable insights into the physiology of the nervous system. Peripheral chemoreceptors are neurone-like electrophysiologically excitable cells that link the oxygen concentration of arterial blood to the neuronal control of breathing. In the adult, this oxygen chemosensitivity is exemplified by type I cells of the carotid body, and recent work has revealed one isoform of the hypoxia-inducible transcription factor (HIF), HIF-2α, as having a nonredundant role in the development and function of that organ. Here, we show that activation of HIF-2α, including isolated overexpression of HIF-2α but not HIF-1α, is sufficient to induce oxygen chemosensitivity in adult adrenal medulla. This phenotypic change in the adrenal medulla was associated with retention of extra-adrenal paraganglioma-like tissues resembling the fetal organ of Zuckerkandl, which also manifests oxygen chemosensitivity. Acquisition of chemosensitivity was associated with changes in the adrenal medullary expression of gene classes that are ordinarily characteristic of the carotid body, including G protein regulators and atypical subunits of mitochondrial cytochrome oxidase. Overall, the findings suggest that, at least in certain tissues, HIF-2α acts as a phenotypic driver for cells that display oxygen chemosensitivity, thus linking 2 major oxygen-sensing systems.

Keywords: Development; Embryonic development; Hypoxia; Oncology.


Figures

Figure 1
Figure 1. RNA-Seq of Phd2KO versus WT AM and CBs from young adult mice.
(A) Principal component analysis (PCA) of bulk RNA-Seq of CB and AM from Phd2KO and WT mice; RNA was extracted from 5 pairs of approximately 2-month-old animals per biological replicate; n = 3 or 2 biological replicates for CB or AM, respectively. PC1, first principal component; PC2, second principal component. (B) Individual genes that are induced (green) or repressed (purple) by Phd2KO in the AM (absolute value of log2 fold change > log2[1.5] and FDR < 0.1; likelihood ratio test) are overlaid onto genes differentially expressed in WT CB versus WT AM. Gene names are shown for a subset whose mRNA abundance in transcripts per million (TPM) in WT or Phd2KO AM is greater than 10. (C) Data from B shown as a box plot. The fold difference in mRNA abundance in WT CB versus WT AM for genes induced (green) or repressed (purple) by Phd2KO in the AM was compared against that for all other genes (gray) using the 2-sided Mann-Whitney U test. n = 108 (Phd2KO induced); n = 15,032 (others); n = 75 (Phd2KO repressed).
Figure 2
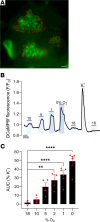
Figure 2. Ca2+ imaging showing oxygen chemosensitivity in Phd2KO (Phd2fl/fl;Ai95fl/+;ThCre), but not WT (Ai95fl/+;ThCre), AM from young adult mice.
(A) Representative image showing GFP fluorescence in an AM slice from a mouse expressing genetically encoded calcium indicator (GCaMP6f), the expression of which is restricted to TH+ cells (Ai95fl/+;ThCre, referred to as WT in Figures 5, 6, and 8) and perfused with 45 mM K+. Red outline shows an example of the K+-responsive region of interest from which fluorescence is quantified. Scale bar: 0.2 mm. (B) Average AUC corresponding to each hypoxic (or sham, 18% O2) stimulus in C. Figures are normalized as percentages of AUC under 45 mM K+ signal. Data are represented as mean ± SEM with individual data points overlaid in this and subsequent figures. Data were analyzed by a mixed-effects 2-way ANOVA, with 18% O2 excluded from analysis: variation due to change in oxygen tension, P < 0.0001; variation due to Phd2 inactivation, P = 0.0004, followed by Šidák’s multiple-comparisons test on pairwise comparisons at each oxygen level. *P < 0.05; **P < 0.01. (C) Representative traces showing fluorescence (F) in the AM (averaged across the K+-responsive region as per red outline in image A), background corrected, and normalized to the fluorescence at the beginning of the recording (F0) to give F/F0; shaded areas highlight the time for which the indicated stimuli are applied: hypoxia (18%–0% O2) or 45 mM K+ (in this and all subsequent figures depicting GCaMP6f recordings).
Figure 3
Figure 3. Abdominal OZ PGL in Phd2KO, but not WT, young adult mice.
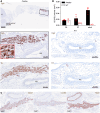
(A) CgA (top left and middle 2 panels) and TH (bottom panels) immunohistochemistry in transverse sections of abdominal aorta (AA) and kidneys (K) in Phd2KO (left) and WT (right) adult mice. Low magnification image shows a transverse section of abdominal cavity, with the aorta-adjacent OZ PGL shown at higher magnification (see red insert for detailed cellular morphology showing “clearing” within some CgA+ cells within the PGL). This structure is absent in a comparable region of the WT mouse. (B) OZ or OZ PGL volume based on CgA+ structure in abdominal cavities in neonatal (P0 and P7) and adult Phd2KO and WT mice. No OZ PGL-like structure was detected in adult WT mice (N/D). (C) In situ hybridization for Epas1, Cox4i2, and Rgs5 mRNA in the OZ PGL from an adult Phd2KO mouse.
Figure 4
Figure 4. Oxygen chemosensitivity in the abdominal OZ PGL of a Phd2KO young adult mouse.
(A) Representative image showing GFP fluorescence in an OZ PGL from an adult Phd2KO mouse perfused with 45 mM K+. Red outlines show the K+ responsive regions of interest, from which GCaMP6f fluorescence is quantified in B and C. Scale bar: 0.2 mm. Large bright-green structure visible in the bottom left corner is an adjacent blood vessel. (B) Representative trace showing F/F0 fluorescence in the K+ responsive regions as the tissue is exposed to the indicated stimuli: 10%–0% O2, 45 mM K+, or sham (18% O2). (C) Average AUC normalized to the signal in response to 45 mM K+ in Phd2KO OZ PGLs. Data were analyzed by 1-way, repeated-measures ANOVA: variation due to oxygen tension, P = 0.0035, followed by Dunnett’s multiple-comparisons test comparing each stimulus to 18% O2. **P < 0.01; ****P < 0.0001.
Figure 5
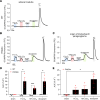
Figure 5. Phd2 inactivation induces Ca2+ mobilization in chromaffin cells in response to 10% CO2 and doxapram.
Representative traces of GCaMP6f F/F0 fluorescence in the K+ responsive region of (A) WT (Ai95fl/+;ThCre) and (B) Phd2KO (Phd2fl/fl;Ai95fl/+;ThCre) AM and (C) Phd2KO OZ PGL from young adult mice, as the tissues are exposed to indicated stimuli: 1% O2, 10% CO2, sham test solution (18% O2), 50 μM doxapram or 45 mM K+. (D and E) Average AUC normalized as percentage of AUC with 45 mM K+ in (D) WT and Phd2KO AM slices and (E) OZ PGL. Data were analyzed by (D) 2-tailed, unpaired Student’s t tests and (E) 1-way ANOVA: variation due to gas stimulus applied, P = 0.0334, followed by Dunnett’s multiple-comparisons test against the sham. *P < 0.05; ***P < 0.001.
Figure 6
Figure 6. Abdominal OZ PGL in HIF-2αdPA (HIF-2αdPAfl/+;ThCre) young adult mice.
(A) CgA (top panels) and TH (bottom panels) immunohistochemistry in OZ PGL shown in transverse sections of abdominal aorta in adult HIF-2αdPA mice; this structure was not detected in adult HIF-1αdPA (or WT) mice. Scale bars: 0.05 mm. (B) OZ PGL volume based on CgA+ structures in abdominal cavities in adult HIF-2αdPA mice. No OZ PGL-like structure was detected in adult HIF-1αdPA or WT mice (N/D). (C) Representative trace showing F/F0 fluorescence in the K+ responsive regions in an OZ PGL from an adult HIF-2αdPA mouse, as the tissue is exposed to indicated stimuli: hypoxia (10%–0% O2), 45 mM K+ or sham (18% O2). (D) Average AUC normalized as percentage of AUC under 45 mM K+ in HIF-2αdPA OZ PGLs (with the sham control used for 18% O2). Data were analyzed by 1-way ANOVA: variation due to oxygen tension, P < 0.0001, followed by Dunnett’s multiple-comparisons test against 18% O2. **P < 0.01; ****P < 0.0001.
Figure 7
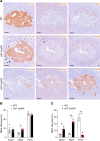
Figure 7. Gene expression in WT, HIF-1αdPA (HIF-1αdPAfl/+;ThCre), and HIF-2αdPA (HIF-2αdPAfl/+;ThCre) AM from young adult mice.
(A) In situ hybridization for Pnmt, Epas1 (Hif-2α), and Rgs5 (brown) in adjacent sections from WT versus HIF-1αdPA or HIF-2αdPA mice. Harris hematoxylin counterstain (purple). Scale bars: 0.1 mm. For each mRNA, mean area of expression was compared between WT and (B) HIF-1αdPA or (C) HIF-2αdPA using unpaired Student’s t tests with multiple-comparisons P value adjustment using the Holm-Šidák’s method. *P < 0.05; **P < 0.01.
Figure 8
Figure 8. Oxygen chemosensitivity in WT, HIF-1αdPA (HIF-1αdPAfl/+;Ai95fl/+;ThCre), and HIF-2αdPA (HIF-2αdPAfl/+;Ai95fl/+;ThCre) AM from young adult mice.
(A) Representative traces showing F/F0 fluorescence in WT, HIF-1αdPA, or HIF-2αdPA AM as the tissue is exposed to the indicated stimuli: 10%–0% O2, 45 mM K+, or sham (18% O2). (B and C) Average AUC to each hypoxic (or sham, 18% O2) stimulus (as recorded in A) normalized as percentage of AUC with 45 mM K+ in WT versus (B) HIF-1αdPA or (C) HIF-2αdPA mice. Data in B and C were analyzed by 2-way ANOVA with 18% O2 excluded from analysis: variation due to change in oxygen tension, P = 0.8029 (B), P = 0.0054 (C); variation due to HIF-1α activation, P = 0.1738 (B); variation due to HIF-2α activation, P = 0.0352 (C), followed by a Holm-Šidák’s multiple-comparisons test on pairwise comparisons between WT and HIF-1/2αdPA at each oxygen level (shown in graphs), which revealed no significant comparisons.

References

    1. Weir EK, et al. Acute oxygen-sensing mechanisms. N Engl J Med. 2005;353(19):2042–2055. doi: 10.1056/NEJMra050002. - DOI - PMC - PubMed
    1. Semenza GL, Prabhakar NR. The role of hypoxia-inducible factors in carotid body (patho) physiology. J Physiol. 2018;596(15):2977–2983. doi: 10.1113/JP275696. - DOI - PMC - PubMed
    1. Holmes AP, et al. Are multiple mitochondrial related signalling pathways involved in carotid body oxygen sensing? Front Physiol. 2022;13:908617. doi: 10.3389/fphys.2022.908617. - DOI - PMC - PubMed
    1. Ortega-Saenz P, Lopez-Barneo J. Physiology of the carotid body: from molecules to disease. Annu Rev Physiol. 2020;82:127–149. doi: 10.1146/annurev-physiol-020518-114427. - DOI - PubMed
    1. Bishop T, Ratcliffe PJ. Signaling hypoxia by hypoxia-inducible factor protein hydroxylases: a historical overview and future perspectives. Hypoxia (auckl) 2014;2:197–213. doi: 10.2147/HP.S47598. - DOI - PMC - PubMed

MeSH terms

Substances