. 2024 Sep 9;52(16):9745-9759.
doi: 10.1093/nar/gkae655.

Stress granule formation helps to mitigate neurodegeneration

Affiliations

Stress granule formation helps to mitigate neurodegeneration

M Rebecca Glineburg et al. Nucleic Acids Res. .

Abstract

Cellular stress pathways that inhibit translation initiation lead to transient formation of cytoplasmic RNA/protein complexes known as stress granules. Many of the proteins found within stress granules and the dynamics of stress granule formation and dissolution are implicated in neurodegenerative disease. Whether stress granule formation is protective or harmful in neurodegenerative conditions is not known. To address this, we took advantage of the alphavirus protein nsP3, which selectively binds dimers of the central stress granule nucleator protein G3BP and markedly reduces stress granule formation without directly impacting the protein translational inhibitory pathways that trigger stress granule formation. In Drosophila and rodent neurons, reducing stress granule formation with nsP3 had modest impacts on lifespan even in the setting of serial stress pathway induction. In contrast, reducing stress granule formation in models of ataxia, amyotrophic lateral sclerosis and frontotemporal dementia largely exacerbated disease phenotypes. These data support a model whereby stress granules mitigate, rather than promote, neurodegenerative cascades.


Figures

Graphical Abstract
Graphical Abstract
Figure 1.
Figure 1.
nsP3 inhibits SG formation caused by GC-rich repeats, but has no effect on translation. (A) HEK 293T cells co-transfected with WT or mut nsP3 and poly(I:C). (B) Quantification of G3BP SG + cells in (A). Bars represent proportion ± 95% C.I. mut nsP3 n = 117, WT nsP3 n = 124. (C) HEK 293T cells co-transfected with WT or mut nsP3 and the indicated Nluc-3xF reporters. G3BP and DDX3 are used as SG markers. (D) Quantification of G3BP SG + cells in (C). Bars represent proportion ± 95% C.I.s (G4C2)70 + mut nsP3 n = 622, (G4C2)70 + WT nsP3 n = 731, (CGG)100 + mut nsP3 n = 538, (CGG)100 + WT nsP3 n = 685. (E) Quantification of DDX3 SG + cells in (C). Bars represent proportion ± 95% C.I. (CGG)100 + mut nsP3 n = 324, (CGG)100 + WT nsP3 n = 314. (B, D, E) Two tailed fisher's exact test with Bonferonni correction for multiple comparisons (D), ***P< 0.001, ****P< 0.0001. (F) Nanoluciferase expression relative to FireFly luciferase (FFLuc) of indicated Nanoluciferase (Nluc)-3xF reporters co transfected with EGFP-nsp3 WT or EGFP-nsP3 mut. Bars represent mean ± SEM. Two-way ANOVA and Holm-Sidak unpaired t-tests, n = 6. (G) Western blot and SUnSET Assay (puromycin) of HEK 293Ts transfected with EGFP-WT nsP3 or EGFP-mutant nsP3 and treated with either DMSO (control) or Thapsigargin (TG). B-tubulin = loading control, p-PERK = control for TG ISR induction. (H) Quantification of SUnSET assay in (G). Bars represent mean ± standard deviation, Welch's t-tests, n = 3, *P< 0.05, **P< 0.01.
Figure 2.
Figure 2.
nsP3 reduces SG formation in neurons. (A) Primary rat cortical neurons treated with 250μM NaArs for 30min prior to immunostaining for the SG marker ATXN2. (B) Quantification of coefficient of variation (CV) of granular ATXN2 staining in (A). *P= 0.021, **P= 0.010, ns: P> 0.05; Welch's unpaired t-test. (A) N = 14–19 cells/condition, pooled from three replicates.
Figure 3.
Figure 3.
nsP3 does not enhance survival in primary neurons expressing TDP43 or trinucleotide repeats. (A, B) Automated microscopy and survival analysis of neurons expressing (A) TDP43-mApple and nsP3-WT, nsP3-mut, or mApple EGFP control or (B) (CGG)100-GFP and nsP3-WT, nsP3-mut or mApple EGFP control. Data inA pooled from three biological replicates, each with eight technical replicates/condition. Data in (B) are combined from four biological replicates, each with eight technical replicates/condition. Cox proportional hazards analysis, ***P< 0.001, ****P< 0.0001.
Figure 4.
Figure 4.
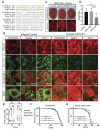
Impact of nsP3 expression in Drosophila. (A) Schematic of Drosophila rin, Aedes albopictus rin and human G3BP1 NTF2-like domains. Asterisks indicate homology, yellow highlights denote nsP3 interacting regions. (B) Representative images of third instar larval brains expressing rin-sfGFP, and Actin-Gal4, UAS-mApple-control (left) or Actin-Gal4, UAS mApple-nsP3 WT (right) untreated, 2 h in 500uM NaArs, or 1 h at 42C. (C) Representative images of eyes from flies coexpressing GMR-Gal4 with mApple-control,mApple-nsP3-WT, or mApple-nsP3-mut. (Top) Bright field, (bottom) mApple expression. (D) Quantification of rough eye phenotypes of males from C (control n = 23, nsP3-WT n = 33, nsP3-mut n = 26). One-way ANOVA and Tukey's multiple comparisons test. ****P< 0.0001. (E) Climbing time showing mean time ± stdev to climb 6.5 cm for male D42-Gal4, mApple control, nsP3-WT or nsP3-mut flies, conducted at indicated days post-ecolosion at 25C. n ≥ 17. Two-way ANOVA and Tukey's multiple comparison test. (F) Survival assay of Tub5-GS, mApple control, nsP3-WT, or nsP3-mut flies exposed to RU-486 at 24C. (control n = 92, nsP3-WT n = 90, nsP3-mut n = 89). Logrank Mantel–Cox test. (G) Survival assay Tub5-GS, mApple control, nsP3-WT or nsP3-mut flies exposed to RU-486 and serially heat shocked (incubated at 24°C then heat shocked for 2 h at 36°C every 48 h) (control n = 90, nsP3-WT n = 89, nsP3-mut n = 88). (F, G) Log-rank Mantel–Cox test, no significance observed between genotypes.
Figure 5.
Figure 5.
nsP3 enhances toxicity in ALS fly models. (A) Representative images of male fly eyes expressing EGFP-TDP43 under GMR-GAL4 expression with control, nsP3-WT or nsP3- mut. (B) Quantification of rough eye phenotypes of males from A (control n = 34, nsP3-WT n = 68, nsP3-mut n = 74). (C) Quantification of rough eye phenotypes of males expressing TDP43-M337V under GMR-GAL4 expression with control, nsP3-WT or nsP3-mut (control n = 33, nsP3-WT n = 33, nsP3-mut n = 52), ****P< 0.0001. (D) Representative images of male fly eyes expressing (GGGGCC)28-EGFP under GMR-GAL4 expression with control, nsP3-WT, or nsP3-mut. (E) Quantification of rough eye phenotypes of males from D (control n = 44, nsP3-WT n = 33, nsP3-Mut = 61). (F, G) Quantification of (D, F) eye width (control n = 23, nsP3-WT n = 23, nsP3-mut n = 21), and (G) proportion of necrosis positive eyes (control n = 44, nsP3-WT n = 33, nsP3-Mut = 61). (B, C, E) One-way ANOVA and Tukey's multiple comparisons test. (F) Two way ANOVA (see Supplementary Figure S5D) with Tukey's multiple comparisons test. *P< 0.05, **P,0.01, ***P< 0.001, ****P< 0.0001. (G) Fischer's exact test with Bonferonni correction for multiple comparisons. *P< 0.01667, **P< 0.01, ***P< 0.001, ****P< 0.0001.
Figure 6.
Figure 6.
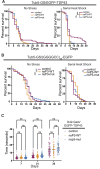
nsP3 does not enhance survival in ALS fly models. (A) Survival curves of Tub5-GS/EGFPTDP43 coexpressed with indicated genotypes either at (left) constant 29°C (control n = 75, nsP3-WT n = 111, nsP3-mut n = 112) or (right) serial heat shock (2 h every 48 h at 36°C) (control n = 81, nsP3- WT n = 85, nsP3-mut n = 76). (B) Survival curves of Tub5-GS/(GGGGCC)28-EGFP coexpressed with indicated genotypes either at (left) constant 29°C (control n = 87, nsP3-WT n = 84, ns3P3-mut n = 109), or (right) serial heat shock (2 h every 48 h at 36°C) (control n = 111, nsP3-WT n = 106, nsP3-mut n = 106). Log-rank Mantel–Cox test with Bonferroni corrections for multiple comparisons. *P< 0.0125, **P< 0.01, ***P< 0.001, ****P< 0.0001. (C) Climbing assay showing mean time ± stdev to climb 6.5 cm for D42-Gal4, UAS-EGFP-TDP43 male flies coexpressing mApple control, nsP3-WT or nsP3-mut conducted at indicated days post-ecolosion at 25°C. n ≥ 30, Two-way ANOVA and Tukey's multiple comparison test.

Update of

References

    1. Walter P., Ron D.. The unfolded protein response: from stress pathway to homeostatic regulation. Science. 2011; 334:1081–1086. - PubMed
    1. Starck S.R., Tsai J.C., Chen K., Shodiya M., Wang L., Yahiro K., Martins-Green M., Shastri N., Walter P.. Translation from the 5′ untranslated region shapes the integrated stress response. Science. 2016; 351:aad3867. - PMC - PubMed
    1. Kedersha N., Cho M.R., Li W., Yacono P.W., Chen S., Gilks N., Golan D.E., Anderson P.. Dynamic shuttling of TIA-1 accompanies the recruitment of mRNA to mammalian stress granules. J. Cell Biol. 2000; 151:1257–1268. - PMC - PubMed
    1. Tourriere H., Chebli K., Zekri L., Courselaud B., Blanchard J.M., Bertrand E., Tazi J.. The RasGAP-associated endoribonuclease G3BP assembles stress granules. J. Cell Biol. 2003; 160:823–831. - PMC - PubMed
    1. Kedersha N., Panas M.D., Achorn C.A., Lyons S., Tisdale S., Hickman T., Thomas M., Lieberman J., McInerney G.M., Ivanov P.et al.. G3BP-Caprin1-USP10 complexes mediate stress granule condensation and associate with 40S subunits. J. Cell Biol. 2016; 212:845–860. - PMC - PubMed

MeSH terms