. 2025 Feb 3;148(2):549-563.
doi: 10.1093/brain/awae262.

Chloride deregulation and GABA depolarization in MTOR-related malformations of cortical development

Affiliations

Chloride deregulation and GABA depolarization in MTOR-related malformations of cortical development

Naziha Bakouh et al. Brain. .

Abstract

Focal cortical dysplasia, hemimegalencephaly and cortical tubers are paediatric epileptogenic malformations of cortical development (MCDs) frequently pharmacoresistant and mostly treated surgically by the resection of epileptic cortex. Availability of cortical resection samples has allowed significant mechanistic discoveries directly from human material. Causal brain somatic or germline mutations in the AKT/PI3K/DEPDC5/MTOR genes have been identified. GABAA-mediated paradoxical depolarization, related to altered chloride (Cl-) homeostasis, has been shown to participate to ictogenesis in human paediatric MCDs. However, the link between genomic alterations and neuronal hyperexcitability is unclear. Here, we studied the post-translational interactions between the mTOR pathway and the regulation of cation-chloride cotransporters (CCCs), KCC2 and NKCC1, that are largely responsible for controlling intracellular Cl- and, ultimately, GABAergic transmission. For this study, 35 children (25 MTORopathies and 10 pseudo-controls, diagnosed by histology plus genetic profiling) were operated for drug-resistant epilepsy. Postoperative cortical tissues were recorded on a multi-electrode array to map epileptic activities. CCC expression level and phosphorylation status of the WNK1/SPAK-OSR1 pathway was measured during basal conditions and after pharmacological modulation. Direct interactions between mTOR and WNK1 pathway components were investigated by immunoprecipitation. Membranous incorporation of MCD samples in Xenopus laevis oocytes enabled measurement of the Cl- conductance and equilibrium potential for GABA. Of the 25 clinical cases, half harboured a somatic mutation in the mTOR pathway, and pS6 expression was increased in all MCD samples. Spontaneous interictal discharges were recorded in 65% of the slices. CCC expression was altered in MCDs, with a reduced KCC2/NKCC1 ratio and decreased KCC2 membranous expression. CCC expression was regulated by the WNK1/SPAK-OSR1 kinases through direct phosphorylation of Thr906 on KCC2, which was reversed by WNK1 and SPAK antagonists (N-ethylmaleimide and staurosporine). The mSIN1 subunit of MTORC2 was found to interact with SPAK-OSR1 and WNK1. Interactions between these key epileptogenic pathways could be reversed by the mTOR-specific antagonist rapamycin, leading to a dephosphorylation of CCCs and recovery of the KCC2/NKCC1 ratio. The functional effect of such recovery was validated by the restoration of the depolarizing shift in the equilibrium potential for GABA by rapamycin, measured after incorporation of MCD membranes into X. laevis oocytes, in line with a re-establishment of normal Cl- reversal potential. Our study deciphers a protein interaction network through a phosphorylation cascade between MTOR and WNK1/SPAK-OSR1 leading to deregulation of chloride cotransporters, increased neuronal Cl- levels and GABAA dysfunction in malformations of cortical development, linking genomic defects and functional effects and paving the way to target epilepsy therapy.

Keywords: GABAA receptor; WNK1/SPAK-OSR1; epilepsy; mTOR; malformation of cortical dysplasia; rapamycin.


Conflict of interest statement

The authors report no competing interests.

Figures
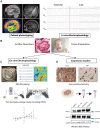
Figure 1
Figure 1
Methodological illustration of the study. (A) Presurgical evaluation. Imaging of a patient with focal cortical dysplasia (FCD) located in the vicinity of the circular sulcus of the right insular lobe. Red arrows indicate the FCD, with increased intensity on FLAIR sagittal MRI (top left) and 18F-FDG PET hypometabolism (bottom left). Intracranial EEG recordings were performed with stereo EEG (T1-weighted MRI, top right), allowing focal resection (postoperative T1-weighted MRI, bottom right). Epileptic interictal activity was restricted to the proximal plots of the electrodes Q-R-X and, typical of this patient, consisted of a synchronizing pattern localized in the abnormal sulcus and anterior short insular gyrus. (B) Cortical dysplasia is ablated with subpial ‘en bloc’ resection, transferred to the laboratory in oxygenated sucrose-based artificial CSF (aACSF), and the tissue is then cut into 400-µm-thick slices. (C) An electrophysiology study was performed with a 10 × 12 multi-electrode array that allows extensive mapping of spontaneous epileptic activity in aACSF or under pharmacological modulation in the bathing solution. Membrane preparation and micro-transplantation into Xenopus oocytes allows the study of GABA-induced currents and EGABA. (D) Expression studies allow analysis of expression of chloride cotransporters in basal conditions and after pharmacological modulation, with immunohistochemistry, immunofluorescence and western blot analysis.
Figure 2
Figure 2
Characteristics of focal cortical dysplasia cortical samples. (A) Haematoxylin–phloxine–saffron (HPS) staining and immunostaining of a surgical specimen displaying a focal cortical dysplasia (FCD) type II with loss of cortical cytoarchitecture (anti-NeuN immunostaining; scale bar = 50 µm) and the presence of cytomegalic neurons with densified Nissl corpus (HPS and anti-MAP2 immunostaining; scale bars = 100 µm) and a strong pS6 cytoplasmic expression (anti-pS6; scale bar 100 µm). Scale bars in A = 500 µM. Dysmorphic neurons and balloon cells in FCD type IIb. Scale bars = 100 µM. Western blotting for pS6 in brain tissues from subjects with FCD type IIb and controls shows increased expression level of pS6 protein in brain tissues of FCD type II compared with controls. Densitometric analysis of the pS6 bands was quantified to GAPDH for each experimental condition. [n = 5 western blot, N = 3 malformations of cortical development (MCDs: two FCD and one TSC) and three controls (stroke/Rasmussen/peritumoural cortex)]. (B) Genomic analysis of the cohort shows mutations in the PI3K/AKT/MTOR with next-generation sequencing-identified somatic mutation in half of the cases with a low varient allele frequency (VAF). (C) MEA recordings of patient’s cortical slices ex vivo display spontaneous interictal discharges in physiological artificial CSF in vitro. The box plots illustrate the characteristics of the local field potentials in the MCD cohort. (D) KCC2 expression levels are reduced in all FCD II patients compared with controls. Brain slice lysates from control and MCD patients were probed for KCC2 and NKC1 levels. KCC2 and NKCC1 expressions were normalized to GAPDH. Nine independent western blot analyses are shown from N = 3 controls (stroke/Rasmussen/peritumoural cortex) and N = 6 MCD patients (two FCD, two TSC and two HMG). Reduced KCC2 expression levels are found in MCDs (0.199 ± 0.032 versus 1.281 ± 0.070; P ≤ 0.001). NKCC1 expression levels are increased in MCDs (1.253 ± 0.072 versus 0.674 ± 0.054; P ≤ 0.001). The KCC2/NKCC1 ratio is significantly reduced in FCDII compared with controls (1.253 ± 0.072 versus 0.674 ± 0.054; P ≤ 0001). (E) Immunohistochemistry analysis and cell counting show reduced membranous expression of KCC2 in the MTOR group. HPS and anti-KCC2 immunostaining from a pseudo-control (top, scale bar = 100 µm) and an MTOR patient (bottom, scale bar = 100 µm) illustrating membranous expression of KCC2 (Mb) in the pseudo-control group (Ctl) and intracytoplasmic accumulation of KCC2 (IC KCC2) in MTOR patients that was confirmed by cell counting.
Figure 3
Figure 3
WNK1/SPAK-OSR1 regulate chloride cotransporter expression in focal cortical dysplasia. (A) N-ethylmaleimide (NEM) and staurosporine impair WNK1/SPAK-OSR1 phosphorylation. Top: Representative western blots and quantification of SPAK-OSR1pS373 expression levels of brain slice lysates in the presence of DMSO, NEM and staurosporine. Bottom: SPAK-OSR1pS373 expression was normalized to total SPAK-OSR1 (n = 4 and N = 3 patients with malformations of cortical development: two FCD and one HMG). SPAK-OSR1pS373/total SPAK-OSR1 ratio was lower (P < 0.001) in the presence of NEM (0.494 ± 0.025) and staurosporine (0.415 ± 0.025) than in DMSO (1.036 ± 0.016). (B) NEM and staurosporine treatment increases KCC2 expression and restores KCC2/NKCC1 ratio. Top: Representative western blot from brain slice lysates from treated with DMSO, NEM and staurosporine were probed for KCC2 and NKC1 levels. Bottom: NEM and staurosporine restore KCC2/NKCC1 ratio. KCC2 and NKCC1 expressions were normalized to GAPDH [n = 4 and N = 4 patients (two FCD, one HMG and one TSC)]. Error bars represent SE. Band intensities were quantified using ImageJ software. (C) Inhibition of WNK1/SPAK-OSR1 by NEM decreases epileptic activities in vitro. Representative recordings in a single electrode of spontaneous interictal activity recorded in a cortical slice from an FCD patient in vitro before (aACSF), during 0.5 mM NEM treatment and after washout with aACSF. NEM inhibited spontaneous seizures in human brain slices with malformations of cortical development.
Figure 4
Figure 4
Phosphorylation cascades underlying mTOR and CCC interactions. (A) MTOR and WNK1/SPAK-OSR1 have a direct physical interaction that is inhibited by rapamycin. Left: WNK1 protein was immunoprecipitated (IP) with an anti-WNK1 antibody, the immunoprecipitate was probed further with anti-mTOR antibody to detect mTOR on western blot. Middle: Brain slices were pretreated with DMSO, rapamycin or WNK463 inhibitor for 30 min before lysis. The lysate was immunoprecipitated with an antibody directed against mSIN1 and analysed by western blot with anti-WNK1. Right: Brain slices were pretreated with DMSO or rapamycin for 30 min before lysis. The protein interaction of SPAK/OSR and mSIN1 was assessed by co-immunoprecipitation. (B) Inhibition of mTOR dephosphorylates WNK1/SPAK-OSR1 and chloride cotransporters. Left: Immunoblots (IB) for evaluating changes in SPAK-OSR1pS373 expression. GAPDH was used as a loading control. [n = 4 and N = 4 patients with malformations of cortical development (two FCD, one HMG and one TSC)]. SPAK-OSR1pS373/total SPAK-OSR1 ratio was lower in BYL719, everolimus and rapamycin conditions than in DMSO. Error bars represent the SE. Middle and right: Quantitative analyses of KCC2 pThr906 and NKCC1pTh203,207,212 upon BYL719, everolimus and rapamycin treatment in neurons in brain slices [n = 6–4 western blot respectively and four patients (two FCD, one HMG and one TSC)]. Slices were treated with DMSO (control),10 μM BYL719, 1 µM everolimus or 0.5 µM rapamycin, respectively, for 30 min. Immunoprecipitated KCC2 and NKCC1 were probed for KCC2pThr906 and NKCC1pTh203,207,212. Densitometric analysis of the KCC2pThr906 and NKCC1pTh203,207,212 bands was performed after normalization to total KCC2 and total NKCC1 for each experimental condition. (C) mTOR inhibition restores the KCC2/NKCC1 ratio. Representative western blot of proteins of slice lysates (left) probed with KCC2, KCC1 and GAPDH antibodies. Densitometric analyses of the KCC2 and NKCC1 bands were quantified to GAPDH for each experimental condition [n = 6 western blots and N = 5 patients (two FCD, two HMH and one TSC)]. Bar graph shows relative levels of KCC2/GAPDH, NKCC1/GAPDH and KCC2/NKCC1 ratio.
Figure 5
Figure 5
mTOR inhibition restores KCC2 membrane insertion. (A) Quantification of membranous KCC2. Brain slices were pretreated with vehicle (DMSO) or rapamycin for 30 min before lysis. Slices were then labelled with biotinylation reagent. Biotinylated surface proteins were then separated by streptavidin resin. Left: Representative western blot of total, cytosolic and biotinylated surface proteins of slice lysates probed with GAPDH and KCC2 antibodies. Right: Bar graph shows relative total and cytosolic levels of KCC2/GAPDH proteins (N = 2 patients with malformations of cortical development and n = 6 western blots). Densitometric analysis of the biotinylated KCC2 band was performed after normalization for the intracellular amount of KCC2 for each experimental condition. (B and C) Subcellular KCC2 repartition immunofluorescence imaging of FCD in basal conditions (B, left, black rectangle) and after mTOR inhibition (C, right, red rectangle) in two different slices. Neuronal (NeuN) KCC2 in pS6+ cells is located in the cytoplasm in FCD, and on the membrane after rapamycin treatment.
Figure 6
Figure 6
mTOR inhibition restores the equilibrium potential for GABA and blocks spontaneous interictal discharges ex vivo. (A) GABA-induced current. Left: GABA-induced current (250 µM of GABA added in ND96) was measured at holding potential of −50 mV in oocytes incorporating membrane from a focal cortical dysplasia (FCD) patient [n = 15 oocytes, N = 3 frogs and three patients (two FCD and one HMG)]. Oocytes injected with water were used as control oocytes. Original traces show the current induced by the addition of 250 µM GABA in the superfusing medium. Right: Bar graph of the experiments display the effect of 250 µM in both types of oocytes. (B) Equilibrium potential for GABA (EGABA) depolarization. Left: Current–voltage relationship from oocytes injected with membranes of human brain FCD under ND96 (black), GABA (red) and GABA + rapamycin (green). The points represent means ± SE of peak GABA currents. EGABA was determined as the intercept of the current–voltage curve with the x-axis: EGABA 16.28 ± 0.59 mV; EGABA shifts to −29.5 ± 10.24 mV after rapamycin treatment [P = 0.007, paired t-test; n = 14 oocytes, N = 3 frogs and N = 3 patients (two FCD and one HMG)]. Right: Bar graph illustrating the mean ± SE of Erev for oocytes under ND96 (black), GABA (red) and GABA + rapamycin (green). Note that the mean EGABA was significantly more positive in FCD tissues before rapamycin treatment. Rapamycin application shifts EGABA to more negative potential. Data represented are pooled from three separate experiments, with four to five oocytes per experiment (N = 3 frogs and 3 malformations of cortical development, n = 14 oocytes). (C) Rapamycin inhibits spontaneous interictal discharges in FCD slices ex vivo. Representative local field potential recordings from a single channel during MEA recordings before pharmacological modulation in aACSF, under rapmycin (0.5 µM) treatment and after washout with aACSF. (D) Heat map examples for the 2–40 Hz frequency range, for aACSF, rapamycin and washed. The heat maps illustrate the frequency topographic distribution of the data (time window = 10 min), according to the interictal discharges on the 120 contacts of the MEA grid. The heat maps use one average value [log10(Pow)] for each electrode, using interpolation to calculate and plot values between the electrodes. The red square indicates an active electrode that is illustrated further below. In aACSF, a power distribution pattern, potentially associated with spreading, can be observed. This pattern is suppressed in rapamycin but reactivated after aACSF washout. Time-resolved superlet spectra for the active electrode reveal rapamycin suppression and washed power reactivation. (E) Bar plots for all the active electrodes spectral power averages (log10), for aACSF, rapamycin and washout. The bars represent continuous series of averages over a 10 min interval. Error bars = SEM. **P < 0.01.

References

    1. Harvey AS, Cross JH, Shinnar S, Mathern GW. Defining the spectrum of international practice in pediatric epilepsy surgery patients. Epilepsia. 2008;49:146–155. - PubMed
    1. Cohen NT, Chang P, You X, et al. Prevalence and risk factors for pharmacoresistance in children with focal cortical dysplasia–related epilepsy. Neurology. 2022;99:e2006–e2013. - PMC - PubMed
    1. Taylor DC, Falconer MA, Bruton CJ, Corsellis JA. Focal dysplasia of the cerebral cortex in epilepsy. J Neurol Neurosurg Psychiatry. 1971;34:369–387. - PMC - PubMed
    1. Fauser S, Huppertz HJ, Bast T, et al. Clinical characteristics in focal cortical dysplasia: A retrospective evaluation in a series of 120 patients. Brain. 2006;129(Pt 7):1907–1916. - PubMed
    1. Mellerio C, Labeyrie MA, Chassoux F, et al. Optimizing MR imaging detection of type 2 focal cortical dysplasia: Best criteria for clinical practice. AJNR Am J Neuroradiol. 2012;33:1932–1938. - PMC - PubMed

MeSH terms