. 2024 Aug 13;121(33):e2400420121.
doi: 10.1073/pnas.2400420121. Epub 2024 Aug 6.

A therapeutic small molecule enhances γ-oscillations and improves cognition/memory in Alzheimer's disease model mice

Affiliations

A therapeutic small molecule enhances γ-oscillations and improves cognition/memory in Alzheimer's disease model mice

Xiaofei Wei et al. Proc Natl Acad Sci U S A. .

Abstract

Brain rhythms provide the timing for recruitment of brain activity required for linking together neuronal ensembles engaged in specific tasks. The γ-oscillations (30 to 120 Hz) orchestrate neuronal circuits underlying cognitive processes and working memory. These oscillations are reduced in numerous neurological and psychiatric disorders, including early cognitive decline in Alzheimer's disease (AD). Here, we report on a potent brain-permeable small molecule, DDL-920 that increases γ-oscillations and improves cognition/memory in a mouse model of AD, thus showing promise as a class of therapeutics for AD. We employed anatomical, in vitro and in vivo electrophysiological, and behavioral methods to examine the effects of our lead therapeutic candidate small molecule. As a novel in central nervous system pharmacotherapy, our lead molecule acts as a potent, efficacious, and selective negative allosteric modulator of the γ-aminobutyric acid type A receptors most likely assembled from α1β2δ subunits. These receptors, identified through anatomical and pharmacological means, underlie the tonic inhibition of parvalbumin (PV) expressing interneurons (PV+INs) critically involved in the generation of γ-oscillations. When orally administered twice daily for 2 wk, DDL-920 restored the cognitive/memory impairments of 3- to 4-mo-old AD model mice as measured by their performance in the Barnes maze. Our approach is unique as it is meant to enhance cognitive performance and working memory in a state-dependent manner by engaging and amplifying the brain's endogenous γ-oscillations through enhancing the function of PV+INs.

Keywords: Alzheimer’s disease; GABA-A receptors; gamma oscillations; interneurons; parvalbumin.


Conflict of interest statement

Competing interests statement:Composition and methods for treating neurodgenerative diseases. W.I.P. Organization, ed. (The Regents of the University of California).

Figures

Fig. 1.
Fig. 1.
α1 subunit is prominently expressed in PV+ interneurons in CA3 and in similar interneurons along the base of the dentate granule cell layer. (A) Many PV+INs in CA3 express the α1 subunit (examples at arrows). Their distribution closely resembles that of δ subunit-expressing PV+INs in CA3 [described previously (42)]. (B) In the dentate gyrus, the α1 subunit is strongly expressed on δ subunit-containing interneurons (arrows) along the base of the granule cell layer (G). (C) PV+INs in this location also exhibit strong α1 subunit labeling along their cell surface (arrow). (D) In Gabrd+/+ animals, α1 subunit labeling is similarly expressed on the surface of these interneurons, with lighter, diffuse labeling within the cytoplasm. In contrast, in Gabrd−/− animals, many α1-labeled interneurons have reduced surface labeling (arrow) and exhibit increased punctate labeling within the cytoplasm. This suggests that loss of the δ subunit leads to altered localization of the α1 subunit in these interneurons, consistent with a favored partnership of the δ and α1 subunits. (Scale bars: A = 50 µm; B = 20 µm; C and D = 10 µm.)
Fig. 2.
Fig. 2.
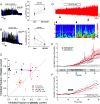
Pharmacological characterization of DDL-920 in PV+INs and its effects on γ-oscillations in vitro. (A) The effects of tracazolate, a compound known to potentiate GABAARs composed of α1β2δ subunits in Xenopus oocytes, on the tonic GABAAR-mediated currents of identified PV+INs. Left panel: Raw traces of a voltage-clamp recording at Vh = 0 mV of the tonic GABAAR-mediated currents before, during, and after the perfusion of 10 μM tracazolate (horizontal bar). The perfusion of 40 μM gabazine (GBZ) was used to block all GABAARs. The blue segments in the recording indicate the 30 s epochs used for the tonic and phasic current analysis. Right panel: Summary data from 5 recordings where the tonic GABAAR-mediated currents normalized to the capacitance of the cells are plotted before (Control) and during (10 µM tracazolate) the perfusion of the drug. The individual experimental results are illustrated with light gray open circles connected by dotted lines, while the averages (± SEM) are indicated by solid black circles connected by a black dotted line. The p-value indicates a significant increase in the tonic current as determined using the paired Wilcoxon signed-rank test. (B) The effects of DDL-920 on the tonic GABAAR-mediated currents of identified PV+INs. Left panel: Raw traces of a voltage-clamp recording at Vh=0 mV of the tonic GABAAR-mediated currents before, during, and after the perfusion of 1 nM DDL-920 (horizontal bar). The perfusion of 40 μM gabazine (GBZ) was used to block all GABAARs. The blue segments in the recording indicate the 30 s epochs used for the tonic and phasic current analysis. Right panel: Summary data from 6 recordings where the tonic GABAAR-mediated currents normalized to the capacitance of the cells are plotted before (Control) and during (1 nM DDL-920) the perfusion of the drug. The individual experimental results are illustrated with light gray open circles connected by dotted lines, while the averages (±SEM) are indicated by solid black circles connected by a black dotted line. The p-value indicates a significant reduction of the tonic current as determined using the paired Wilcoxon signed-rank test. (C) Plot of the inhibited fraction (efficacy of inhibition; see Materials and Methods for details) of the tonic current vs the same for the phasic current by DDL-920 in cortical PV+INs. The small colored dots are from individual cell recordings while the large dots are the average values with the SD bars extending in both directions. The concentrations of the compounds are color-coded as per the legend. The dashed line has a unity slope and thus indicates no specificity of the compound for either tonic or phasic inhibition [orange data points are from dentate gyrus granule cells (GC) obtained at 1 nM DDL-920]. (D) Effects of 100 nM DDL-920 perfused for 15 min on in vitro γ-oscillations in the hippocampal CA3 pyramidal layer. The Morlet wavelets (Bottom panel) show the large enhancement of the magnitude of 40 to 50 Hz oscillations during 1 s epochs before (①) and after (②) the application of DDL-920. (E) Comparative effects of 20 min perfusions of 1 or 100 nM DDL-920, or vehicle (aCSF) on the power (RMS averaged during 60 s epochs) of in vitro γ-oscillations (n’s represent the number of slices). The changes are expressed relative to the power measured during the baseline recording period (10 min). (F) Effects of 5 min perfusions of 100 nM DDL-920 on slices obtained from WT and AD model mice. Measurements as in E. The solid lines represent the averages, the dashed lines are the SD envelopes of the averages. There are no significant differences between the enhancement of γ-oscillation power by DDL-920 in the two genotypes.
Fig. 3.
Fig. 3.
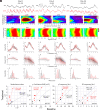
Effects of DDL-920 (10 mg/kg) SQ in vivo administrations on hippocampal θ- and γ-oscillations in wild type mice. (A–G) The effects of two DDL-920 injections >3 wk apart in a WT mouse, with an intercalated saline injection 3 d after the first DDL-920 injection. (A) The traces are raw recordings of 1 s long epochs taken between 1 and 3 h prior and (B) ~3 h, ~2 h, and ~2.5 h, after the DDL-920, saline, and DDL-920 injections, respectively. Calibration bars are 100 ms and 0.2 mV and refer to all traces in A and B. (C–G) Analyses of θ–γ frequencies, frequency-amplitude (FAC), and phase- amplitude coupling (PAC) in 120 s segments randomly extracted during the indicated periods before and after the injections. (C) MI matrix for θ–γ frequencies during the corresponding 120 s before and after injection epochs. The MI shows by how much γ amplitude for each θ frequency bin deviates from a uniform distribution [Kullback–Leibler distance between two distributions (70, 71)]. Each of the plots is on the same color scale (0 to 1.2 e-3), except for Day 0 post, which is in the scale of 0 to 2.4 e-3. Note the large increases in the MI only after DDL-920 injections. (D) PAC of θ–γ oscillations with θ phase represented from trough (−π) to peak (0) and back to trough (+π). The values are z-scores calculated within each 10 Hz frequency bin from 30 to 120 Hz. Despite large increases in γ-oscillation amplitudes, their coupling to θ phase remains unaltered after DDL-920. (E) Histograms of the instantaneous frequencies (in Hz) of the θ- and γ-oscillations before (black) and after (red) injections showing no differences in the frequencies. Note the presence of both low and high γ-oscillation frequencies. (F) Instantaneous amplitude vs frequency (in Hz) of θ- and γ-oscillations before (black) and after (red) injections showing increases in the γ-oscillation amplitudes across all frequencies after DDL-920 injections. Please note the log scale of the amplitudes. (G) Histograms (at bin widths of 0.001 mV2) of RMS measured over 120 s of θ- and γ-oscillations before (black) and after (red) DDL-920 injections showing large increases in the γ-oscillation RMS after DDL-920 administrations. (H) The parameters indicated on the top of the graphs are plotted as post vs. preinjection values (DDL-920: red n = 5 mice, five injections, only the first injection was included from the mouse shown in panels A–G; saline: black, n = 3 mice, three injections, including the one from the mouse in panels A–G. The data points from this mouse are indicated by square symbols). The slopes of the linear regressions through the origin are shown next to the respective regression lines. The P-values in the lower right corners of the plots refer to the comparisons between the two slopes. The slopes (±SD) of the MI and of the γ-oscillation RMS are significantly larger after DDL-920 injection than after saline, indicating that SQ injections of 10 mg/kg DDL-920 potentiated these two measures. In contrast, the frequencies of the θ- and γ-oscillations were not altered by the DDL-920 administration. The P-values shown in the respective colors under the values of the slopes denote the differences between the individual regression line slopes and a slope = 1, i.e., the “no change” line. The frequencies were plotted as the midpoint from the largest values within 10 Hz bins (γ-oscillations) and 1 Hz bins (θ-oscillations), and therefore, in each plot two sample points overlap in the plots giving the impression that only four data points are present.
Fig. 4.
Fig. 4.
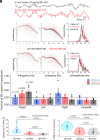
Effects of DDL-920 (10 mg/kg) oral administration with a pipettor on θ- and γ-oscillations recorded in the hippocampi of AD model mice and on their memory test in the Barnes maze. (A) Epochs (1 s long) of in vivo hippocampal recordings of θ and γ-oscillations in an AD model mouse at the indicated times before (black) and after (red) the oral administration of 10 mg/kg DDL-920. (B) Instantaneous amplitude vs frequency plots of the θ- (Left panel) and γ-oscillations (Middle panel) in the same mouse obtained from 120 s long epochs at the same times (black and red) as in A. Right panel: Histograms of the 120 measurements over as many s of the ratios of the averaged γ to θ oscillation amplitudes (P-values are from t-tests). (C) Same plots as in B for the same mouse after receiving a saline (SAL) oral administration 1 wk after the injection in A. Color codes refer to the times before and after SAL administrations. Note the lack of differences between the averaged γ to θ oscillation amplitude ratios after SAL administrations. (D–F) After 2 wk of twice-a-day oral DDL-920 (10 mg/kg) or vehicle (VEH) administration, 15 AD mice and 6 WT animals were subjected to a 1-wk training and probe trials in the Barnes maze while still receiving once daily the DDL-920 or SAL oral administration (please see SI Appendix, Fig. S9 for details). (D) Plot of the fractions of time of the 90 s total time spent in the four quadrants of the Barnes maze (SI Appendix, Fig. S9) on probe day 48 h after the last training session. The target quadrant is the quarter area of the maze that previously contained the escape hole. Vehicle (VEH) treated WT mice and DDL-920-treated (DDL) AD mice spent significantly (probabilities indicated on the graph are from a t-test comparing the group means to a mean value of 0.25) more time than by chance (0.25) in the target quadrant, whereas the VEH-treated AD mice did no better than chance in this quadrant (P-values indicated on the graph are from a t-test comparing the group means to a mean value of 0.25). In addition, a nonparametric Kruskal–Wallis test (P = 0.024) and a one-way ANOVA (P = 0.016) indicate significant differences between the three groups in the target quadrant. Moreover, the multiple comparison Tukey test showed that the WT VEH group was significantly different from the AD VEH group (P = 0.018), but not from the AD DDL-920 treated group (P = 0.642), which in turn was also significantly different from the AD VEH group (P = 0.042). (E) Violin plots of the latencies of the first entries to the escape holes on the 48 h probe day after the training has been concluded. Individual data points are shown as solid circles and the mean values are depicted by a rhomboid symbol. The nonparametric Kruskal–Wallis test indicates that at least two groups are significantly different, and the post hoc nonparametric Tukey test comparing all group means shows that the AD+VEH group is significantly different from both other groups, whereas the AD+DDL and WT+VEH group means are not different from each other (P-values are indicated on the graph). (F) Violin plots of the path lengths until the first entries to the escape holes on the 48 h probe day. Individual data points are shown as solid circles and the mean values are depicted by a rhomboid symbol. The nonparametric Kruskal–Wallis test indicates that at least two groups are significantly different, and the post hoc nonparametric Tukey test comparing all group means shows that the AD+VEH group is significantly different from both other groups, whereas the AD+DDL and WT+VEH group means are not different from each other (P-values are indicated on the graph).

Update of

References

    1. Selkoe D., Mandelkow E., Holtzman D., Deciphering Alzheimer disease. Cold Spring Harb. Perspect. Med. 2, 1–8 (2012). - PMC - PubMed
    1. Couzin-Frankel J., Side effects loom over Alzheimer’s drugs. Science 381, 466–467 (2023). - PubMed
    1. Swaddiwudhipong N., et al. , Pre-diagnostic cognitive and functional impairment in multiple sporadic neurodegenerative diseases. Alzheimer's Dement. 19, 1752–1763 (2022), 10.1002/alz.12802. - DOI - PubMed
    1. Ives-Deliperi V., Butler J. T., Mechanisms of cognitive impairment in temporal lobe epilepsy: A systematic review of resting-state functional connectivity studies. Epilepsy Behav. 115, 107686 (2020). - PubMed
    1. Litvan I., et al. , Diagnostic criteria for mild cognitive impairment in Parkinson’s disease: Movement Disorder Society Task Force guidelines. Mov. Disord. 27, 349–356 (2012). - PMC - PubMed

Substances