. 2024 Aug 6;17(848):eadl1030.
doi: 10.1126/scisignal.adl1030. Epub 2024 Aug 6.

Poly-GR repeats associated with ALS/FTD gene C9ORF72 impair translation elongation and induce a ribotoxic stress response in neurons

Affiliations

Poly-GR repeats associated with ALS/FTD gene C9ORF72 impair translation elongation and induce a ribotoxic stress response in neurons

Daoyuan Dong et al. Sci Signal. .

Abstract

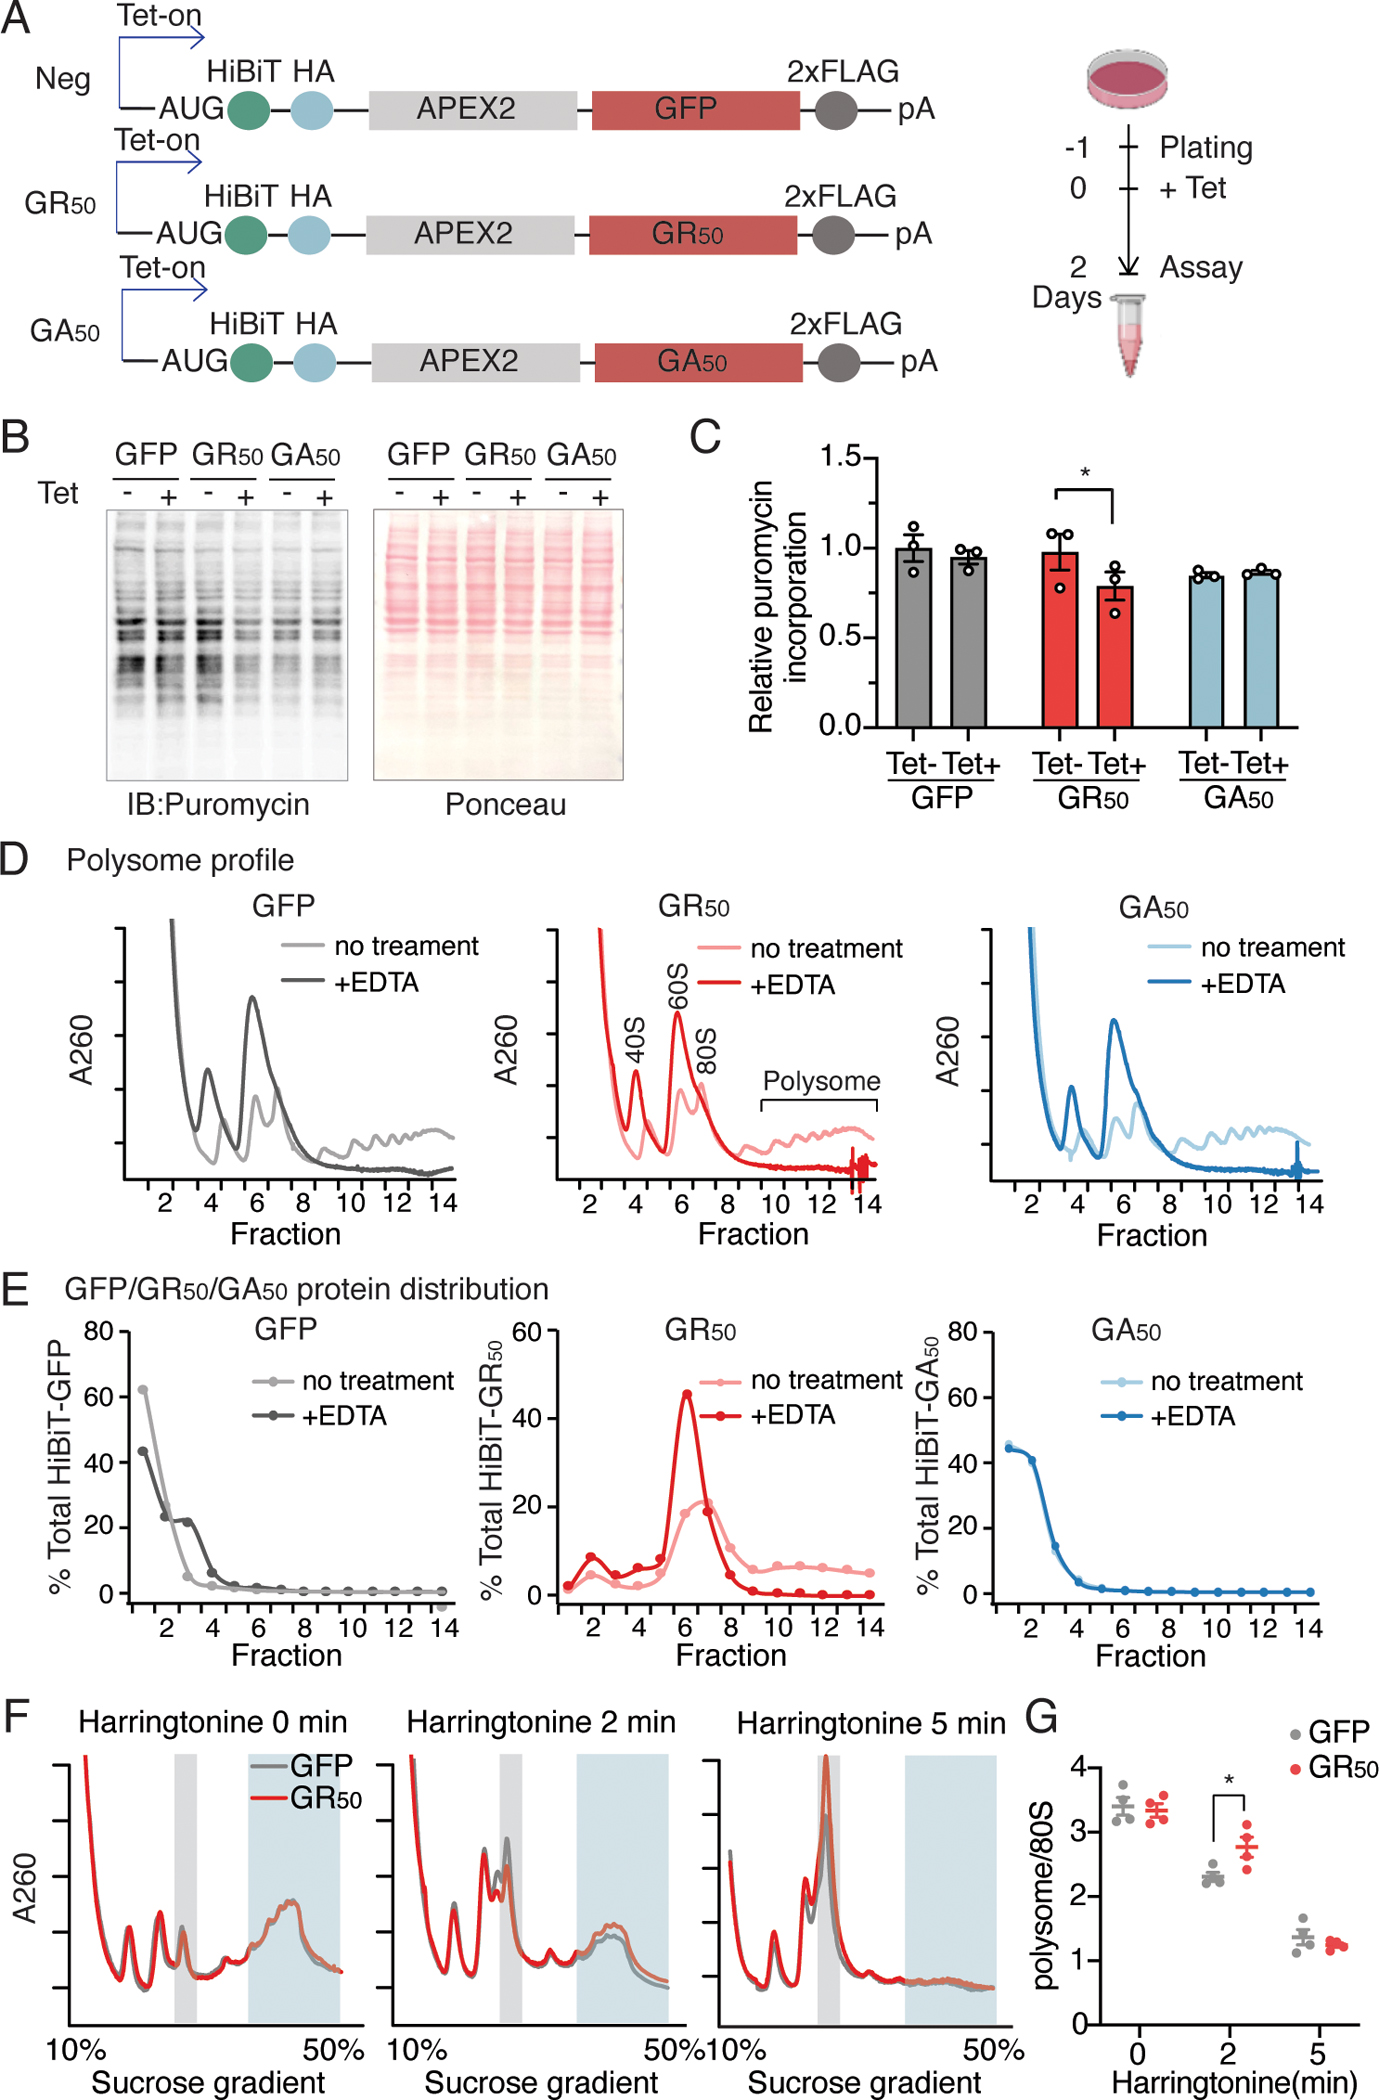
Hexanucleotide repeat expansion in the C9ORF72 gene is the most frequent inherited cause of amyotrophic lateral sclerosis (ALS) and frontotemporal dementia (FTD). The expansion results in multiple dipeptide repeat proteins, among which arginine-rich poly-GR proteins are highly toxic to neurons and decrease the rate of protein synthesis. We investigated whether the effect on protein synthesis contributes to neuronal dysfunction and degeneration. We found that the expression of poly-GR proteins inhibited global translation by perturbing translation elongation. In iPSC-differentiated neurons, the translation of transcripts with relatively slow elongation rates was further slowed, and stalled, by poly-GR. Elongation stalling increased ribosome collisions and induced a ribotoxic stress response (RSR) mediated by ZAKα that increased the phosphorylation of the kinase p38 and promoted cell death. Knockdown of ZAKα or pharmacological inhibition of p38 ameliorated poly-GR-induced toxicity and improved the survival of iPSC-derived neurons from patients with C9ORF72-ALS/FTD. Our findings suggest that targeting the RSR may be neuroprotective in patients with ALS/FTD caused by repeat expansion in C9ORF72.


Conflict of interest statement

Competing interests: The authors declare that they have no competing interests.

Figures

Fig. 1.
Fig. 1.. Poly-GR associates with 60S large ribosome subunit and suppresses translation elongation.
(A) Schematic diagram of the GFP, GR50, or GA50 expressing reporter constructs that are stably engineered in HeLa Flp-In cells. (B) Puromycin incorporation assay of HeLa Flp-In reporter cells. Immunoblotting of metabolic labeling with puromycin, and ponceau staining as loading control. (C) Quantification of three independent biological replicates of the puromycin incorporation assay. Data are mean ± SEM. *P<0.05, one-tailed Mann-Whitney test. (D) Polysome profiles of HeLa Flp-In reporter cells expressing GFP, GR50, or GA50 with no treatment or treated with 20 mM EDTA. (E) Quantification of GFP, GR50 or GA50 expression across the polysome profiles in (D) by N-terminal HiBiT tag bioluminescence measurement. The relative levels in each fraction were calculated as percentage of the total levels from all the fractions. (F) Representative polysome profiles of HeLa Flp-In reporter cells for ribosome runoff assay before (0 min) and after harringtonine treatment (2 μg/ml, 2 min and 5 min). (G) Quantification of polysome (blue shade) to monosome (grey shade) ratio of (F) from four biological replicates (area under the curve). Data are mean ± SEM. *P<0.05, ANOVA with Bonferroni’s multiple comparisons.
Fig. 2.
Fig. 2.. Single molecule imaging of AUG-SunTag-NLuc reporter showed poly-GR slows down translation elongation.
(A) Diagram of the single molecule AUG-SunTag-NLuc reporter construct. (B) Snap shots from videos of ribosome runoff experiment for CTRL and GR20 treated cells, respectively. Scale bar = 2 μm. Example translation intensity traces for (C) CTRL and (D) GR20 treated cells after harringtonine treatment. (E) The survival curves of translation sites as a function of time after harringtonine treatment. Dashed line represents 50% of mRNAs with completed runoff (disappearance of translation signal on RNA). Shadow areas are 95% confidence bounds (Greenwood’s formula). CTRL: 10 cells, 125 TLS; GR20: 8 cells, 178 TLS. ****P<0.0001, log-rank Mantel-Cox test.
Fig. 3.
Fig. 3.. Poly-GR influences ribosome translocation on specific mRNAs in i3Neurons.
(A) Schematic diagram of ribosome runoff coupled with mRNA-seq assay. mRNA from input, medium and heavy polysome fractions were subjected to high-throughput RNA-seq. (B) Unsupervised hierarchical clustering and heatmap of all differentially expressed genes with distinct ribosome runoff patterns. Differentially expressed genes were detected via ANOVA analysis, with adjusted P-value < 0.05 from F-test. (C) KEGG pathway enrichment of genes in clusters 3 and 4 in (B). (D) Normalized read counts of ABCE1 in heavy fractions from runoff-RNA-seq shown by IGV. (E) qRT-PCR validation of ABCE1 from ribosome runoff assay. Data are mean ± SEM, N=6. *P<0.05, Kruskal-Wallis test. (F) Genes stalled by poly-GR were enriched with known stalling motifs. The number of known stalling motifs was counted for each gene. (G) Immunoblots of ABCE1 and quantification in i3Neurons expressing GFP, GR50 or GA50 for 10 days from three independent experiments. Data are mean ± SEM. **P<0.01, Kruskal-Wallis test. (H) Immunoblots of ABCE1 and quantification from 5 control and 5 patient iPSN lines. β-actin was blotted as internal control. Data are mean ± SEM. **P<0.01, two-tailed unpaired Mann–Whitney test. (I) qRT-PCR quantification of ABCE1 RNA levels from the same 5 control and 5 patient iPSN lines. Data are mean ± SEM. Two-tailed Mann-Whitney test. (J) Cumulative fraction of the protein levels comparing C9 versus CTRL groups from the AnswerALS proteomics dataset. Red line represents translation stalled genes from the runoff-seq data. Grey line represents all the unstalled genes from the proteomics database. P value was calculated by two-sided nonparametric K-S test.
Fig. 4.
Fig. 4.. Poly-GR activates p38 MAPK through ZAKα-mediated ribotoxic stress pathway.
(A) Immunoblots for phosphorylated p38, JNK, eIF2α and total p38 in i3Neurons expressing GFP or GR50, with no or increasing dose of ANS treatment (0, 0.004, 0.02, 0.1 μg/ml) for 20 min. (B) Quantification of phosphorylated p38 (p-p38) normalized to p38 from (A). N=5, Data are mean ± SEM. *P<0.05, two-way ANOVA, uncorrected Fisher’s LSD test. Both p-p38 bands are quantified. (C) Immunoblots for ubiquitylated RPS10 in i3Neurons expressing GFP or GR50, with increasing ANS treatment (0, 0.004, 0.02, 0.1 μg/ml) as in (A). *non-specific band. (D) Quantification of ub-RPS10 normalized to total RPS10 from (C). N=3, Data are mean ± SEM. *P<0.05, two-way ANOVA, uncorrected Fisher’s LSD test. (E) Immunoblots for phos-tag gels detecting phosphorylated ZAKα in i3Neurons stably expressing WT or K45A mutant ZAKα. The cells were either treated with 0.1 μg/ml ANS or transduced with GFP or GR50 lentivirus. (F) Quantification of phos-ZAK normalized to total ZAK from (F). N=3, Data are mean ± SEM. *P<0.05, **P<0.01, two-way ANOVA followed by Tukey’s post hoc test. (G) Immunoblots for phosphorylated p38, JNK, and eIF2α in i3Neurons with ZAKα knockdown or with exogenous expression of WT or K45A ZAKα. The cells were transduced with GFP or GR50 lentivirus. (H) Quantification of p-p38 normalized to p38 from (G). N=3, Data are mean ± SEM. *P<0.05, **P<0.01, two-way ANOVA followed by Tukey’s post hoc test. (I) Immunoblots for phosphorylated p38, JNK, and eIF2α in the C9ORF72-ALS/FTD patient-derived iPSN and the isogenic control line. (J) Quantification of p-p38 normalized to p38 from (I). N=3, Data are mean ± SEM. *P<0.05, two-way ANOVA followed by Bonferroni’s multiple comparison.
Fig. 5.
Fig. 5.. Genetic knockdown of ZAKα or p38 inhibitor improves neuronal survival.
(A) Representative images of PI staining and bright field imaging of i3Neurons differentiated from control or ZAKα knockdown iPSCs. GFP, GR50 or GA50 were expressed on differentiation day 5 and images were taken on day 14. Scale bar = 60 μm. (B) Cell death quantification by PI staining of i3Neurons in (A). Each dot represents a biological replicate, >300 cells per replicate from total three replicates. Data are mean ± SEM. *P<0.05, **P<0.01, ANOVA with Tukey’s multiple comparison. (C) Representative images of PI staining of i3Neurons expressing GFP, GR50 or GA50 treated with or without VX-745. Scale bar = 60 μm. (D) Cell death quantification by PI staining of i3Neurons in (C). Each dot represents a biological replicate, around 300 cells/replicate from three replicates. Data are mean ± SEM. *P<0.05, ANOVA with Tukey’s multiple comparison. (E) Cell death quantification by LDH release assay in control or ZAKα knockdown cells expressing GFP, GR50 or GA50. Three independent experiments. Data are mean ± SEM. **P<0.01, ANOVA with Tukey’s multiple comparison. (F) Cell death quantification by LDH release assay in i3Neurons expressing GFP, GR50 or GA50 treated with or without VX-745. Three independent experiments. Data are mean ± SEM. *P<0.05, ANOVA with Tukey’s multiple comparison. (G) Diagram of i3Neuron differentiation and experiment timeline. (H) Representative images of Hoechst and PI staining of control and C9ORF72-ALS/FTD patient iPSNs in the glutamate-induced excitotoxicity assay. The iPSNs were infected with lentivirus expressing control or ZAKα shRNA ten days prior to the experiment. Scale bar = 30 μm. (I) Quantification of neuronal death by PI staining upon glutamate induced excitotoxicity in (F). Different shapes represent individual iPSN lines from 5 control and 5 patients. > 800 cells were quantified per line per condition. Data are mean ± SEM. **P<0.01, ***P<0.001, two tailed paired Student’s t test. (J) Representative images of control and patient iPSNs in the glutamate-induced excitotoxicity assay. Cells were pretreated with DMSO or 10 μM VX-475 4 hours prior to the experiment. Scale bar = 30 μm. (K) Quantification of neuronal death by PI staining in (H). Different shapes represent individual iPSN lines from 5 control and 5 patients. >800 cells per line per condition. Data are mean ± SEM. **P<0.01, ***P<0.001, two tailed paired Student’s t test.
Fig. 6.
Fig. 6.. Working model of poly-GR mediated toxicity through translation impairment and RSR activation.
Poly-GR slows down translation elongation and sensitizes neurons to a ZAKα-mediated ribotoxic stress response (RSR). Inhibition of this pathway improved the survival of neurons and may have therapeutic potential for C9ORF72-ALS/FTD patients. Images created with BioRender.

References

    1. Kiernan MC, Vucic S, Talbot K, McDermott CJ, Hardiman O, Shefner JM, Al-Chalabi A, Huynh W, Cudkowicz M, Talman P, Van den Berg LH, Dharmadasa T, Wicks P, Reilly C, Turner MR, Improving clinical trial outcomes in amyotrophic lateral sclerosis. Nat Rev Neurol 17, 104–118 (2021). - PMC - PubMed
    1. Katzeff JS, Bright F, Phan K, Kril JJ, Ittner LM, Kassiou M, Hodges JR, Piguet O, Kiernan MC, Halliday GM, Kim WS, Biomarker discovery and development for frontotemporal dementia and amyotrophic lateral sclerosis. Brain 145, 1598–1609 (2022). - PMC - PubMed
    1. DeJesus-Hernandez M, Mackenzie IR, Boeve BF, Boxer AL, Baker M, Rutherford NJ, Nicholson AM, Finch NA, Flynn H, Adamson J, Kouri N, Wojtas A, Sengdy P, Hsiung GY, Karydas A, Seeley WW, Josephs KA, Coppola G, Geschwind DH, Wszolek ZK, Feldman H, Knopman DS, Petersen RC, Miller BL, Dickson DW, Boylan KB, Graff-Radford NR, Rademakers R, Expanded GGGGCC hexanucleotide repeat in noncoding region of C9ORF72 causes chromosome 9p-linked FTD and ALS. Neuron 72, 245–256 (2011). - PMC - PubMed
    1. Renton AE, Majounie E, Waite A, Simón-Sánchez J, Rollinson S, Gibbs JR, Schymick JC, Laaksovirta H, van Swieten JC, Myllykangas L, Kalimo H, Paetau A, Abramzon Y, Remes AM, Kaganovich A, Scholz SW, Duckworth J, Ding J, Harmer DW, Hernandez DG, Johnson JO, Mok K, Ryten M, Trabzuni D, Guerreiro RJ, Orrell RW, Neal J, Murray A, Pearson J, Jansen IE, Sondervan D, Seelaar H, Blake D, Young K, Halliwell N, Callister JB, Toulson G, Richardson A, Gerhard A, Snowden J, Mann D, Neary D, Nalls MA, Peuralinna T, Jansson L, Isoviita VM, Kaivorinne AL, Hölttä-Vuori M, Ikonen E, Sulkava R, Benatar M, Wuu J, Chiò A, Restagno G, Borghero G, Sabatelli M, Heckerman D, Rogaeva E, Zinman L, Rothstein JD, Sendtner M, Drepper C, Eichler EE, Alkan C, Abdullaev Z, Pack SD, Dutra A, Pak E, Hardy J, Singleton A, Williams NM, Heutink P, Pickering-Brown S, Morris HR, Tienari PJ, Traynor BJ, I. Consortium, A hexanucleotide repeat expansion in C9ORF72 is the cause of chromosome 9p21-linked ALS-FTD. Neuron 72, 257–268 (2011). - PMC - PubMed
    1. Ash PE, Bieniek KF, Gendron TF, Caulfield T, Lin WL, Dejesus-Hernandez M, van Blitterswijk MM, Jansen-West K, Paul JW, Rademakers R, Boylan KB, Dickson DW, Petrucelli L, Unconventional translation of C9ORF72 GGGGCC expansion generates insoluble polypeptides specific to c9FTD/ALS. Neuron 77, 639–646 (2013). - PMC - PubMed

MeSH terms

Substances

Supplementary concepts