. 2024 Oct 15;84(20):3337-3353.
doi: 10.1158/0008-5472.CAN-24-0030.

Natural Killer Cell Regulation of Breast Cancer Stem Cells Mediates Metastatic Dormancy

Affiliations

Natural Killer Cell Regulation of Breast Cancer Stem Cells Mediates Metastatic Dormancy

Grace G Bushnell et al. Cancer Res. .

Abstract

Patients with breast cancer with estrogen receptor-positive tumors face a constant risk of disease recurrence for the remainder of their lives. Dormant tumor cells residing in tissues such as the bone marrow may generate clinically significant metastases many years after initial diagnosis. Previous studies suggest that dormant cancer cells display "stem-like" properties (cancer stem cell, CSC), which may be regulated by the immune system. To elucidate the role of the immune system in controlling dormancy and its escape, we studied dormancy in immunocompetent, syngeneic mouse breast cancer models. Three mouse breast cancer cell lines, PyMT, Met1, and D2.0R, contained CSCs that displayed short- and long-term metastatic dormancy in vivo, which was dependent on the host immune system. Each model was regulated by different components of the immune system. Natural killer (NK) cells were key for the metastatic dormancy phenotype in D2.0R cells. Quiescent D2.0R CSCs were resistant to NK cell cytotoxicity, whereas proliferative CSCs were sensitive. Resistance to NK cell cytotoxicity was mediated, in part, by the expression of BACH1 and SOX2 transcription factors. Expression of STING and STING targets was decreased in quiescent CSCs, and the STING agonist MSA-2 enhanced NK cell killing. Collectively, these findings demonstrate the role of immune regulation of breast tumor dormancy and highlight the importance of utilizing immunocompetent models to study this phenomenon. Significance: The immune system controls disseminated breast cancer cells during disease latency, highlighting the need to utilize immunocompetent models to identify strategies for targeting dormant cancer cells and reducing metastatic recurrence. See related commentary by Cackowski and Korkaya, p. 3319.


Conflict of interest statement

G.G. Bushnell reports grants from the National Institutes of Health during the conduct of the study. M. Burness reports grants from Pfizer and GSK during the conduct of the study and grants from Cyteir outside the submitted work. M.S. Wicha reports grants from NCI and Breast Cancer Research Foundation during the conduct of the study. No disclosures were reported by the other authors.

Figures
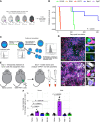
Figure 1.
Figure 1.
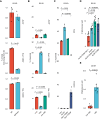
PyMT, Met1, and D2.0R murine mammary carcinoma cell lines exhibit long-term metastatic dormancy and short-term quiescence in bone marrow. A, Schematic for evaluation of long-term dormancy in vivo. B, Evaluation of survival for mice injected with 100,000 PyMT, Met1, D2.0R, D2A1, or E0771 cells. C, Schematic for fluorescent label retention as a readout for quiescent cells. D, Representative fluorescence micrographs for D2.0R cells labeled with PKH67 (top) or CTFR (bottom) and allowed to proliferate for 7 days in vitro before antibody labeling with Ki67 to determine the association of label retention and Ki67 proliferation marker. E, Schematic for fluorescent label retention as a readout for quiescent cells in short-term dormancy assay in vivo. F, Quantification of LRC in femurs or tibias of mice injected with PyMT, Met1, or D2.0R cells normalized to the naïve control. P values were calculated using Student t test (for normally distributed data) or Wilcoxon test with Bonferroni correction for multiple comparisons when appropriate (*, P < 0.05; **, P < 0.01; ***, P < 0.001; ****, P < 0.0001). Survival curves were compared via log-rank test calculation of P value. Post hoc hypothesis testing was performed using the Wilcoxon rank sum test corrected with Bonferroni. P values are as follows: Met1 vs. PyMT, P = 0.494; D2.0R vs. PyMT, P = 0.018; D2A1 vs. PyMT, P = 0.042; E0771 vs. PyMT, P = 0.021; Met1 vs. D2.0R, P = 0.274; Met1 vs. D2A1, P = 0.042; Met1 vs. E0771, P = 0.021; D2A1 vs. D2.0R, P = 0.042; E0771 vs. D2.0R, P = 0.021.
Figure 2.
Figure 2.
Murine cell lines contain an epithelial, proliferative cancer stem cell and a mesenchymal, quiescent cancer stem cell population. A, Flow cytometry evaluation of cancer stem cell markers ALDH (top), Sca1CD90+ (middle), and Sca1+CD90 (bottom) for D2.0R cell line in 2D (2% FBS tissue culture treated flasks) and 3D (mammosphere media ultralow attachment flasks) reported as fold change from 2D. B, Flow cytometry evaluation of cancer stem cell markers ALDH (top), Sca1CD90+ (middle), and Sca1+CD90 (bottom) for D2.0R cell line in 2D (2% FBS tissue culture–treated flasks) as a percentage of parental population (live, LRC or non-LRC). C, Flow cytometry evaluation of E-cadherin (Ecad) and vimentin as a percentage of parental population (live, ALDH+, Sca1+CD90, and Sca1CD90+) for the D2.0R cell line. D, Quantification of sphere formation for each population (ALDHCD90Sca1, ALDH+, ALDHCD90Sca1+, and ALDHCD90+) for the D2.0R cell line. E, Quantification of sphere formation for non-LRC vs. LRC after FACS. P values were calculated using Student t test (for normally distributed data) or Wilcoxon test with Bonferroni correction for multiple comparisons when appropriate (*, P < 0.05; **, P < 0.01; ***, P < 0.001; ****, P < 0.0001).
Figure 3.
Figure 3.
PyMT, Met1, and D2.0R metastatic dormancy is dependent upon the immune system. A, Schematic for long-term dormancy assays in vivo to test the role of the immune system in dormancy maintenance by comparing survival times for syngeneic mice versus NSG (no T, B, nor NK cells) and NOD scid (no T nor B cells) for each cell line. B, Evaluation of survival for mice (FVB/N, NSG, or NOD scid) injected with 100,000 PyMT cells. C, Evaluation of survival for mice (FVB/N, NSG, or NOD scid) injected with 100,000 Met1 cells. D, Evaluation of survival for mice (BALB/c, NSG, or NOD scid) injected with 100,000 D2.0R cells. E, Schematic for long-term dormancy assay to quantify bioluminescence over time and survival for mice injected with 100,000 D2.0R cells expressing CBG luciferase. F, Bioluminescence quantification (total flux per animal) over time in NOD scid or NSG mice. G, Survival of NOD scid or NSG mice injected intracardiac with 100,000 D2.0R-CBG+ cells. Survival curves were compared via log-rank test calculation of P value. Post hoc hypothesis testing was performed using the Wilcoxon rank sum test corrected with Bonferroni. P values for PyMT are as follows: NOD scid vs. FVB/N, P = 0.0003; NSG vs. FVB/N, P = 0.0008; NSG vs. NOD scid, P = 0.244. P values for Met1 are as follows: NOD scid vs. FVB/N, P = 0.072; NSG vs. FVB/N, P = 0.18; NSG vs. NOD scid, P = 0.44. P values for D2.0R are as follows: NOD scid vs. BALB/c, P = 1; NSG vs. BALB/c, P = 0.02; NSG vs. NOD scid, P = 0.18. P values were calculated using Student t test with Bonferroni correction for multiple comparisons when appropriate (*, P < 0.05; **, P < 0.01; ***, P < 0.001; ****, P < 0.0001).
Figure 4.
Figure 4.
D2.0R metastatic dormancy is partially controlled by NK cells. A, Schematic for long-term dormancy assay in vivo to test the role of NK cells in dormancy maintenance by comparing survival times for mice injected with 100,000 D2.0R-CBG+ cells intracardiac and treated with antiasialo GM1 (anti-ASGM1) to deplete NK cells or normal rabbit serum (NRS) as a control. B, Bioluminescence quantification (log10 of total flux in photons/second) over time in mice inoculated with luciferase-expressing D2.0R cells and treated with normal rabbit serum or anti-ASGM1. C, Evaluation of survival times for mice inoculated with 10,000 D2.0R-CBG+ cells intracardiac and treated with anti-ASGM1 or normal rabbit serum. D, Schematic for long-term dormancy assay in vivo to test the role of macrophages in dormancy maintenance by comparing survival times for mice injected with 100,000 D2.0R-CBG+ cells intracardiac and treated with Clodrosome to deplete macrophages or Encapsome as a control. E, Bioluminescence quantification (log10 of total flux in photons/second) over time in mice inoculated with luciferase-expressing D2.0R cells and treated with Encapsome or Clodrosome. F, Evaluation of survival times for mice inoculated with 10,000 D2.0R-CBG+ cells intracardiac and treated with Encapsome or Clodrosome. P values were calculated using ANOVA. Survival curves were compared via log-rank test calculation of P value.
Figure 5.
Figure 5.
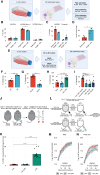
Quiescent D2.0R cells are more resistant to NK cytotoxicity compared with proliferative D2.0R cells in vitro and in vivo. A, Experimental schematic for indirect analysis of NK cytotoxicity via performing NK coculture cytotoxicity assay and evaluating cancer stem cell markers, EMT markers, and fluorescent label retention with and without NK cells via flow cytometry. B, Flow cytometry evaluation of ALDH+, CD90+Sca1, and CD90Sca1+ as a percentage of live cells in tumor cells cultured alone (target only) or cultured with NK cells (target + NK). C, Flow cytometry evaluation of EpCAM and vimentin as a percentage of live tumor cells cultured alone (target only) or cocultured with NK cells (target + NK). D, Flow cytometry evaluation of LRC as a percentage of live tumor cells cultured alone (target only) or cocultured with NK cells (target + NK). E, Experimental schematic for direct analysis of NK cytotoxicity via performing 2D or 3D culture, FACS for ALDH+, and FACS for LRC D2.0R cells before NK cytotoxicity assay analysis via CytoTox96 quantification of LDH. F, Percent NK-driven cytotoxicity of D2.0R cells cultured in 2D (2% FBS and tissue culture–treated flasks) and 3D (mammosphere media and ultralow attachment flasks) measured by LDH quantification with CytoTox96. G, Percent NK-driven cytotoxicity of FACS-sorted bulk and ALDH+ D2.0R cells measured by bioluminescence quantification of D2.0R-CBG cells using sorted cells without NK cells as the control for 100% viability or 0% cytotoxicity for each condition. H, Percent NK-driven cytotoxicity of FACS-sorted bulk, LRC, and non-LRC D2.0R cells measured by LDH quantification with CytoTox96. I, Percent NK-driven cytotoxicity of FACS-sorted non-LRC ALDH, non-LRC ALDH, LRC ALDH, and LRC-ALDH+ D2.0R cells measured by bioluminescence quantification of D2.0R-CBG cells using sorted cells of each population cultured without NK cells as the control for 0% cytotoxicity for each condition. J, Experimental schematic for analysis of CD90+ expression and maintenance of label-retaining D2.0R cells after intracardiac inoculation. K, Flow cytometry quantification of CD90 marker expression as a percentage of parental (live, non-LRC, or LRC) D2.0R cells isolated from bone marrow. L, Experimental schematic for analysis of sensitivity of non-LRC and LRC sensitivity to NK cells and growth in vivo after inoculation of 10,000 non-LRC or LRC D2.0R-CBG+ cells into the fourth left and right mammary fat pads of NSG or NOD scid mice and monitored over time with bioluminescence. M, Quantification of bioluminescent signal over time for NSG mice inoculated with 100,00 non-LRC or LRC D2.0R-CBG+ cells. N, Quantification of bioluminescent signal over time for NOD scid mice inoculated with 100,00 non-LRC or LRC D2.0R-CBG+ cells. P values were calculated using Student t test (for normally distributed data) or Wilcoxon test with Bonferroni correction for multiple comparisons when appropriate. *, P < 0.05; **, P < 0.01; ***, P < 0.001; ****, P < 0.0001. (A and E, Created with BioRender.com.)
Figure 6.
Figure 6.
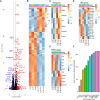
Bulk RNA sequencing of LRC and non-LRC D2.0R cells identifies drivers of NK cell resistance in LRC. A, Volcano plot of differentially expressed genes upregulated in LRCs (red) and non-LRCs (blue). B, Heatmap of differentially expressed genes with log2-fold change > 2 and adjusted P value < 0.05. C, Heatmap of NK ligand gene expression. D, Heatmap of MHC gene expression. E, Heatmap of STING target gene expression. F, ChEA3 analysis of predicted transcription factors driving differentially expressed genes in LRC, stemness, EMT, complement, and MHC gene expression via sum of ranks of predicted transcription factors for all gene sets tested.
Figure 7.
Figure 7.
Bach1 and Sox2 expression partially control NK-resistant phenotype of quiescent D2.0R cells. A, Western blot for Sox2 and β-actin protein in D2.0R-CBG cells with doxycycline-inducible knockdown of shScr (control), shBach1, or shSox2 with or without doxycycline (Dox) treatment. B, Quantification of Western blot normalized to β-actin and 0 μg/mL doxycycline condition for each cell line. C, NK cytotoxicity for inducible knockdown cell lines D2.0R-CBG shScr (control), shBach1, or shSox2 treated with 0 μg/mL doxycycline or 1 μg/mL doxycycline. D–I, Tumor growth as measured by bioluminescence of D2.0R-CBG cell lines with inducible knockdown of shScr (control), shBach1, or shSox2 in mice that have NK cells (NOD scid; D–F) or do not have NK cells (NSG; G–I), comparing tumor growth over time via ANOVA between mice treated with control water or water containing doxycycline over the course of the experiment. P values were calculated using Student t test (normally distributed data) or Wilcoxon test with Bonferroni correction when appropriate. For tumor growth over time, P values were calculated using ANOVA.
Figure 8.
Figure 8.
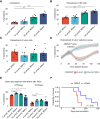
STING agonist MSA-2 increases NK cell killing in vitro and increases survival of mice inoculated with D2.0R cells intracardiac in vivo. A, MSA-2 cotreatment increases NK cell killing in vitro with D2.0R cells. B, Overnight MSA-2 pretreatment of NK cells increases killing of D2.0R cells in vitro. C, Overnight pretreatment of tumor cells with MSA-2 does not alter NK cell killing after 16 to 24 hours. D, Overnight pretreatment of tumor cells with MSA-2 alters NK cell killing after 48 hours. E, One week pretreatment of sorted LRCs or non-LRCs with varying doses of MSA-2 increases NK cell killing after 16 to 24 hours. F, MSA-2 increases survival in vivo after one treatment with 1 mg of MSA-2 7 days after intracardiac inoculation of 100,000 D2.0R tumor cells into BALB/c mice. P values were calculated using Student t test with Bonferroni correction for multiple comparisons when appropriate. *, P < 0.05; **, P < 0.01; ***, P < 0.001. For survival Kaplan–Meier curves, P values were calculated using log-rank test.

Update of

References

    1. Siegel RL, Miller KD, Wagle NS, Jemal A. Cancer statistics, 2023. CA Cancer J Clin 2023;73:17–48. - PubMed
    1. Pan H, Gray R, Braybrooke J, Davies C, Taylor C, McGale P, et al. . 20-year risks of breast-cancer recurrence after stopping endocrine therapy at 5 years. N Engl J Med 2017;377:1836–46. - PMC - PubMed
    1. Bushnell GG, Deshmukh AP, den Hollander P, Luo M, Soundararajan R, Jia D, et al. . Breast cancer dormancy: need for clinically relevant models to address current gaps in knowledge. NPJ Breast Cancer 2021;7:66. - PMC - PubMed
    1. Hanna N, Burton RC. Definitive evidence that natural killer (NK) cells inhibit experimental tumor metastases in vivo. J Immunol 1981;127:1754–8. - PubMed
    1. Malladi S, Macalinao DG, Jin X, He L, Basnet H, Zou Y, et al. . Metastatic latency and immune evasion through autocrine inhibition of WNT. Cell 2016;165:45–60. - PMC - PubMed

Substances