

Diffusion tensor analysis of white matter tracts is prognostic of persisting post-concussion symptoms in collegiate athletes
- PMID: 39106542
- PMCID: PMC11347060
- DOI: 10.1016/j.nicl.2024.103646
Diffusion tensor analysis of white matter tracts is prognostic of persisting post-concussion symptoms in collegiate athletes
Abstract
Background and objectives: After a concussion diagnosis, the most important issue for patients and loved ones is how long it will take them to recover. The main objective of this study is to develop a prognostic model of concussion recovery. This model would benefit many patients worldwide, allowing for early treatment intervention.
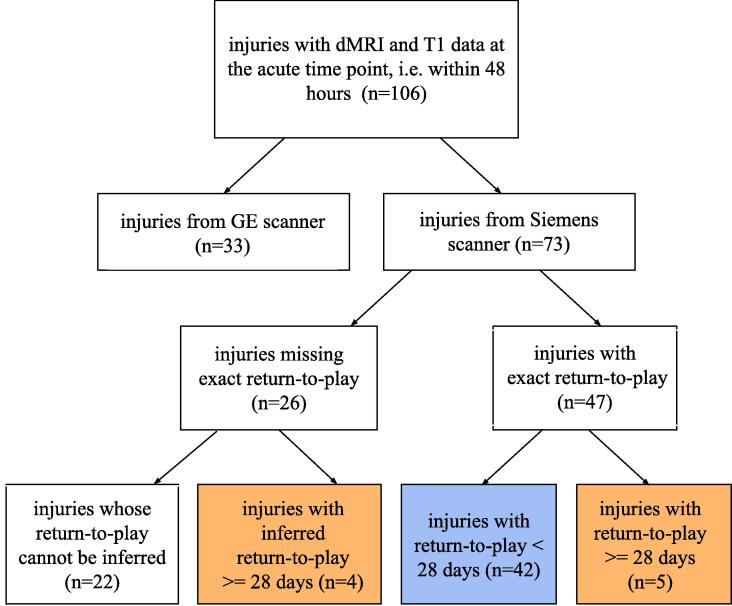
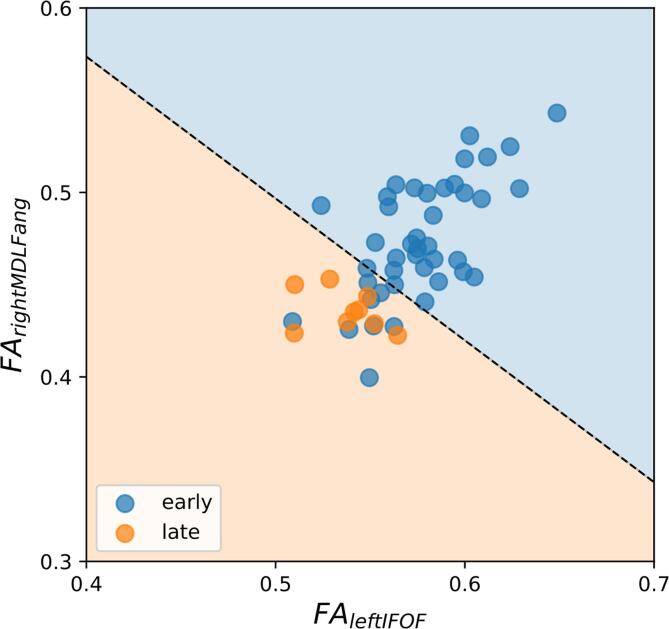
Methods: The Concussion Assessment, Research and Education (CARE) consortium study enrolled collegiate athletes from 30 sites (NCAA athletic departments and US Department of Defense service academies), 4 of which participated in the Advanced Research Core, which included diffusion-weighted MRI (dMRI) data collection. We analyzed the dMRI data of 51 injuries of concussed athletes scanned within 48 h of injury. All athletes were cleared to return-to-play by the local medical staff following a standardized, graduated protocol. The primary outcome measure is days to clearance of unrestricted return-to-play. Injuries were divided into early (return-to-play < 28 days) and late (return-to-play >= 28 days) recovery based on the return-to-play clinical records. The late recovery group meets the standard definition of Persisting Post-Concussion Symptoms (PPCS). Data were processed using automated, state-of-the-art, rigorous methods for reproducible data processing using brainlife.io. All processed data derivatives are made available at https://brainlife.io/project/63b2ecb0daffe2c2407ee3c5/dataset. The microstructural properties of 47 major white matter tracts, 5 callosal, 15 subcortical, and 148 cortical structures were mapped. Fractional Anisotropy (FA) and Mean Diffusivity (MD) were estimated for each tract and structure. Correlation analysis and Receiver Operator Characteristic (ROC) analysis were then performed to assess the association between the microstructural properties and return-to-play. Finally, a Logistic Regression binary classifier (LR-BC) was used to classify the injuries between the two recovery groups.
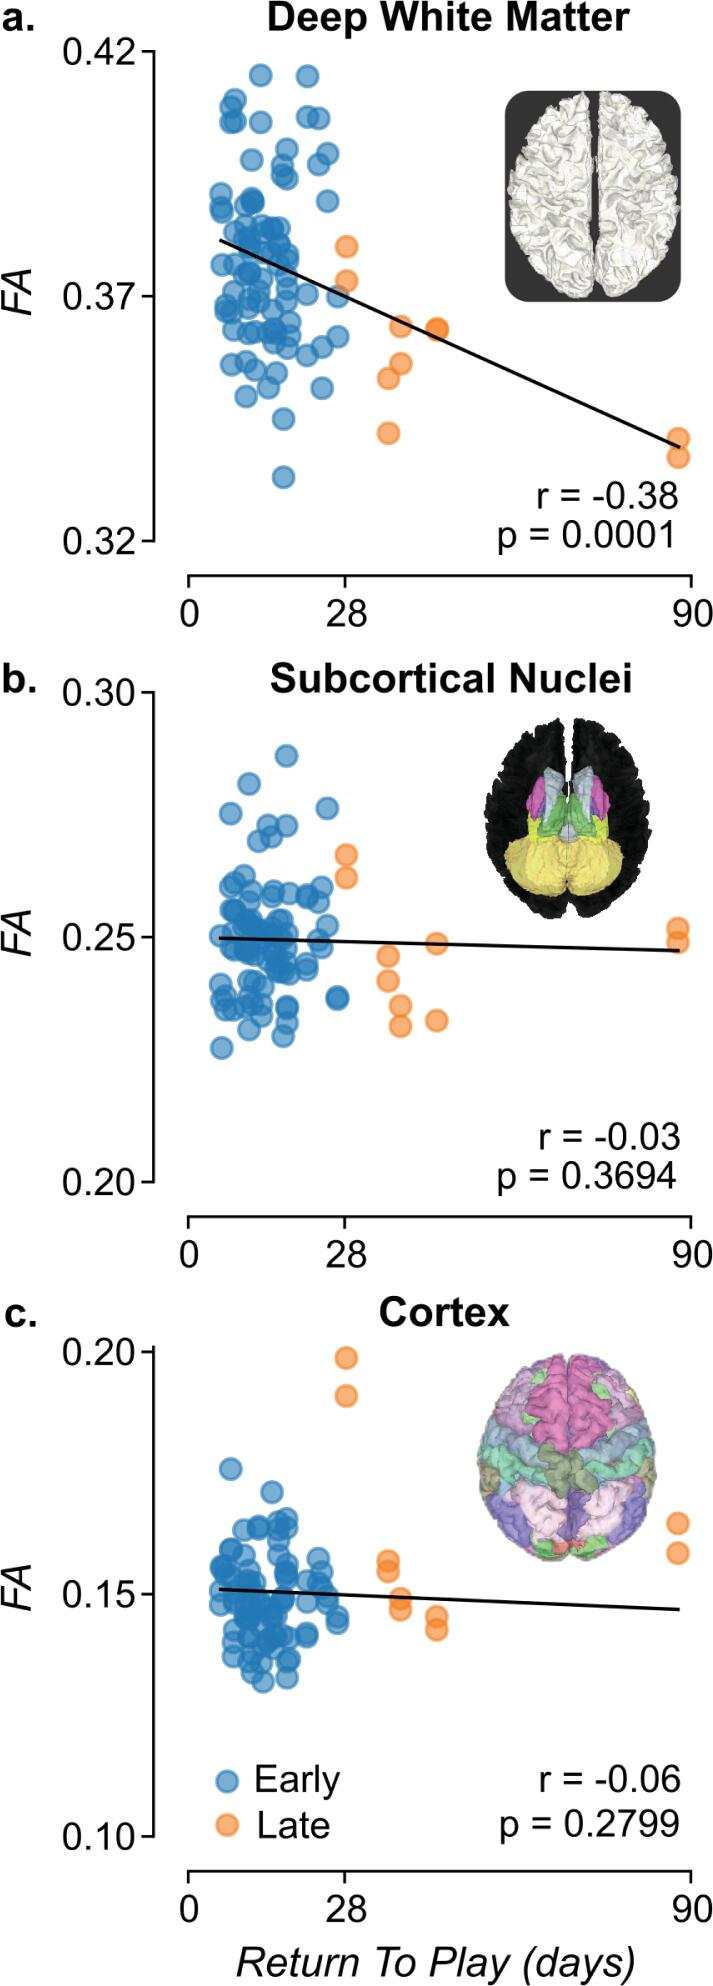
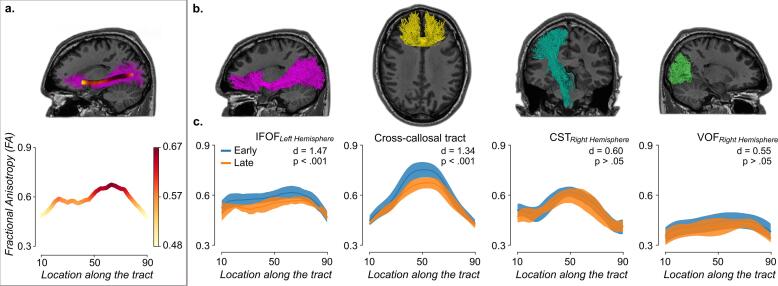
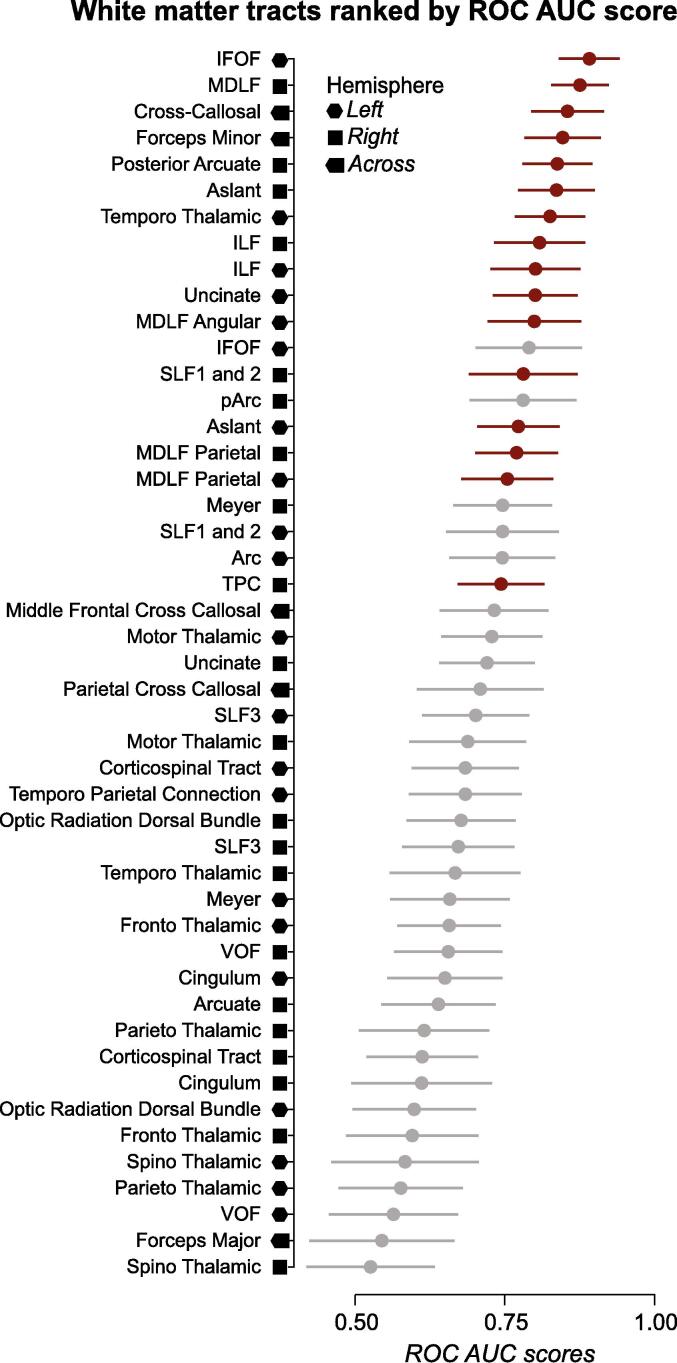
Results: The mean FA across all white matter volume was negatively correlated with return-to-play (r = -0.38, p = 0.00001). No significant association between mean MD and return-to-play was found, neither for FA nor MD for any other structure. The mean FA of 47 white matter tracts was negatively correlated with return-to-play (rμ = -0.27; rσ = 0.08; rmin = -0.1; rmax = -0.43). Across all tracts, a large mean ROC Area Under the Curve (AUCFA) of 0.71 ± 0.09 SD was found. The top classification performance of the LR-BC was AUC = 0.90 obtained using the 16 statistically significant white matter tracts.
Discussion: Utilizing a free, open-source, and automated cloud-based neuroimaging pipeline and app (https://brainlife.io/docs/tutorial/using-clairvoy/), a prognostic model has been developed, which predicts athletes at risk for slow recovery (PPCS) with an AUC=0.90, balanced accuracy = 0.89, sensitivity = 1.0, and specificity = 0.79. The small number of participants in this study (51 injuries) is a significant limitation and supports the need for future large concussion dMRI studies and focused on recovery.
Keywords: Collegiate athletes; Diffusion tensor analysis; Mild Traumatic Brain Injury (mTBI); Persisting post-concussion symptoms (PPCS); Prognostic model; White matter.
Copyright © 2024. Published by Elsevier Inc.
Conflict of interest statement
Declaration of Competing Interest The authors declare the following financial interests/personal relationships which may be considered as potential competing interests: Dr Broglio has current or past research funding from the National Institutes of Health; Centers for Disease Control and Prevention; Department of Defense – USA Medical Research Acquisition Activity, National Collegiate Athletic Association; National Athletic Trainers’ Association Foundation; National Football League/Under Armour/GE; Simbex; and ElmindA. He has consulted for US Soccer (paid), US Cycling (unpaid), University of Calgary SHRed Concussions external advisory board (unpaid), medico-legal litigation, and received speaker honorarium and travel reimbursements for talks given. He is co-author of “Biomechanics of Injury (3rd edition)” and has a patent on “Brain Metabolism Monitoring Through CCO Measurements Using All-Fiber-Integrated Super-Continuum Source” (U.S. 11,529,091 B2). He is on the and is/was on the editorial boards (all unpaid) for Journal of Athletic Training (2015 to present), Concussion (2014 to present), Athletic Training & Sports Health Care (2008 to present), British Journal of Sports Medicine (2008 to 2019). Thomas McAllister has Concussion Research Grants from NIH; US Dept. of Defense; US Dept. of Energy; and the NCAA. He also has Royalties from American Psychiatric Assoc. Publishing for Textbook of TBI. He is part of the Concussion Scientific Advisory Committee; Australian Football League – uncompensated. Michael McCrea has Research funding to Medical College of Wisconsin from US Dept. of Defense (DoD) and NCAA; Research funding to Medical College of Wisconsin from NIH, VA, DoD, CDC, NFL, NCAA, Abbott Laboratories; Book royalties from Oxford University Press. He is Consultant, Neurotrauma Sciences, Inc.; Consultant, Green Bay Packers; Medical legal consulting. He receives Honoraria and travel support for professional speaking engagements and for professional meetings.
Figures
References
-
- Bakker A., Cai J., English L., Kaiser G., Mesa V., Van Dooren W. Beyond small, medium, or large: points of consideration when interpreting effect sizes. Educ. Stud. Math. 2019;102(1):1–8.
-
- Basser P.J., Mattiello J., LeBihan D. Estimation of the effective self-diffusion tensor from the NMR spin echo. J. Magn. Reson. B. 1994;103(3):247–254. - PubMed
-
- Benjamini Y., Hochberg Y. Controlling the false discovery rate: A practical and powerful approach to multiple testing. J. R. Stat. Soc. 1995;57(1):289–300.
Publication types
MeSH terms
Grants and funding
LinkOut - more resources
Full Text Sources
Medical
