. 2024 Aug 19;59(16):2171-2188.e7.
doi: 10.1016/j.devcel.2024.07.007. Epub 2024 Aug 5.

A single-cell transcriptomic map of the developing Atoh1 lineage identifies neural fate decisions and neuronal diversity in the hindbrain

Affiliations

A single-cell transcriptomic map of the developing Atoh1 lineage identifies neural fate decisions and neuronal diversity in the hindbrain

Jessica C Butts et al. Dev Cell. .

Abstract

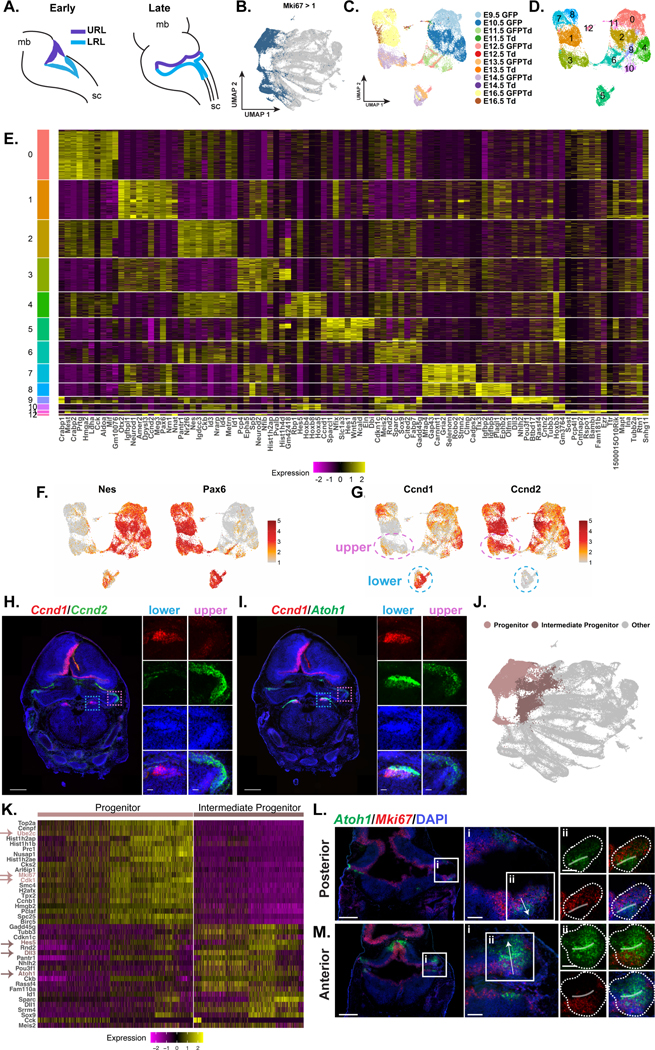
Proneural transcription factors establish molecular cascades to orchestrate neuronal diversity. One such transcription factor, Atonal homolog 1 (Atoh1), gives rise to cerebellar excitatory neurons and over 30 distinct nuclei in the brainstem critical for hearing, breathing, and balance. Although Atoh1 lineage neurons have been qualitatively described, the transcriptional programs that drive their fate decisions and the full extent of their diversity remain unknown. Here, we analyzed single-cell RNA sequencing and ATOH1 DNA binding in Atoh1 lineage neurons of the developing mouse hindbrain. This high-resolution dataset identified markers for specific brainstem nuclei and demonstrated that transcriptionally heterogeneous progenitors require ATOH1 for proper migration. Moreover, we identified a sizable population of proliferating unipolar brush cell progenitors in the mouse Atoh1 lineage, previously described in humans as the origin of one medulloblastoma subtype. Collectively, our data provide insights into the developing mouse hindbrain and markers for functional assessment of understudied neuronal populations.

Keywords: Atoh1; CUT&RUN; DNA binding; brainstem; cerebellum; hindbrain; neural fate decisions; single-cell RNA sequencing; spatial transcriptomics.


Conflict of interest statement

Declaration of interests R.S.D. is a paid consultant for AstraZeneca. H.Y.Z. is a member of the Board of Regeneron, co-founder of Cajal Neuroscience, and on the science advisory board of the Column group. This is work in the Zoghbi Lab and has not been licensed anywhere. The work in this paper has no connection to any of the consulting or companies named here.

Figures

Figure 1:
Figure 1:. Description of Atoh1-lineage development and scRNA-seq experimental design.
(A) Schematic depicting Atoh1-lineage migration streams and differentiating nuclei location and function. Abbreviations in Supplemental Table 1. (B) Schematic of genetic mouse alleles used to track real-time Atoh1 expression (Atoh1-GFP fusion allele) and constitutively track the Atoh1-lineage (Atoh1Cre/+ knock in; Rosa26lsl-TdTomato/+). (C) Light sheet microscopy image of E13.5 optically cleared embryo, αGFP for ATOH1 (green), TdTom (red), DAPI (blue), scale bar = 500 μm. (D) Schematic depicting scRNA-seq sample preparation from hindbrain tissue dissection. (E) UMAP of 24 samples representing 183,027 cells colored by sample. For each timepoint, at least 3 embryos from 2 distinct litters were used. (F) Expression of Atoh1 and TdTom (through expression of WPRE) visualized on the UMAP. (G) UMAP of full dataset with cells colored by cluster.
Figure 2:
Figure 2:. Annotation of Atoh1-lineage throughout development and differentiating Atoh1-lineage nuclei.
(A) UMAP visualization of expression of markers for progression through cell state. (B) UMAP visualization of expression of rostral-caudal identity markers – En1 and En2 (rostral), Hoxa2 and Hoxb5 (caudal). (C) UMAP of full dataset with cells colored by migration trajectory. (D) Dot plot displaying marker genes for each migration trajectory. (E) UMAP of cells with Mapt expression > 2.5 colored in blue. (F, G) UMAP of differentiating subset with cells colored by cluster (F) and sample (G). (H) UMAP annotating differentiating Atoh1-lineage neurons. Abbreviations in Supplemental Table 1. (I, K, M, O, Q) Expression of differentiating markers visualized on the UMAP. (J, L, N, P, R) In situ hybridization of coronal E14.5 mouse embryo, Tcf24, Kcnip2, Sox7, Arid5a, and Spx (green), TdTom (red), DAPI (blue), scale bar = 1 mm; inset identified by dotted square, scale bar = 100 μm.
Figure 3:
Figure 3:. Atoh1 progenitors are heterogenous in developmental time and space.
(A) Schematic depicting Atoh1 progenitors at the RL in early and late developmental stages. mb = midbrain, sc = spinal cord (B) UMAP of cells with Mki67 expression > 1 colored in blue (C, D) UMAP of cycling Atoh1 progenitor subset with cells colored by sample (C) and cluster (D). (E) Heatmap of top 10 marker genes for each cluster. Yellow denotes upregulation and purple denotes downregulation. (F) Expression of Nes and Pax6 visualized on the UMAP. (G) Expression of Ccnd1 and Ccnd2 visualized on the UMAP. URL cells from E13.5 and E14.5 circled with dotted pink outline. LRL cells from E13.5 and E14.5 circled with dotted blue outline. (H, I) ISH of coronal E14.5 RL, Ccnd2 (H) and Atoh1 (I, green), Ccnd1 (red), DAPI (blue), scale bar = 500 μm. Upper and lower RL inset identified by pink and blue dotted line, respectively, scale bar = 50 μm. (J) UMAP of full dataset with cells colored to denote the progenitors and intermediate progenitors. (K) Heatmap of top 20 genes upregulated in progenitors and intermediate progenitors. Yellow denotes upregulation and purple denotes downregulation. Arrows denote genes mentioned within the text. (L, M) ISH of posterior LRL (L) and anterior URL (M) coronal E12.5 embryos, Atoh1 (green), Mki67 (red), DAPI (blue), scale bar = 500 μm. i) Signifies zoomed in area. Arrow denoting direction of migrating cells, scale bar = 100 μm. ii) Signifies further zoomed in area. Dotted lines outline the Atoh1 expression area. Opaque line is drawn over peak Atoh1 expression. Scale bar = 100 μm.
Figure 4:
Figure 4:. Atoh1 is functionally critical during migration.
(A) UMAP of full dataset with cells colored by cell state. (B) Violin plots of genes demarcating cell state. (C) Odds ratio describing enrichment of upregulated DEGs that contain ATOH1 binding peaks across cell state. Bonferroni adjusted p-value for each cell state denoted on the graph. Error bars denote 95% confidence interval. For the CUT&RUN study, 28 embryos from 4 litters were combined and for E14.5, 24 embryos from 3 litters. (D) UMAP displaying the module score of the average expression change of genes with ATOH1 binding peaks. (E) Ridge plot of the Module Score by cell state. * denotes Bonferroni adjusted p-value < 3.8×10−79. (F, G) ISH of RL of Atoh1Cre/+; Rosalsl-TdTom/+ and Atoh1Cre/FlpO; Rosalsl-TdTom/+ coronal E12.5 embryos, Sox2 (green), Cre (F) and TdTomato (G) (red), and DAPI (blue), scale bar = 500 μm; inset identified by dotted square, scale bar = 100 μm. (H) Percent of Cre+ area that is Sox2+. Statistic was performed for 3 sections per group from 3 independent litters by a linear mixed model (ꭓ2(1) = 0.652, p=0.42). The same color dot denotes embryos from the same litter. Cross bar denotes the median.
Figure 5:
Figure 5:. Atoh1-lineage migration streams have both a shared and unique transcriptional signature.
(A) Cartoon of Atoh1-lineage migration streams. (B) UMAP of full dataset with cells colored by migration stream. (C) Line plot denoting the number of cells from each sample for each migration stream. (D) UMAP of migration streams colored by pseudotime reordering. Gray denotes early pseudotime, purple denotes later pseudotime. (E-G) Line plot depicting expression of cell state genes (E), shared genes (F), and unique genes (G) plotted as a function of pseudotime for each migration stream. (H) Example of ATOH1 binding peaks on genes shared between migration streams.
Figure 6:
Figure 6:. A caudal pons migration stream gives rise to nuclei involved in proprioception, hearing, and balance.
(A) UMAP depicting the caudal pons migration stream in the full dataset labeled in blue. (B, C) UMAP of caudal pons lineage with cell colored by cluster (B) and sample (C). (D) Expression of genes that change with neuronal maturation visualized on the UMAP. (E-I) Expression of marker genes of differentiating populations. (J, K) ISH of Atoh1Cre/GFP; Rosalsl-TdTom/+ coronal E14.5 embryos, Mafb (J), and Sncg (K) (green), TdTom (red), DAPI (blue), scale bar = 1 mm. Inset identified by dotted line, scale bar = 100 μm. (L, M) UMAP with cells colored by differentiating identity (L) and lineage (M). (N-Q) Gene expression visualized on the UMAP of progenitor genes (N), Lineage 1 genes (O), Lineage 2 genes (P), and Lineage 3 genes (Q). (R) Cartoon depicting the caudal pons migration stream and the lineages that result in distinct differentiating cell types. Genes in black text denote shared expression. Genes in colored text denote lineage-specific genes.
Figure 7:
Figure 7:. Atoh1-derived proliferative UCB progenitors are abundant in the mouse RL.
(A) Gene expression of proliferating UBC progenitor markers visualized on the cycling progenitor subset UMAP. (B) Immunofluorescence image of Atoh1Cre/+; Rosalsl-TdTom/+ coronal E16.5 embryos stained for Eomes (Tbr2, green), Ki67 (white), RFP (TdTom read out, red), and DAPI (blue). RL region outlined in light blue, scale bar = 250 μm. (i) Inset of the RL region, scale bar = 75 μm. (iia, iib) Insets of the differentiating (iia) and proliferating (iib) populations. Light blue outline depicts the Eomes+ area, scale bar = 25 μm. (C) UMAP of cerebellar subset with cells colored by cluster. (D) Expression of progenitor markers, shared URL genes, UBCs, and granule progenitors visualized on the UMAP. (E, F) UMAP of Eomes-expressing cells with cells colored by cluster (E) and pseudotime reordering (F). (G) Line plot depicting expression level as a function of pseudotime of Eomes-expressing cells. (H) Expression of markers for proliferating UBC progenitors visualized on the UMAP. * indicate genes with ATOH1 binding determined by CUT&RUN. (I) Odds ratio describing enrichment of upregulated differentially expressed genes in medulloblastoma (MB) subtypes among differentially expressed genes in mouse URL lineages. Bonferroni adjusted p-value for each cell state denoted on the graph. Error bars denote 95% confidence interval.

References

    1. Ben-Arie N, Bellen HJ, Armstrong DL, McCall AE, Gordadze PR, Guo Q, Matzuk MM, and Zoghbi HY (1997). Math1 is essential for genesis of cerebellar granule neurons. Nature 390, 169–172. 10.1038/36579. - DOI - PubMed
    1. Wang VY, Rose MF, and Zoghbi HY (2005). Math1 Expression Redefines the Rhombic Lip Derivatives and Reveals Novel Lineages within the Brainstem and Cerebellum. Neuron 48, 31–43. 10.1016/j.neuron.2005.08.024. - DOI - PubMed
    1. Rose MF, Ahmad KA, Thaller C, and Zoghbi HY (2009). Excitatory neurons of the proprioceptive, interoceptive, and arousal hindbrain networks share a developmental requirement for Math1. Proceedings of the National Academy of Sciences 106, 22462–22467. 10.1073/pnas.0911579106. - DOI - PMC - PubMed
    1. Ben-Arie N, Hassan BA, Bermingham NA, Malicki DM, Armstrong D, Matzuk M, Bellen HJ, and Zoghbi HY (2000). Functional conservation of atonal and Math1 in the CNS and PNS. Development 127, 1039–1048. 10.1242/dev.127.5.1039. - DOI - PubMed
    1. Bermingham NA, Hassan BA, Wang VY, Fernandez M, Banfi S, Bellen HJ, Fritzsch B, and Zoghbi HY (2001). Proprioceptor pathway development is dependent on MATH1. Neuron 30, 411–422. 10.1016/S0896-6273(01)00305-1. - DOI - PubMed

Publication types

MeSH terms

Substances