Randomized Controlled Trial
. 2024 Aug 20;5(8):101667.
doi: 10.1016/j.xcrm.2024.101667. Epub 2024 Aug 5.

Ketogenic diet but not free-sugar restriction alters glucose tolerance, lipid metabolism, peripheral tissue phenotype, and gut microbiome: RCT

Affiliations
Randomized Controlled Trial

Ketogenic diet but not free-sugar restriction alters glucose tolerance, lipid metabolism, peripheral tissue phenotype, and gut microbiome: RCT

Aaron Hengist et al. Cell Rep Med. .

Abstract

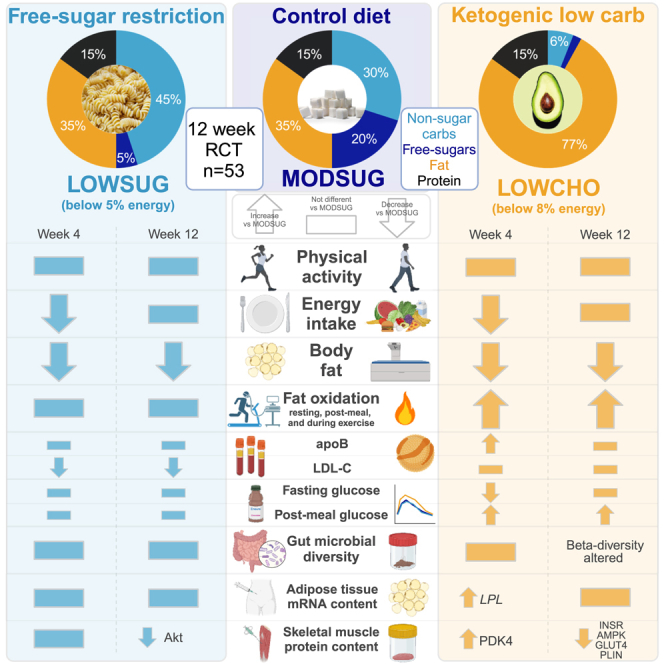
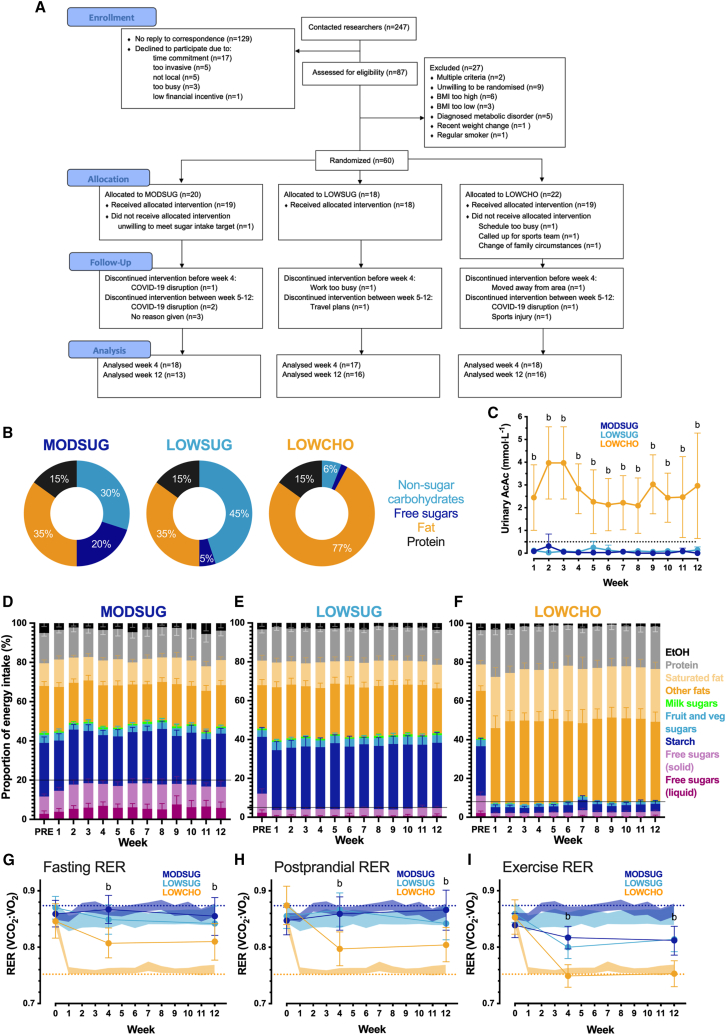
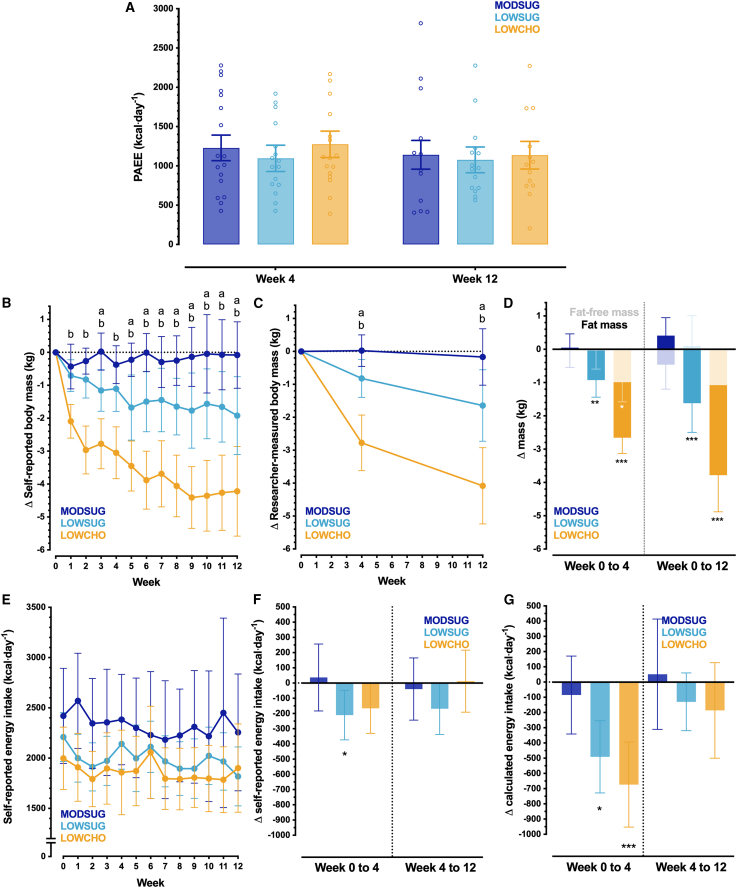
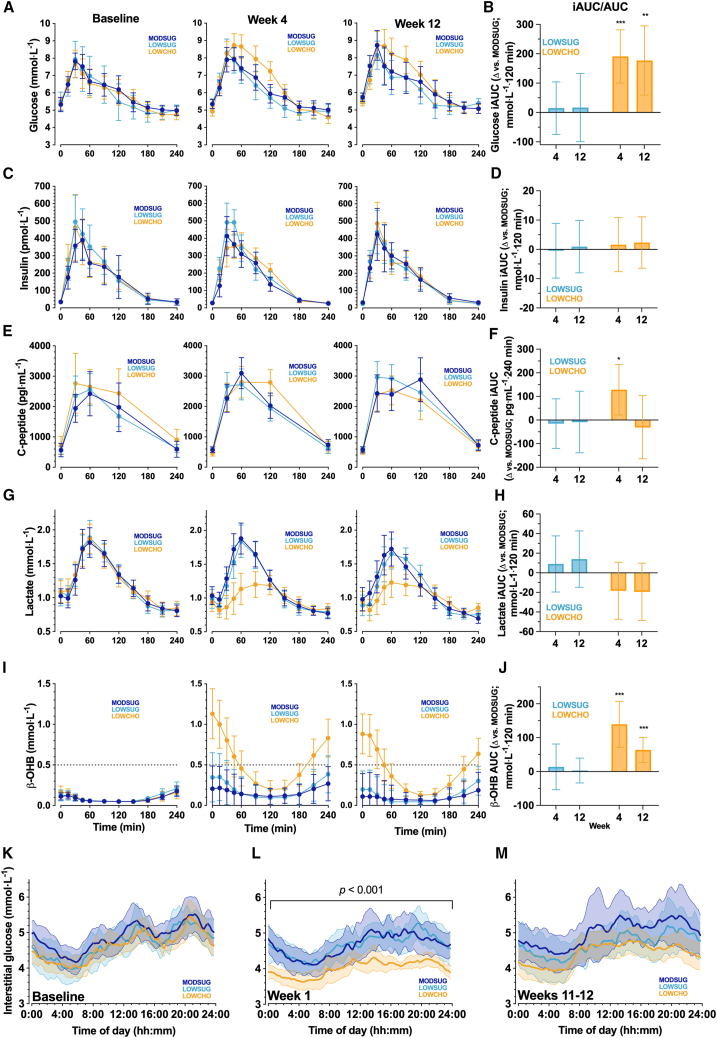
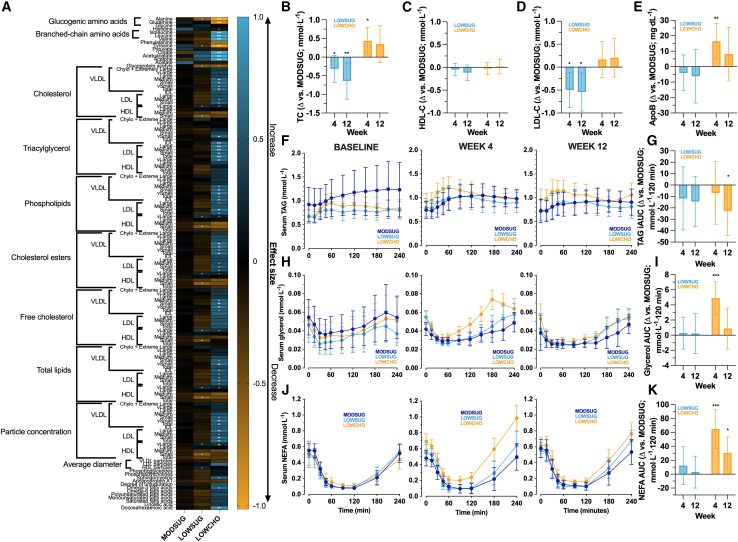
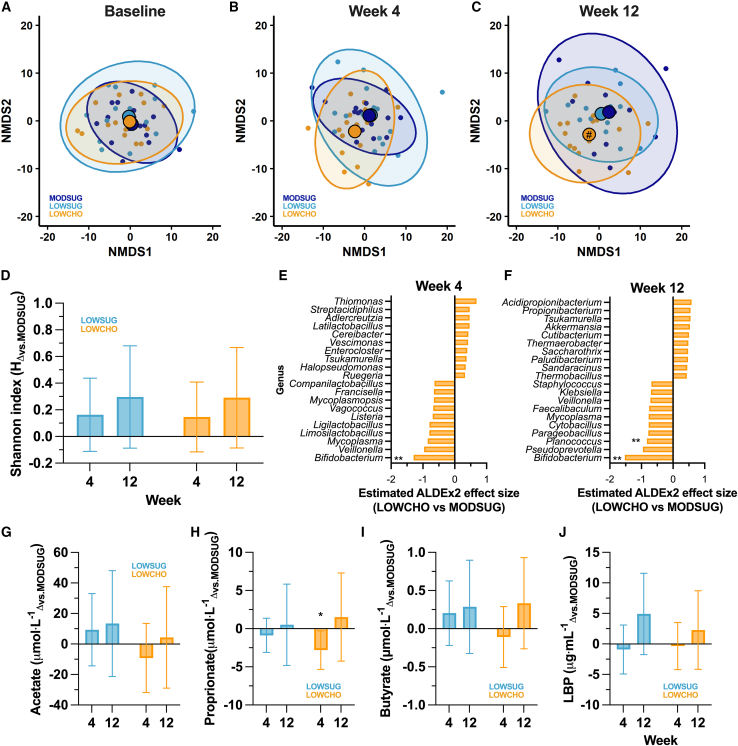
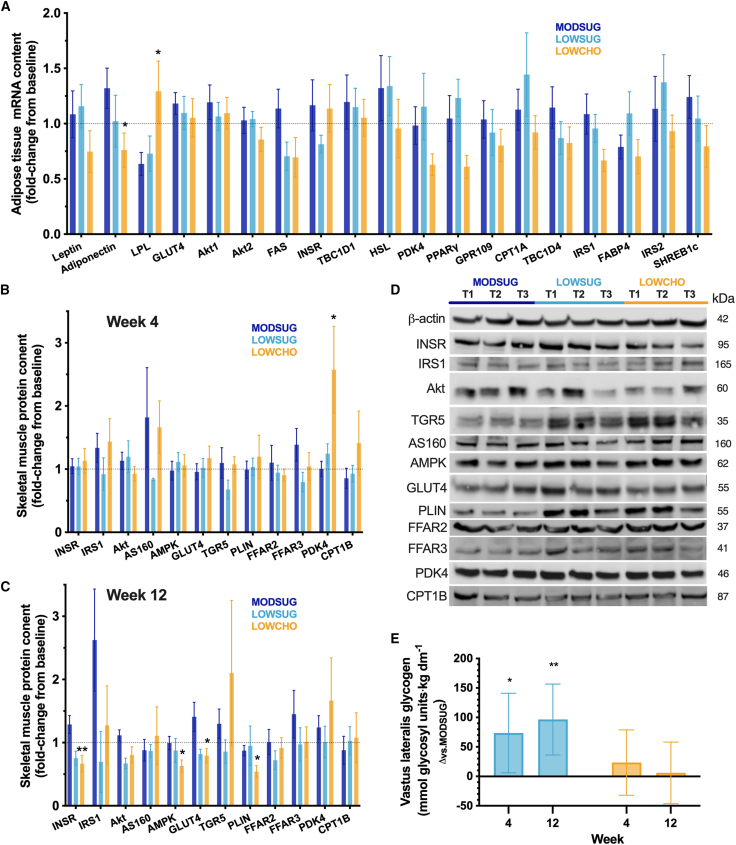
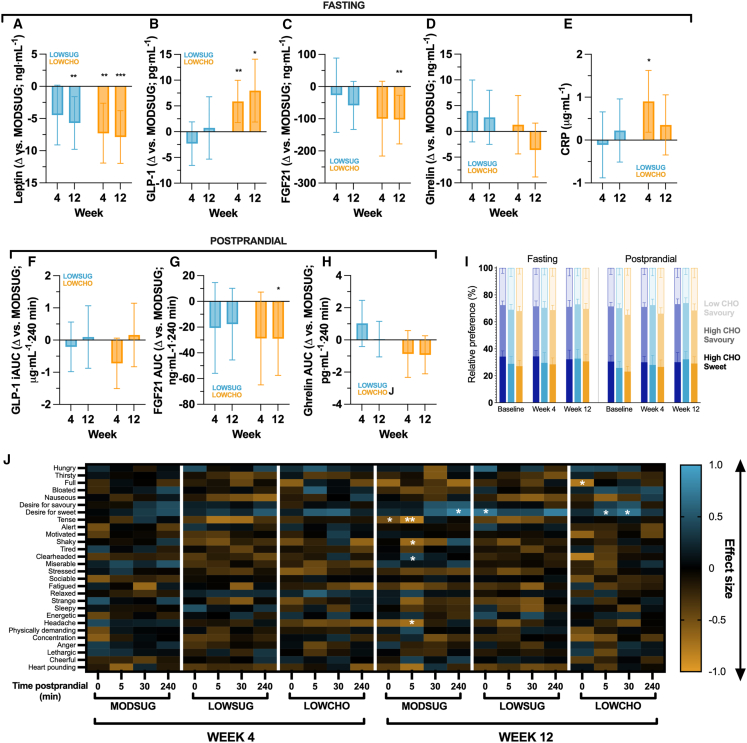
Restricted sugar and ketogenic diets can alter energy balance/metabolism, but decreased energy intake may be compensated by reduced expenditure. In healthy adults, randomization to restricting free sugars or overall carbohydrates (ketogenic diet) for 12 weeks reduces fat mass without changing energy expenditure versus control. Free-sugar restriction minimally affects metabolism or gut microbiome but decreases low-density lipoprotein cholesterol (LDL-C). In contrast, a ketogenic diet decreases glucose tolerance, increases skeletal muscle PDK4, and reduces AMPK and GLUT4 levels. By week 4, the ketogenic diet reduces fasting glucose and increases apolipoprotein B, C-reactive protein, and postprandial glycerol concentrations. However, despite sustained ketosis, these effects are no longer apparent by week 12, when gut microbial beta diversity is altered, possibly reflective of longer-term adjustments to the ketogenic diet and/or energy balance. These data demonstrate that restricting free sugars or overall carbohydrates reduces energy intake without altering physical activity, but with divergent effects on glucose tolerance, lipoprotein profiles, and gut microbiome.

Keywords: body fat; diet; energy balance; energy intake; ketogenic; lipoprotein; low carbohydrate; metabolism; physical activity; sugar.


Conflict of interest statement

Declaration of interests P.D.C. is a co-founder and CTO of SeqBiome Ltd. J.T.G. has received research funding from BBSRC, MRC, Cancer Research UK, the British Heart Foundation, Clasado Biosciences, Lucozade Ribena Suntory, Arla Foods Ingredients, the Cosun Nutrition Center, and the Fruit Juice Science Center; is a scientific advisory board member to ZOE; and has completed paid consultancy for 6d Sports Nutrition, The Dairy Council, PepsiCo, Violicom Medical, Tour Racing Ltd., and SVGC. J.A.B. is an investigator on research grants funded by BBSRC, MRC, the British Heart Foundation, Rare Disease Foundation, EU Hydration Institute, GlaxoSmithKline, Nestlé, Lucozade Ribena Suntory, Arla Foods, Cosun Nutrition Center, American Academy of Sleep Medicine Foundation, and Salus Optima (L3M Technologies Ltd.); has completed paid consultancy for PepsiCo, Kellogg’s, SVGC, and Salus Optima (L3M Technologies Ltd.); is Company Director of Metabolic Solutions Ltd.; receives an annual honorarium as a member of the academic advisory board for the International Olympic Committee Diploma in Sports Nutrition; and receives an annual stipend as Editor-in-Chief of International Journal of Sport Nutrition & Exercise Metabolism.

Figures

None
Graphical abstract
Figure 1
Figure 1
CONSORT diagram, macronutrient targets, and biomarkers of adherence to moderate sugar, free-sugar-restricted, and ketogenic carbohydrate-restricted diets (A–I) CONSORT diagram of flow through study from enrollment to allocation and analysis of participants randomized (A). Prescribed dietary macronutrient targets (%total energy) for intervention arms (B). Weekly morning fasted urinary acetoacetate (AcAc) concentrations (C; n = 33–55). Self-reported proportional nutrient composition of the moderate sugar (MODSUG) group with horizontal line marking 20% as the target intake for free sugars (D; n = 10–18), the free-sugar-restricted (LOWSUG) group with horizontal line marking 5% as the target for maximal intake of free sugars (E; n = 15–17), and the ketogenic carbohydrate-restricted (LOWCHO) group with the horizontal line marking 8% as the target for maximal intake of overall carbohydrates (F; n = 16–18). Respiratory exchange ratio (RER; filled dots), prescribed food quotients (dotted lines) and self-reported food quotients (shaded area = 95% CI) fasting (G; n = 45–53), postprandial (H; n = 42–48), and during treadmill walking test following a 4–5 h fast (I; n = 45–53). Data for B–F are unadjusted mean (95% CI). Data for G–I are mean (95% CI) at baseline, and ANCOVA-adjusted mean (95% CI) during the interventions (with baseline as the covariate). ap ≤ 0.05 for LOWSUG vs. MODSUG; bp ≤ 0.05 for LOWCHO vs. MODSUG.
Figure 2
Figure 2
Physical activity, changes in body mass and composition, and energy intake from self-report and objectively calculated methods across 12 weeks of MODSUG, LOWSUG, or LOWCHO diets (A–G) Baseline-adjusted (ANCOVA) mean (95% CI) and individual 24-h physical activity energy expenditure (PAEE) at week 4 and week 12 (A). Self-reported change in body mass across 12 weeks (B), researcher-measured change in body mass across 12 weeks (C), and DXA-derived changes in fat mass (FM; solid bars) and fat free mass (FFM; shadowed bars, data stacked) at 4 weeks and 12 weeks (week 4 n = 53; week 12 n = 45; D). Self-reported energy intake (EI) across 12 weeks (E), change in self-reported EI across 4 weeks and 12 weeks (F), and change in objectively calculated EI across 4 weeks and 12 weeks using the intake-balance method (week 4 n = 52; week 12 n = 43; G). Data were all analyzed as ANCOVA-adjusted mean (95% CI) at week 4 and week 12 (with baseline scores as the covariate), apart from F and G which are unadjusted mean (95% CI) since values require calculation as the change from baseline. (a) p ≤ 0.05 for a difference between LOWSUG vs. MODSUG at the time point where this letter appears; (b) p ≤ 0.05 for a difference between LOWCHO vs. MODSUG at the time point where this letter appears; ∗p ≤ 0.05 vs. MODSUG; ∗∗p ≤ 0.01 vs. MODSUG; ∗∗∗p ≤ 0.001 vs. MODSUG.
Figure 3
Figure 3
Glucose, insulin, C-peptide, lactate, and beta-hydroxybutyrate responses to mixed meal tolerance tests (mean [range] 502 [331 to 715 kcal]; 54% carbohydrate [23% of which are sugars], 31% fat, 15% protein), and continuous interstitial glucose concentrations at baseline and across 12 weeks of MODSUG, LOWSUG, or LOWCHO diets (A–M) Unadjusted postprandial concentrations of serum glucose (A), insulin (C) C-peptide (E), lactate (G), and β-hydroxybutyrate (I; βOHB), and ANCOVA-adjusted mean (95% CI, baseline as the covariate) incremental/total area under the curve (tAUC) expressed as differences vs. MODSUG (B, D, F, H, and J, respectively; week 4 n = 48; week 12 n = 42). Twenty-four-hour interstitial glucose concentrations at baseline (K), week 1 (L), and weeks 11–12 (M); data are means (95% CIs) for (K), and ANCOVA-adjusted means (95% CIs) for (L) and (M); week 1 n = 38; weeks 11–12 n = 32. ∗p ≤ 0.05 vs. MODSUG; ∗∗p ≤ 0.01 vs. MODSUG; ∗∗∗p ≤ 0.001 vs. MODSUG.
Figure 4
Figure 4
Targeted nuclear magnetic resonance spectroscopy of fasting plasma lipoprotein and metabolite profiles, fasting serum cholesterol and apolipoprotein B concentrations, and triacylglycerol, glycerol, and non-esterified fatty acid responses to mixed meal tolerance tests (mean [range] 502 [331 to 715 kcal]; 54% carbohydrate [23% of which are sugars], 31% fat, 15% protein) after 4 or 12 weeks of MODSUG, LOWSUG, or LOWCHO diets (A–J) Change in nuclear magnetic resonance (NMR)-derived fasting plasma lipoprotein and metabolite profile from baseline to week 4 (A), expressed as effect size (n = 49). ∗p ≤ 0.05, ∗∗p ≤ 0.01, ∗∗∗p ≤ 0.001 week 4 vs. baseline (e.g., blue with an asterisk represents a significant increase from baseline and yellow indicates a decrease from baseline); ANCOVA-adjusted mean (95% CI, baseline as the covariate) differences vs. MODSUG in fasting serum total cholesterol (B; TC) high-density lipoprotein cholesterol (C; HDL-C); low-density lipoprotein cholesterol (D; LDL-C), and apolipoprotein B (E; apoB) concentrations; unadjusted postprandial concentrations of serum triacylglycerol (F; TAG), glycerol (H), and non-esterified fatty acid (J; NEFA) and ANCOVA-adjusted mean (95% CI, baseline as the co-variate) incremental/tAUC differences vs. MODSUG (G, I, and K, respectively; week 4 n = 48; week 12 n = 42). ∗p ≤ 0.05 vs. MODSUG; ∗∗p ≤ 0.01 vs. MODSUG; ∗∗∗p ≤ 0.001 vs. MODSUG in B–J.
Figure 5
Figure 5
Beta diversity, alpha diversity, and major genus-level changes in gut microbiome composition, and concentrations of plasma short-chain fatty acids and lipopolysaccharide-binding protein across 12 weeks of MODSUG, LOWSUG, or LOWCHO diets (A–J) Nonmetric multidimensional scaling (NMDS) plots from robust Aitchison distances of all species at baseline, week 4, and week 12 (A, B, and C). Large points indicate centroids. Centroid containing # indicates LOWCHO vs. MODSUG q = 0.10. Alpha diversity as expressed as the Shannon index with ANOVA-adjusted means ± 95% CI (D, baseline as the covariate). Estimated effect size of change in center log ratio abundance of the top 20 gut microbiome genera with the largest differences between LOWSUG and MODSUG at week 4 (E) and week 12 (F), and between LOWCHO and MODSUG at week 4 (G) and week 12 (H), ∗q < 0.1; ∗∗q < 0.05. Plasma concentrations of acetate (G), propionate (H), butyrate (I), and lipopolysaccharide-binding protein (LBP; J). Data are means (95% CIs) at baseline, and ANCOVA-adjusted means (95% CIs) during the interventions (with baseline scores as the covariate). Week 4 n = 48, week 12 n = 41 for microbiome outcomes. Week 4 n = 26–50, week 12 n = 18–43 for circulating factors. ∗p ≤ 0.05 vs. MODSUG; ∗∗p ≤ 0.01 vs. MODSUG; ∗∗∗p ≤ 0.001.
Figure 6
Figure 6
Adipose tissue mRNA content and skeletal muscle protein and glycogen content across 4 and 12 weeks of MODSUG, LOWSUG, or LOWCHO diets (A–D) Fold changes in levels of mRNA in adipose tissue at week 4 (n = 38; A) and key proteins in skeletal muscle at week 4 (n = 27; B) and week 12 (n = 19; C), with representative blots (D). Data for (A)–(C) are mean (SEM). (E) ANCOVA-adjusted mean (95% CI) difference vs. MODSUG in skeletal muscle glycogen concentrations (week 4 n = 29; week 12 n = 21). ∗p ≤ 0.05 vs. MODSUG; ∗∗p ≤ 0.01 vs. MODSUG; ∗∗∗p ≤ 0.001 vs. MODSUG.
Figure 7
Figure 7
Fasting and postprandial endocrine and subjective behavioral responses across 4 and 12 weeks of MODSUG, LOWSUG, or LOWCHO diets (A–J) Fasting leptin (A), glucagon-like peptide 1 (GLP-1; B), fibroblast growth factor 21 (FGF21; C), ghrelin (D), and C-reactive protein (CRP; E). Postprandial GLP-1 iAUC (F), FGF21 tAUC (G), and ghrelin tAUC (H) differences vs. MODSUG. Relative preference for high-carbohydrate sweet foods, high-carbohydrate savory foods, and low-carbohydrate savory foods (I). Visual analog scales. Data in A–H are ANCOVA-adjusted mean (95% CI) differences vs. MODSUG. Data in I are mean (95% CI) at baseline, and ANCOVA-adjusted mean (95% CI) for week 4 and 12 (with baseline scores as the covariate). Data in J are mean effect size of change between baseline and week 4 or week 12 (∗p < 0.05 vs. baseline). ∗p ≤ 0.05 vs. MODSUG; ∗∗p ≤ 0.01 vs. MODSUG; ∗∗∗p ≤ 0.001 for A–H. Week 4 n = 41–50; week 12 n = 36–43.

References

    1. Scientific Advisory Committee on Nutrition . Public Health England; 2015. Carbohydrates and health report.
    1. Swan G.E., Powell N.A., Knowles B.L., Bush M.T., Levy L.B. A definition of free sugars for the UK. Publ. Health Nutr. 2018;21:1636–1638. doi: 10.1017/S136898001800085X. - DOI - PMC - PubMed
    1. World Health Organization Guideline: sugars intake for adults and children. 2015. https://www.who.int/publications/i/item/9789241549028 - PubMed
    1. Scientific Advisory Committee on Nutrition Why 5%? An explanation of SACN’s recommendations about sugars and health. 2015. https://www.gov.uk/government/publications/sacns-sugars-and-health-recom...
    1. Te Morenga L., Mallard S., Mann J. Dietary sugars and body weight: systematic review and meta-analyses of randomised controlled trials and cohort studies. BMJ Br. Med. J. (Clin. Res. Ed.) 2013;346 doi: 10.1136/bmj.e7492. - DOI - PubMed

Publication types