. 2024 Aug 6;15(1):6524.
doi: 10.1038/s41467-024-50159-6.

Diagnostic utility of DNA methylation analysis in genetically unsolved pediatric epilepsies and CHD2 episignature refinement

Christy W LaFlamme #  1   2 Cassandra Rastin #  3   4 Soham Sengupta  1 Helen E Pennington  1   5 Sophie J Russ-Hall  6 Amy L Schneider  6 Emily S Bonkowski  1 Edith P Almanza Fuerte  1 Talia J Allan  6 Miranda Perez-Galey Zalusky  7 Joy Goffena  7 Sophia B Gibson  7   8 Denis M Nyaga  9 Nico Lieffering  9 Malavika Hebbar  7 Emily V Walker  10 Daniel Darnell  10 Scott R Olsen  10 Pandurang Kolekar  11 Mohamed Nadhir Djekidel  12 Wojciech Rosikiewicz  12 Haley McConkey  4 Jennifer Kerkhof  4 Michael A Levy  4 Raissa Relator  4 Dorit Lev  13 Tally Lerman-Sagie  14   15 Kristen L Park  16 Marielle Alders  17 Gerarda Cappuccio  18   19 Nicolas Chatron  20   21 Leigh Demain  22 David Genevieve  23 Gaetan Lesca  20   21 Tony Roscioli  24   25   26 Damien Sanlaville  20   21 Matthew L Tedder  27 Sachin Gupta  28 Elizabeth A Jones  22   29 Monika Weisz-Hubshman  30   31 Shamika Ketkar  30 Hongzheng Dai  30 Kim C Worley  30 Jill A Rosenfeld  30 Hsiao-Tuan Chao  30   32   33   34   35   36 Undiagnosed Diseases NetworkGeoffrey Neale  10 Gemma L Carvill  37 University of Washington Center for Rare Disease ResearchZhaoming Wang  11   38 Samuel F Berkovic  6 Lynette G Sadleir  9 Danny E Miller  7   39   40 Ingrid E Scheffer  6   41   42 Bekim Sadikovic  43   44 Heather C Mefford  45
Affiliations

Diagnostic utility of DNA methylation analysis in genetically unsolved pediatric epilepsies and CHD2 episignature refinement

Christy W LaFlamme et al. Nat Commun. .

Abstract

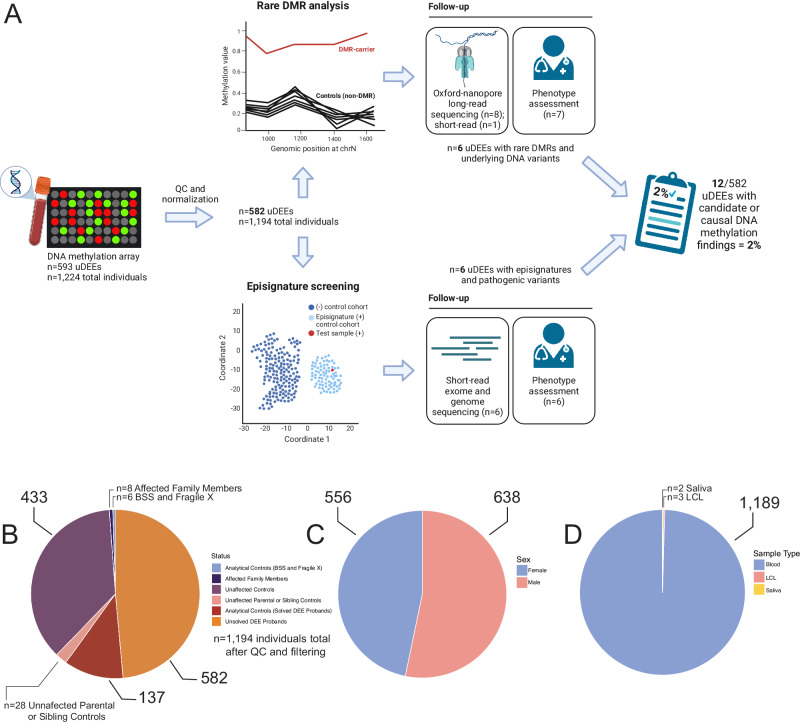
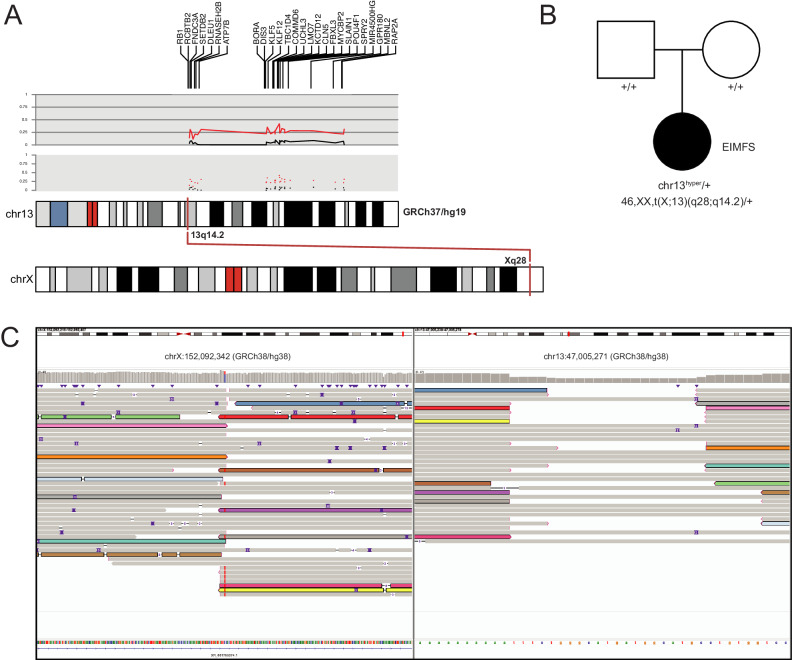
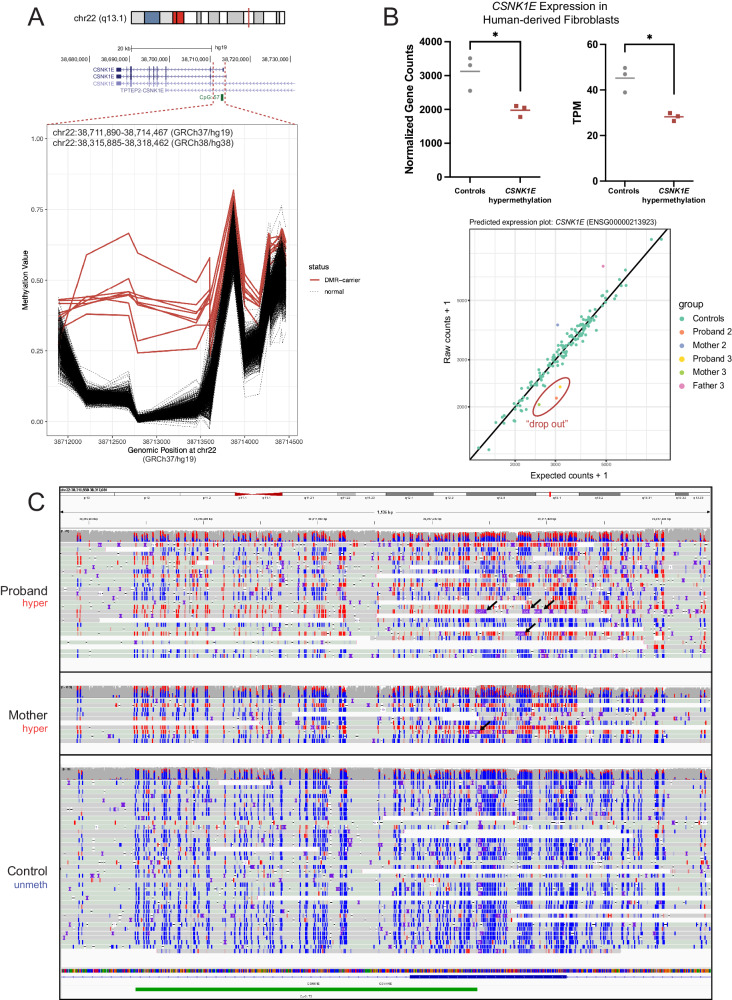
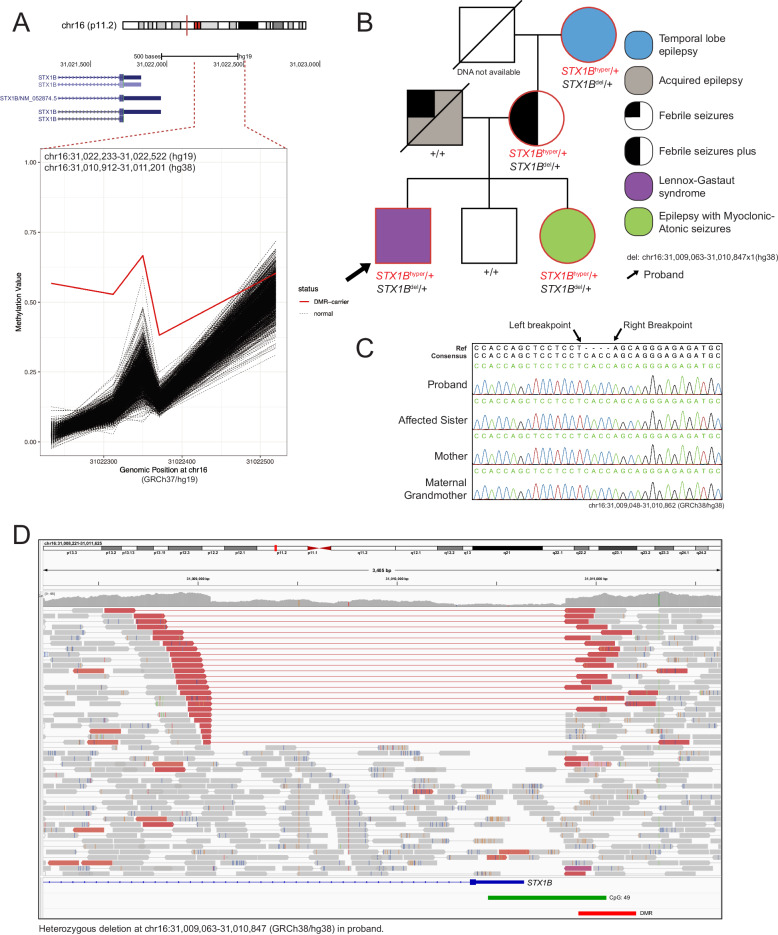
Sequence-based genetic testing identifies causative variants in ~ 50% of individuals with developmental and epileptic encephalopathies (DEEs). Aberrant changes in DNA methylation are implicated in various neurodevelopmental disorders but remain unstudied in DEEs. We interrogate the diagnostic utility of genome-wide DNA methylation array analysis on peripheral blood samples from 582 individuals with genetically unsolved DEEs. We identify rare differentially methylated regions (DMRs) and explanatory episignatures to uncover causative and candidate genetic etiologies in 12 individuals. Using long-read sequencing, we identify DNA variants underlying rare DMRs, including one balanced translocation, three CG-rich repeat expansions, and four copy number variants. We also identify pathogenic variants associated with episignatures. Finally, we refine the CHD2 episignature using an 850 K methylation array and bisulfite sequencing to investigate potential insights into CHD2 pathophysiology. Our study demonstrates the diagnostic yield of genome-wide DNA methylation analysis to identify causal and candidate variants as 2% (12/582) for unsolved DEE cases.


Conflict of interest statement

B.S. is a shareholder in EpiSign Inc, a company involved in commercialization of EpiSignTM software. D.E.M. is on a scientific advisory board at ONT and has received travel support from ONT to speak on their behalf. D.E.M. is engaged in a research agreement with ONT. D.E.M. holds stock options in MyOme. I.E.S. has served on scientific advisory boards for BioMarin, Chiesi, Eisai, Encoded Therapeutics, GlaxoSmithKline, Knopp Biosciences, Nutricia, Rogcon, Takeda Pharmaceuticals, UCB, Xenon Pharmaceuticals, Cerecin; has received speaker honoraria from GlaxoSmithKline, UCB, BioMarin, Biocodex, Chiesi, Liva Nova, Nutricia, Zuellig Pharma, Stoke Therapeutics and Eisai; has received funding for travel from UCB, Biocodex, GlaxoSmithKline, Biomarin, Encoded Therapeutics Stoke Therapeutics and Eisai; has served as an investigator for Anavex Life Sciences, Cerevel Therapeutics, Eisai, Encoded Therapeutics, EpiMinder Inc, Epygenyx, ES-Therapeutics, GW Pharma, Marinus, Neurocrine BioSciences, Ovid Therapeutics, Takeda Pharmaceuticals, UCB, Ultragenyx, Xenon Pharmaceuticals, Zogenix and Zynerba; has consulted for Care Beyond Diagnosis, Epilepsy Consortium, Atheneum Partners, Ovid Therapeutics, UCB, Zynerba Pharmaceuticals, BioMarin, Encoded Therapeutics and Biohaven Pharmaceuticals; and is a Non-Executive Director of Bellberry Ltd and a Director of the Australian Academy of Health and Medical Sciences and the Australian Council of Learned Academies Limited. I.E.S. may accrue future revenue on pending patent WO61/010176 (filed: 2008): Therapeutic Compound; has a patent for SCN1A testing held by Bionomics Inc and licensed to various diagnostic companies; has a patent molecular diagnostic/theragnostic target for benign familial infantile epilepsy (BFIE) [PRRT2] 2011904493 & 2012900190 and PCT/AU2012/001321 (TECH ID:2012-009). L.G.S. receives funding from the Health Research Council of New Zealand and Cure Kids New Zealand, is a consultant for the Epilepsy Consortium, and has received travel grants from Seqirus and Nutricia. L.G.S. has received research grants and consultancy fees from Zynerba Pharmaceuticals and has served on Takeda and Eisai Pharmaceuticals scientific advisory panels. The Department of Molecular and Human Genetics at Baylor College of Medicine receives revenue from clinical genetic testing conducted at Baylor Genetics Laboratories. The remaining authors declare no competing interests.

Figures

Fig. 1
Fig. 1. Description of the DNA methylation analysis and features of the study cohort.
A Flowchart displaying filtering of samples after quality control (QC) and normalization, analysis pipeline for detecting rare DMRs and episignatures, and narrowing down DNA methylation candidates for this study. B Breakdown of the cohort after QC and normalization (n = 1194) containing individuals with genetically unsolved DEEs (uDEEs, n = 582), unaffected controls (n = 461), analytical controls (n = 143), and affected family members (n = 8). C Number of males (n = 638) versus females (n = 556). D Sample type as blood (n = 1189) versus other tissue types (n = 5). Figure 1A was created with BioRender.com and released under a Creative Commons Attribution-Non-Commercial-Noderivs 4.0 International License (CC-BY-NC-ND).
Fig. 2
Fig. 2. Rare outlier DMR analysis identifies chromosomal hypermethylation caused by X;13 translocation.
A Graphical representation of chr13 rare hypermethylation events in a proband with uDEE. The upper portion of the track displays the genes on chr13 for which hypermethylation events were called. The two grey panels (upper=line, lower=dot) depict β-values for the average of the proband’s array replicates (red) and the average of the parents’ array data (black) for a representative probe within each DMR (n = 26). Subtle hypermethylation hovering around ~ 25% can be seen for the proband compared to the parents. The lower track shows chromosomal locations of the X;13 translocation. B Pedigree showing that chr13 hypermethylation events and the X;13 translocation occurred de novo. C IGV view of ONT LRS data for chrX (left) and chr13 (right). Some, but not all, reads spanning the translocation are colored to show that they span the breakpoint. Karyotype plots, as shown in Fig. 2A and others throughout the manuscript, were created using the R package karyoploteR.
Fig. 3
Fig. 3. Rare outlier DMR analysis identifies tandem repeat expansions.
A DMR plot depicting outlier hypermethylation of the CSNK1E 5’UTR and intron 1 in two probands with uDEEs (three additional replicate samples across both for a total of five samples), one mother, and two unaffected controls (total n = 8 red lines) detected through epivariation analysis. B The upper panel shows expression values from RNA-seq of human-derived fibroblasts for individuals with CSNK1E hypermethylation (n = 3 biological replicates) compared to individuals with control methylation levels (n = 3 biological replicates). Significance between groups was determined by a two-tailed paired t-test (p = 0.029 for gene counts and p = 0.0169 for transcripts per million or TPM). *P < 0.05. A representative predicted expression plot from drop-out analysis using the OUTRIDER algorithm is shown at the lower portion of the panel. See Supplementary Fig. 9 for the individual OUTRIDER plots for each family and significance information. C Unphased IGV view of LRS data showing CpG sites that are methylated (red) and unmethylated (blue). The CGG repeat expansion seen in the proband was inherited from the mother (Family 1) and is shown as purple squares denoting insertions in the reads (black arrows); not all reads that are methylated show the insertion as they terminated within the inserted sequence and are clipped by the alignment process.
Fig. 4
Fig. 4. Rare outlier DMR analysis identifies copy number deletion in a family with GEFs + .
A DMR plot depicting outlier hypermethylation of the STX1B promoter and TSS in a proband with uDEE detected through epivariation analysis. B Pedigree for the immediate family members indicating that the inheritance of the hypermethylation (red) and copy number deletion (detected through genome sequencing of the proband shown in Fig. 3D) resides on the maternal side. The arrow points to the proband. C Sanger sequencing validation of the copy number deletion breakpoints in the proband, affected sister, mother, and maternal grandmother. Inserted “CACC” sequence is present between the mapped breakpoints. The father and unaffected brother had no PCR product at the same reaction conditions, indicating they did not harbor the deletion. Primer pairs with one partner located within the deletion on each side of the breakpoint were used to amplify the wild-type allele as a control (Supplementary Fig. 13). D IGV view of genome sequencing data showing a 1784 bp heterozygous deletion encompassing part of intron 1, exon 1, the TSS, and the promoter of STX1B. The reads are colored by insertion size and pair orientation and viewed as pairs. The red pairs, which span the breakpoints of the deletion, indicate that the insertion size is greater than expected. The “CACC” insertion sequence is present in the soft clipped bases (not shown).
Fig. 5
Fig. 5. Summary methylation variant pathogenicity (MVP) score for all individuals positive for EpisignTM v4 episignature analysis.
A Methylation Variant Pathogenicity (MVP) score (between 0 and 1) was generated to represent the confidence of prediction for the specific episignature on the EpiSignTM v4 clinical classifier that the SVM was trained to detect. Each colored circle represents a different individual and its associated MVP score for each of the episignatures on the EpiSignTM v4 clinical classifier. Final classification for a specific EpiSignTM disorder includes a combination of MVP score, hierarchical clustering, and multidimensional scaling (MDS) review.
Fig. 6
Fig. 6. Insights from the CHD2 episignature.
A Multidimensional scaling (MDS) plot showing clustering of individuals with pathogenic CHD2 variants (red, upper) for the previously described CHD2 450 K (n = 9) episignature with shared 450 K and 850 K array probes clusters away from the controls (n = 54, blue). The refined CHD2 850 K (n = 29) episignature (red, lower) clusters away from unaffected controls (n = 58, blue). B Circos plot representing shared probes between episignatures. Differentially methylated probes (DMPs) shared between the CHD2 850 K cohort (bold red), CHD2 450 K cohort (red), and 55 other episignatures on EpiSign with functional correlation analysis previously published. The thickness of the connecting lines corresponds to the number of probes shared between the cohorts. C Tree and leaf visualization of Euclidean clustering of episignatures. Tree and leaf visualization for all 57 cohorts using the top 500 DMPs for each group (for cohorts with less than 500 DMPs, all DMPS were used). Cohort samples were aggregated using the median value of each probe within a group. A leaf node represents a cohort, with node sizes illustrating relative scales of the number of selected DMPs for the respective cohort, and node colors are indicative of the global mean methylation difference, a gradient of hypomethylation (blue) or hypermethylation (red). D Circular karyotype plot showing overlap of CHD2 450 K episignature probes (inner circle, n = 200), with CHD2 850 K episignature probes (middle circle, n = 200), and WGBS DMRs (n = 4 CHD2 vs. n = 6 unaffected controls) derived with at least a 15% methylation difference for the condensed visual representation (outer circle, n = 411). Each line depicts a probe or DMR where red denotes hypermethylation and blue denotes hypomethylation. The purple tracks depict coverage of the 450 K array probes (inner), 850 K EPIC array probes (middle), and WGBS reads (outer). Refer to Supplementary Fig. 33 for linear karyotype DMR plots for chr1-22.
Fig. 7
Fig. 7. The CHD2 Episignature is associated with DMRs enriched in regulatory regions.
A Karyotype plots depict direct overlap of multiple CHD2 episignature probes with DMRs (left=hypermethylated region, right=hypomethylated region) called from WGBS (n = 4 CHD2 vs. n = 6 unaffected controls). For each karyotype plot, the three grey tracks (upper panel above chromosome) depict individual red (hyper) or blue (hypo) dots for WGBS DMRs (upper), CHD2 850 K episignature probes (middle) and CHD2 450 K episignature probes (lower). The scale denotes the methylation difference between CHD2 relative to controls. Three purple tracks (lower panel below chromosome) depict the coverage for the 450 K array probes (lines, upper), 850 K array probes (lines, middle), and WGBS reads (distribution, lower). The coverage track for the WGBS was taken from a representative sample after inspecting the average coverage values across all the samples. “Zoomed” in karyotype plots of the boxed regions of probes clustering around for HOXA4 (hyper) and ZNF577 (hypo) are shown above or below the karyotype plots. Gene annotations are noted as within 200 bp or 1,500 bp of the transcription start site (TSS200, TSS1500), the 5’ untranslated region (5’UTR), or gene body (Body). For both examples, multiple episignature probes map to DMRs. B Enrichment (values in Supplementary Data 10) of CHD2 episignature probes and DMRs (n = 4767 from array and WGBS, Supplementary Data 8) in various regulatory regions (bivalent regions, enhancers, and promoters) annotated with GREEN-DB compared to randomly generated genomic regions (Replicate-1, Replicate-2, and Replicate-3, Supplementary Data 9) of equal number (n = 4767 regions each) and varying, comparable sizes (50–3100 bp in length). Fisher’s Exact P values were calculated using two-sided Fisher’s Exact tests to determine the significance of enrichment. In all cases of CHD2 vs. Replicate-X, Fisher P < 2.2e-16. Counts of the regions annotated displaying enrichment in CHD2 are shown in the upper bar plot, and relative proportions are shown in the lower plot. Transcription factor binding sites (TFBS) annotation counts are plotted in C. (Fisher P < 2.2e16). DNase sites annotation counts are plotted in D. (Fisher P < 2.2e16).

Update of

References

    1. Scheffer, I. E. et al. ILAE classification of the epilepsies: Position paper of the ILAE Commission for Classification and Terminology. Epilepsia58, 512–521 (2017). 10.1111/epi.13709 - DOI - PMC - PubMed
    1. Oliver, K. L. et al. Genes4Epilepsy: An epilepsy gene resource. Epilepsia64, 1368–1375 (2023). 10.1111/epi.17547 - DOI - PMC - PubMed
    1. Poke, G., Stanley, J., Scheffer, I. E. & Sadleir, L. G. Epidemiology of Developmental and Epileptic Encephalopathy and of Intellectual Disability and Epilepsy in Children. Neurology100, e1363–e1375 (2023). 10.1212/WNL.0000000000206758 - DOI - PMC - PubMed
    1. Palmer, E. E. et al. Integrating exome sequencing into a diagnostic pathway for epileptic encephalopathy: Evidence of clinical utility and cost effectiveness. Mol. Genet Genom. Med6, 186–199 (2018).10.1002/mgg3.355 - DOI - PMC - PubMed
    1. McTague, A., Howell, K. B., Cross, J. H., Kurian, M. A. & Scheffer, I. E. The genetic landscape of the epileptic encephalopathies of infancy and childhood. Lancet Neurol.15, 304–316 (2016). 10.1016/S1474-4422(15)00250-1 - DOI - PubMed