. 2024 Aug 6;10(1):351.
doi: 10.1038/s41420-024-02115-y.

HDAC3 genetic and pharmacologic inhibition radiosensitizes fusion positive rhabdomyosarcoma by promoting DNA double-strand breaks

Affiliations

HDAC3 genetic and pharmacologic inhibition radiosensitizes fusion positive rhabdomyosarcoma by promoting DNA double-strand breaks

Matteo Cassandri et al. Cell Death Discov. .

Abstract

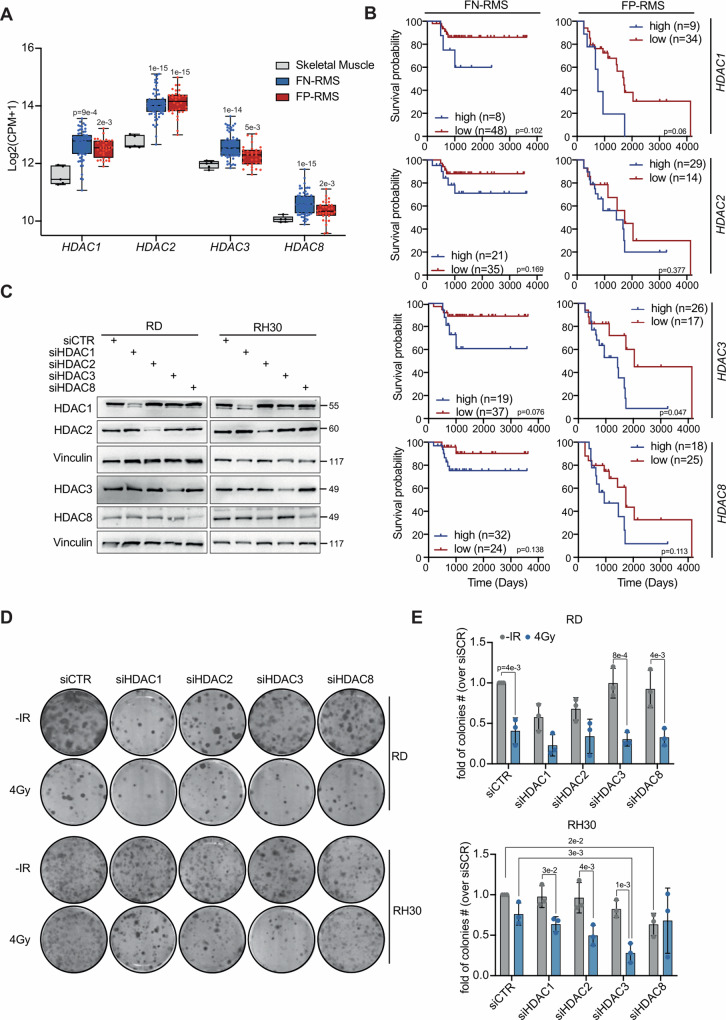
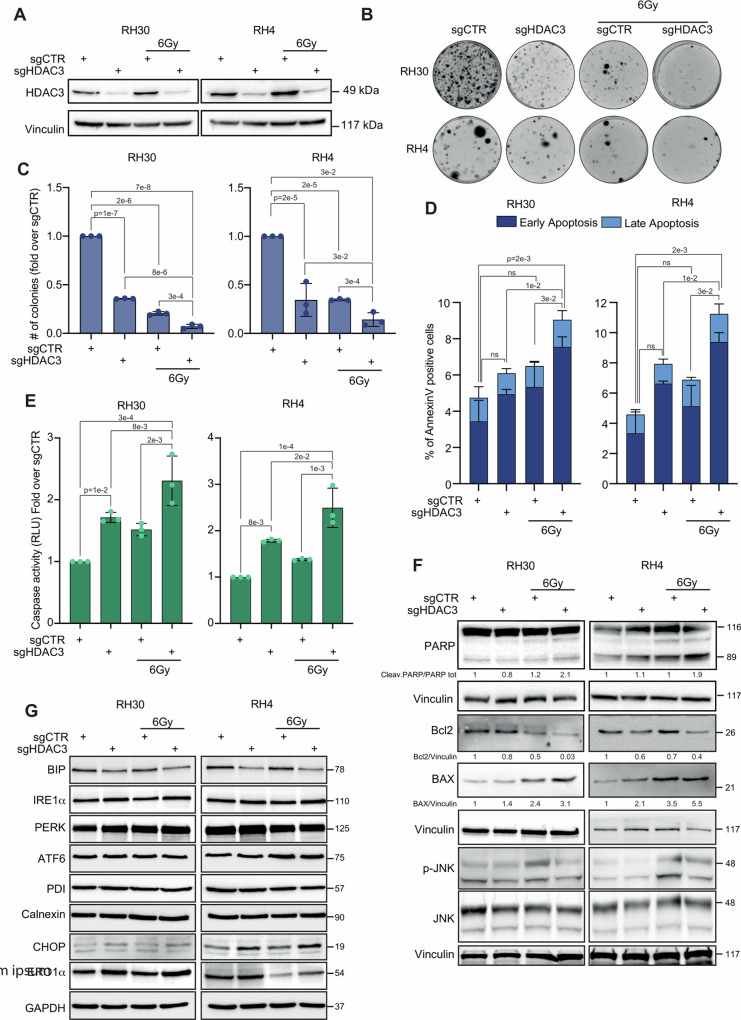
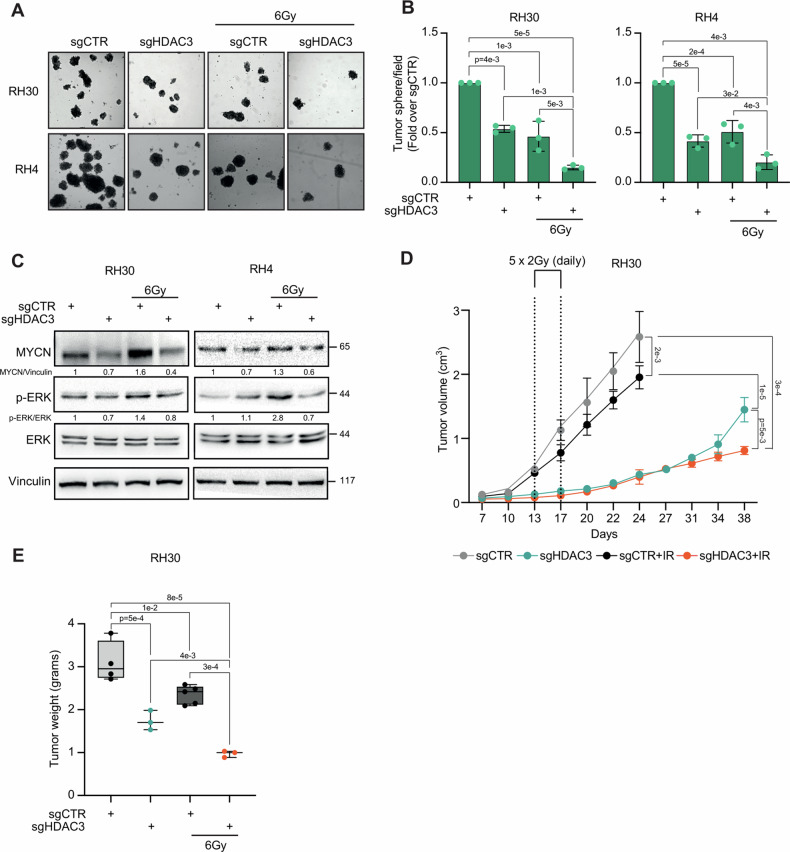
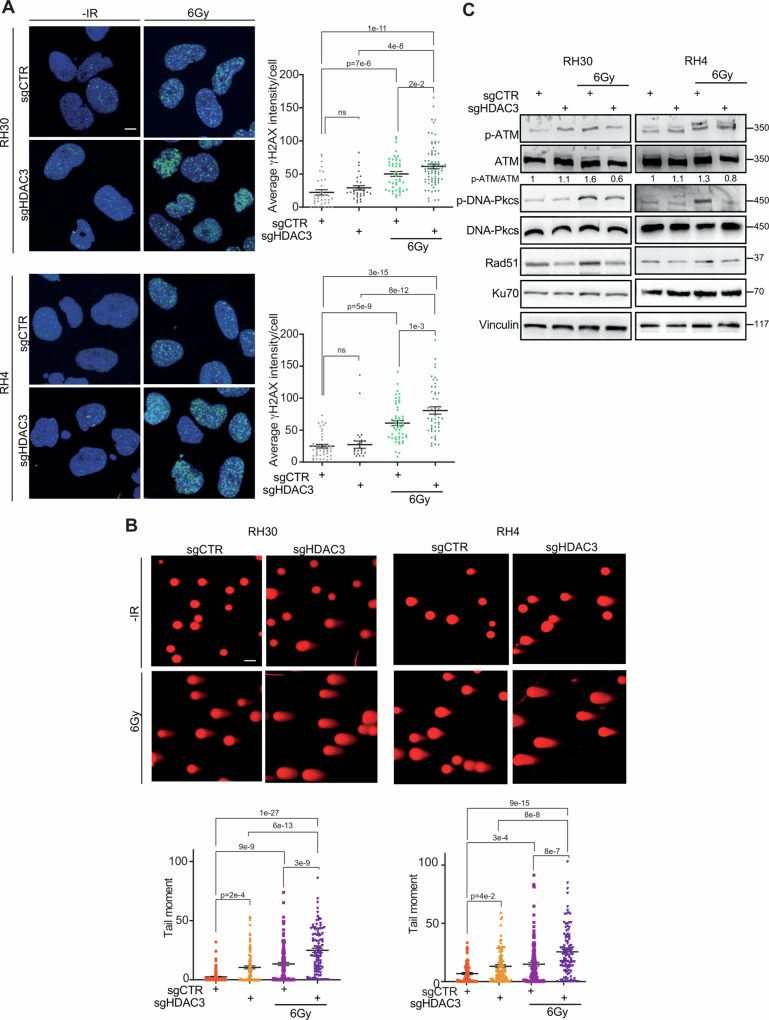
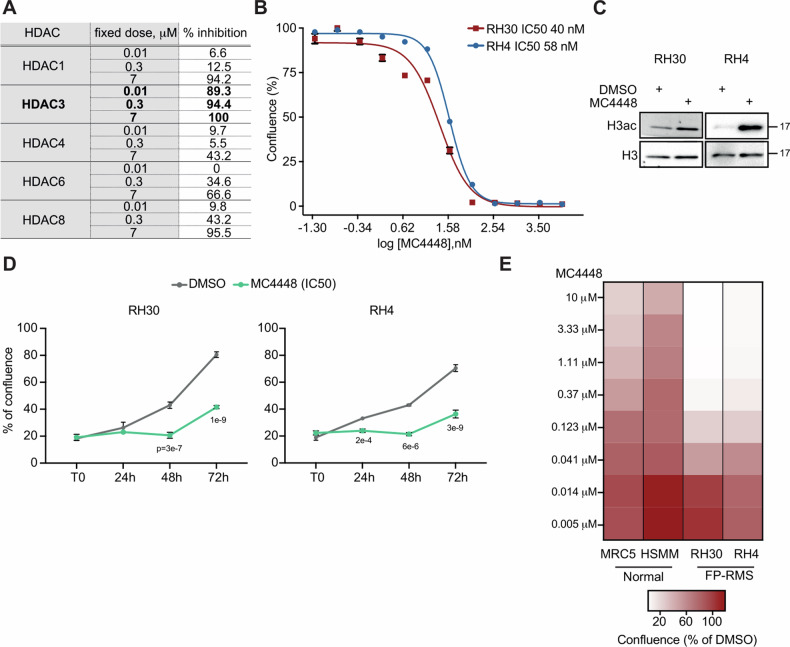
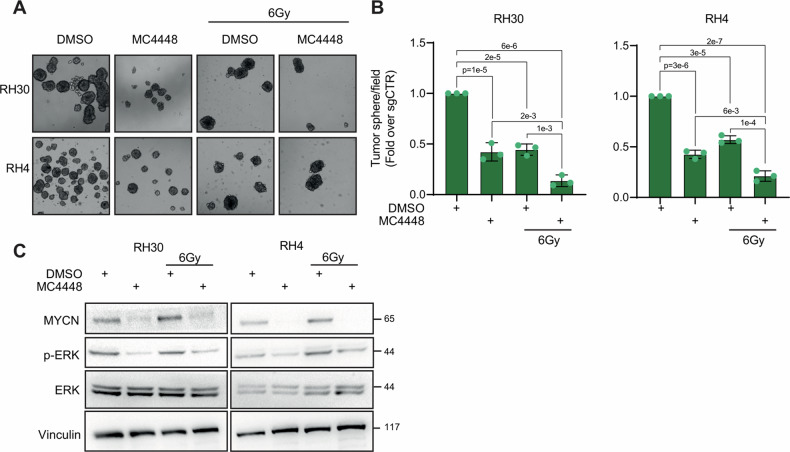
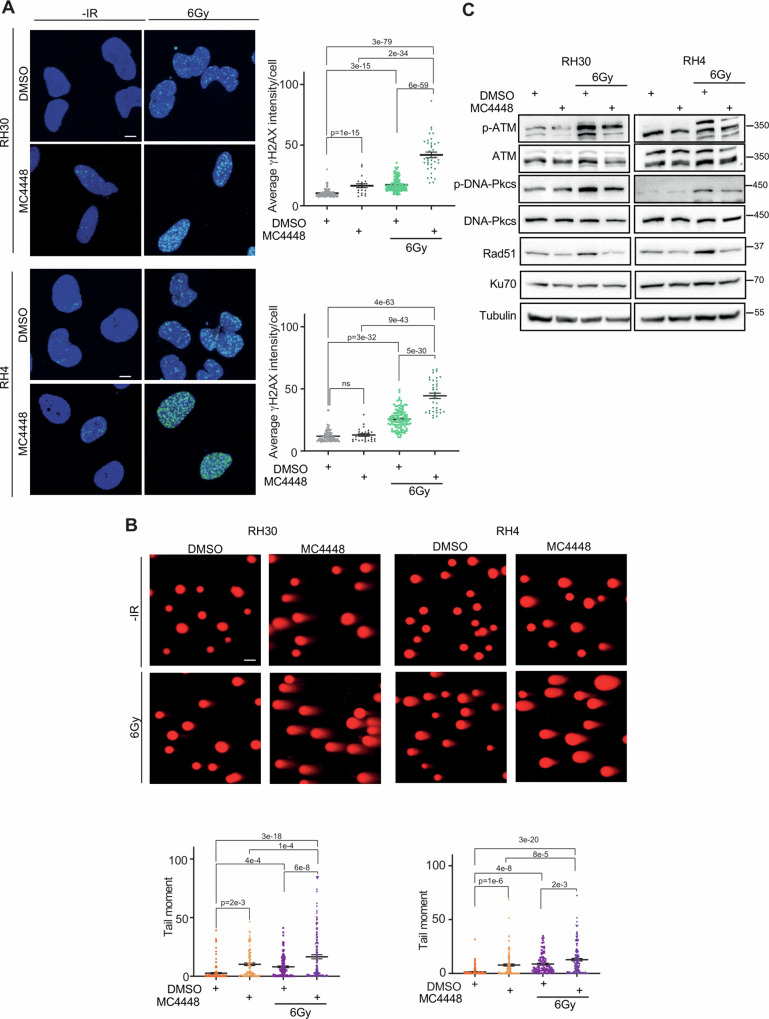
Radiotherapy (RT) plays a critical role in the management of rhabdomyosarcoma (RMS), the prevalent soft tissue sarcoma in childhood. The high risk PAX3-FOXO1 fusion-positive subtype (FP-RMS) is often resistant to RT. We have recently demonstrated that inhibition of class-I histone deacetylases (HDACs) radiosensitizes FP-RMS both in vitro and in vivo. However, HDAC inhibitors exhibited limited success on solid tumors in human clinical trials, at least in part due to the presence of off-target effects. Hence, identifying specific HDAC isoforms that can be targeted to radiosensitize FP-RMS is imperative. We, here, found that only HDAC3 silencing, among all class-I HDACs screened by siRNA, radiosensitizes FP-RMS cells by inhibiting colony formation. Thus, we dissected the effects of HDAC3 depletion using CRISPR/Cas9-dependent HDAC3 knock-out (KO) in FP-RMS cells, which resulted in Endoplasmatic Reticulum Stress activation, ERK inactivation, PARP1- and caspase-dependent apoptosis and reduced stemness when combined with irradiation compared to single treatments. HDAC3 loss-of-function increased DNA damage in irradiated cells augmenting H2AX phosphorylation and DNA double-strand breaks (DSBs) and counteracting irradiation-dependent activation of ATM and DNA-Pkcs as well as Rad51 protein induction. Moreover, HDAC3 depletion hampers FP-RMS tumor growth in vivo and maximally inhibits the growth of irradiated tumors compared to single approaches. We, then, developed a new HDAC3 inhibitor, MC4448, which showed specific cell anti-tumor effects and mirrors the radiosensitizing effects of HDAC3 depletion in vitro synergizing with ERKs inhibition. Overall, our findings dissect the pro-survival role of HDAC3 in FP-RMS and suggest HDAC3 genetic or pharmacologic inhibition as a new promising strategy to overcome radioresistance in this tumor.


Conflict of interest statement

The authors declare no competing interests.

Figures

Fig. 1
Fig. 1. High HDAC3 expression sustain radioresistance in FP-RMS cells.
A Box plot depicting Class-I HDACs among normal skeletal muscle tissue (n = 5), FP- (n = 32) and FN-RMS (n = 66) patients using GSE108022 dataset. B Kaplan–Meyer plot depicting correlation between Class-I HDACs expression level [Williamson dataset and FN- (n = 57) and FP-and FN-RMS (n = 45) patients’ survival (E-TABM-1202)]. C Representative western blot (n = 3) of all Class-I HDACs in RD and RH30 cells transfected with either Control (siCTR) or Class-I HDACs siRNAs (siHDAC1, siHDAC2, siHDAC3, siHDAC8) at 48 h post-transfection. Vinculin was used as loading control. D Representative images of RD and RH30 colonies stained with crystal violet 12 days post seeding. RMS cells were transfected as in B and 48 h later irradiated with 4 Gy. The cells were processed 6 h post IR. E Histograms depicting the plating efficiency of RD and RH30 cells treated as in (D). Graph represents the mean of three independent experiments ±SD, one-way ANOVA. Exact p values are reported in the histograms.
Fig. 2
Fig. 2. HDAC3 depletion radiosensitizes FP-RMS cells inducing Caspase3/7 and PARP dependent apoptosis.
A Representative western blot (n = 3) depicting HDAC3 protein level of RH30 and RH4 cells stably expressing Cas9 infected with either sgControl (sgCTR) or sgRNA against HDAC3 (sgHDAC3) at 72 h post-infection and then treated or not with 6 Gy of IR. Vinculin was used as loading control. B Representative images of RH30 and RH4 colonies stained with crystal violet 12 days post seeding. FP-RMS cells were infected as in (A) and 72 h later irradiated or not with 6 Gy. The cells were processed 6 h post IR. C Histograms depicting the plating efficiency of RH30 and RH4 treated as in (B). Graph represents the mean of three independent experiments ±SD, one-way ANOVA. Exact p values are reported in the figure. D Histogram depicting the percentage of Annexin-V positive/7-AAD single- and double-positive RH30 and RH4 cells treated as in (B). Graphs represent the mean of three independent experiments ±SD, one-way ANOVA. Exact p values are reported in the figure. E Histogram depicts the quantification of Caspase 3/7 activity RH30 and RH4 cells treated as in (B). Graphs represent the mean of three independent experiments ±SD, one-way ANOVA. Exact p values are reported in the figure. F Representative western blot (n = 3) depicting levels of Cleaved- PARP1, Bcl2; BAX, p-JNK, and JNK of RH30 and RH4 cells infected with either sgCTR or sgHDAC3 at 72 h post-infection and the treated or not with 6 Gy of IR. Vinculin was used as loading control. G Representative western blot (n = 3) depicting levels of BIP, IRE1α, PERK, ATF6, PDI, Calnexin, CHOP and ERO1α of RH30 and RH4 cells infected with either sgCTR or sgHDAC3 at 72 h post-infection and the treated or not with 6 Gy of IR. GAPDH was used as loading control.
Fig. 3
Fig. 3. HDAC3 depletion in combination with IR reduces stemness and tumorigenicity in vitro and suppresses growth in vivo.
A Representative light microscopy pictures of cancer stem cell formation assay on RH30 and RH4 cells infected with either sgControl (sgCTR) or sgRNA against HDAC3 (sgHDAC3) at 72 h post-infection and then treated or not with 6 Gy of IR. Scale bar = 50 μm. B Histogram depicts the quantification of rhabdospheres number per field. n = 3 independent experiments, data presented as mean values ± SD, one-way ANOVA. C Representative western blot (n = 3) of RH30 and RH4 cells treated as in (A) reporting MYCN, pERK and ERK protein levels. Vinculin was used as loading control. D Tumor volume of sgCTR (n = 9), sgHDAC3 (n = 6) of RH30 cells xenografts assessed by caliper measurement represented in mm3 followed for 48 days post-inoculation. 13 days after inoculation mice were irradiated each 3 days for 5 times with a single dose of 2 Gy of IR. Data presented as mean values ± SD, two-way ANOVA. E Tumor weight of transplanted RH30 cell xenografts treated as in (D). Data presented as mean values ± SD, two-way ANOVA.
Fig. 4
Fig. 4. HDAC3 depletion in FP-RMS cell lines combined to IR induces DNA damage and impairs DNA repair.
A Representative immunofluorescence images of γH2AX foci (green, left) (n = 3 independent biological replicates) in HDAC3 depleted -RH30 and -RH4 cells 6 h post IR with 6 Gy. DAPI (blue) was used as nuclear counterstain. Images were taken using confocal microscopy with a ×60 oil immersion objective lens. Scale Bar = 10 μm. Scatter plot of γH2AX average intensity per cell number (right) in HDAC3 depleted -RH30 and -RH4 cells after 6 h post IR with 6 Gy. Graph represents the mean of three independent experiments ±SEM, ANOVA one-way test. Exact p-values are reported in the figure. B Analysis of DSBs accumulation by the neutral Comet assay. Representative images are reported above. RH30 and RH4 HDAC3 KO cells were exposed or not to 6 Gy of IR and after 6 h subjected to the neutral Comet assay. In the scatter plot below, data are presented as mean tail moment ±SEM, ANOVA one-way test. Exact p values are reported in the figure. C Representative western blot (n = 3 independent biological replicates) depicting the effect of IR (6 Gy), HDAC3 depletion and their combination on DNA damage. The cells were processed 6 h post IR. pATM (Ser 1981), total ATM, pDNA-PKcs (Thr2609), total pDNA-PKcs, Rad51, and Ku70 protein levels were detected. All protein levels were normalized on Vinculin.
Fig. 5
Fig. 5. MC4448 is a new potent and highly selective HDAC3 inhibitor.
A Biochemical data of MC4448 against HDAC1, −3, −4, −6 and −8 at three fixed doses (0.01, 0.3, and 7 µM). B Dose-response curves of RH30 and RH4 cells treated with increasing concentration of MC4448. Graph represents the mean of three independent experiment ±SEM. C Representative western blot (n = 3) of RH30 and RH4 treated with MC4448 IC50 for 24 h showing levels of acetylated H3. Vinculin was used as loading control. D Growth curve analysis of RH30 and RH4 cells treated as in (C). n = 3 independent experiments, data presented as mean values ± SD, Student’s two-tailed t test. E Heatmap depicting dose response effect of MC4448 treatment for 72 h on FP-RMS cells (RH30 and RH4), and Normal Human Skeletal Muscle Myoblast (HSMM) and Normal Fetal Human Lung Fibroblast (MRC5).
Fig. 6
Fig. 6. MC4448 treatment mirrors HDAC3 depletion effects radiosensitizing FP-RMS cells.
A Representative images of RH30 and RH4 colonies stained with crystal violet 12 days post seeding. FP-RMS cells were treated with either MC4448 IC50 (40 nM for RH30 and 58 nM for RH4) or DMSO for 24 h and then irradiated or not with 6 Gy. The cells were processed 6 h post IR. B Histograms depicting the plating efficiency of RH30 and RH4 treated as in (A). Graph represents the mean of three independent experiments ±SD, one-way ANOVA. Exact p values are reported in the figure. C Histogram depicting the percentage of Annexin-V positive/7-AAD single- and double-positive RH30 and RH4 cells treated as in (A). Graphs represent the mean of three independent experiments ±SD, one-way ANOVA. Exact p values are reported in the figure. D Histogram depicts the quantification of Caspase 3/7 activity in RH30 and RH4 cells treated as in (A). Graphs represent the mean of three independent experiments ±SD, one-way ANOVA. Exact p-values are reported in the figure. E. Representative western blot (n = 3) depicting levels of Bcl2 and BAX of RH30 and RH4 cells treated with either DMSO or MC4448 IC50 for 24 h and then treated or not with 6 Gy of IR. Vinculin was used as loading control. F Representative western blot (n = 3) depicting levels of BIP, IRE1α, PERK, ATF6, PDI, Calnexin, CHOP, and ERO1α of RH30 and RH4 cells infected with either DMSO or MC4448 at for 24 h and then treated or not with 6 Gy of IR. GAPDH was used as loading control.
Fig. 7
Fig. 7. MC4448 treatment in combination with IR reduces stemness and counteracts IR-dependent induction of MYCN and p-ERK.
A Representative light microscopy pictures of cancer stem cell formation assay on RH30 and RH4 cells treated with either DMSO or MC4448 IC50 for 24 h and then treated or not with 6 Gy of IR and grown for 2 weeks. Scale bar = 50 μm. B Histogram depicts the quantification of rhabdosphere numbers per field. n = 3 independent experiments, data presented as mean values ± SD, one-way ANOVA. C Representative western blot (n = 3) of RH30 and RH4 cells treated as in A reporting MYCN, pERK and ERK protein levels. Vinculin was used as loading control.
Fig. 8
Fig. 8. The combination of IR and MC4448 inhibitor induces DNA damage and impairs DNA repair.
A Representative immunofluorescence images of γH2AX (green, left) (n = 3 independent biological replicates) in MC4448 treated RH30 and RH4 cells 6 h post IR with 6 Gy. DAPI (blue) was used as nuclear counterstain. Scale Bar = 10 μm. Scatter plot of γH2AX average intensity per cell number (right) in MC4448 treated RH30 and RH4 cells after 6 h post IR with 6 Gy. Graph represents the mean of three independent experiments ±SEM, ANOVA one-way test. Exact p values are reported in the figure. B Analysis of DSBs accumulation by the neutral Comet assay. Representative images are reported above. RH30 and RH4 cells were treated with MC4448 and then exposed to 6 Gy of IR. After 6 h FP-RMS cells were subjected to the neutral Comet assay. In the scatter plot below, data are presented as mean tail moment ± SEM, ANOVA one-way test. Exact p values are reported in the figure. C Representative western blot (n = 2 independent biological replicates) of FP-RMS cells treated with MC4448 and IR (6 Gy). The cells were processed 6 h post IR to evaluate the effect of combination of treatments on DNA damage response. pATM (Ser 1981), total ATM, pDNA-PKcs (Thr2609), total pDNA-PKcs, Rad51, and Ku70 protein levels were detected. All protein levels were normalized on Vinculin.

References

    1. Skapek SX, Ferrari A, Gupta AA, Lupo PJ, Butler E, Shipley J, et al. Rhabdomyosarcoma. Nat Rev Dis Primers. 2019;5. 10.1038/s41572-018-0051-2. - PMC - PubMed
    1. Yechieli RL, Mandeville HC, Hiniker SM, Bernier‐Chastagner V, McGovern S, Scarzello G, et al. Rhabdomyosarcoma. Pediatr Blood Cancer. 2021; 68. 10.1002/pbc.28254. - PubMed
    1. Davicioni E, Anderson MJ, Finckenstein FG, Lynch JC, Qualman SJ, Shimada H, et al. Molecular classification of Rhabdomyosarcoma—genotypic and phenotypic determinants of diagnosis. Am J Pathol. 2009;174:550–64. 10.2353/ajpath.2009.080631 - DOI - PMC - PubMed
    1. Shern JF, Selfe J, Izquierdo E, Patidar R, Chou H-C, Song YK, et al. Genomic classification and clinical outcome in Rhabdomyosarcoma: a report from an International Consortium. J Clin Oncol. 2021;39:2859–71. 10.1200/JCO.20.03060 - DOI - PMC - PubMed
    1. Skapek SX, Anderson J, Barr FG, Bridge JA, Gastier-Foster JM, Parham DM, et al. PAX-FOXO1 fusion status drives unfavorable outcome for children with rhabdomyosarcoma: a children’s oncology group report. Pediatr Blood Cancer. 2013;60:1411–7. 10.1002/pbc.24532 - DOI - PMC - PubMed

LinkOut - more resources