. 2024 Aug 6;15(1):6680.
doi: 10.1038/s41467-024-50950-5.

Reprogramming the tumor immune microenvironment using engineered dual-drug loaded Salmonella

Affiliations

Reprogramming the tumor immune microenvironment using engineered dual-drug loaded Salmonella

Dinh-Huy Nguyen et al. Nat Commun. .

Erratum in

Abstract

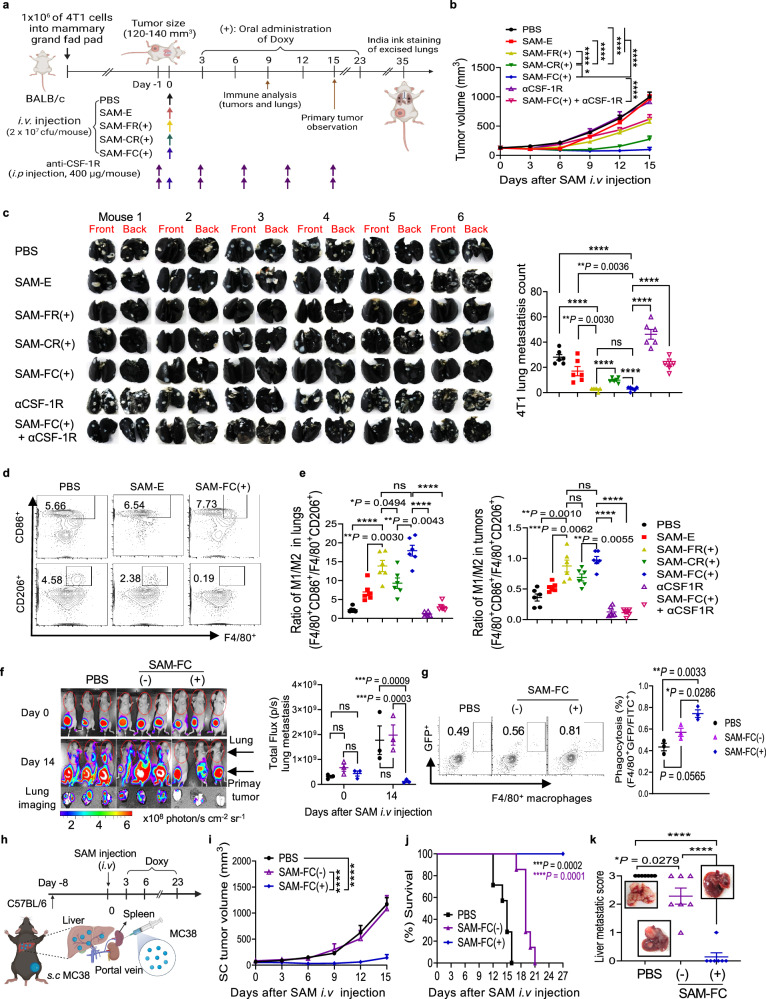
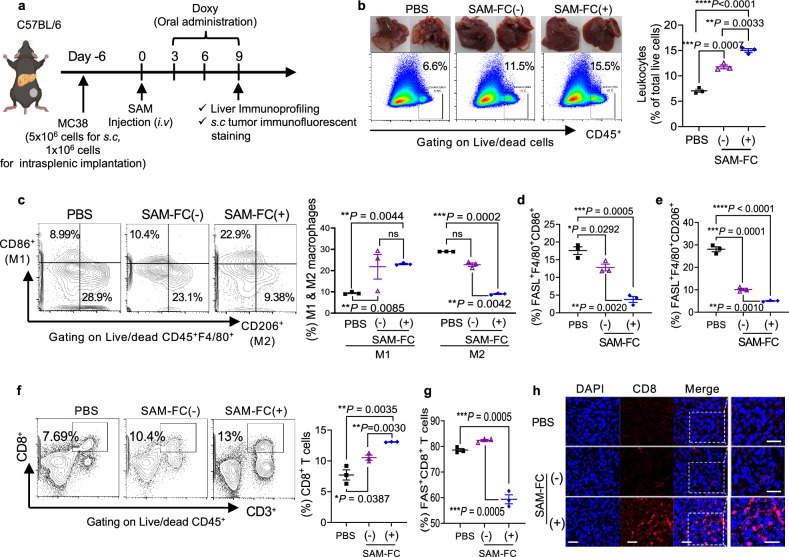
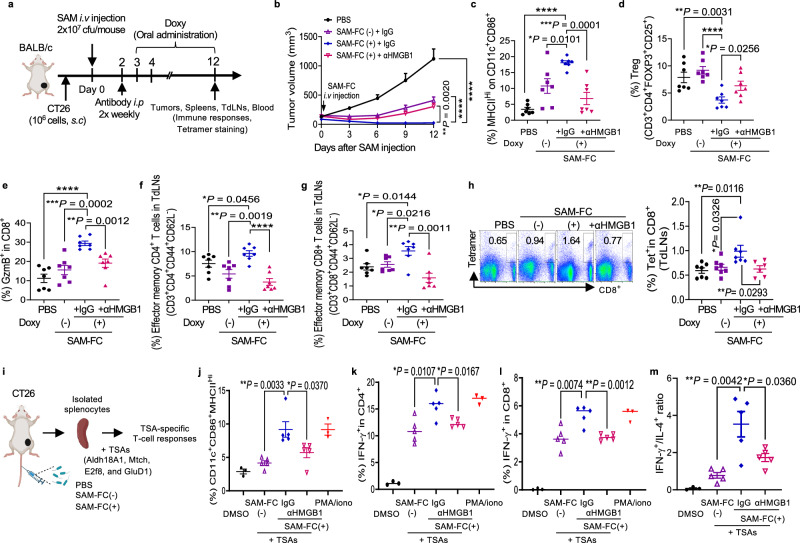
Synergistic combinations of immunotherapeutic agents can improve the performance of anti-cancer therapies but may lead to immune-mediated adverse effects. These side-effects can be overcome by using a tumor-specific delivery system. Here, we report a method of targeted immunotherapy using an attenuated Salmonella typhimurium (SAM-FC) engineered to release dual payloads: cytolysin A (ClyA), a cytolytic anti-cancer agent, and Vibrio vulnificus flagellin B (FlaB), a potent inducer of anti-tumor innate immunity. Localized secretion of ClyA from SAM-FC induces immunogenic cancer cell death and promotes release of tumor-specific antigens and damage-associated molecular patterns, which establish long-term antitumor memory. Localized secretion of FlaB promotes phenotypic and functional remodeling of intratumoral macrophages that markedly inhibits tumor metastasis in mice bearing tumors of mouse and human origin. Both primary and metastatic tumors from bacteria-treated female mice are characterized by massive infiltration of anti-tumorigenic innate immune cells and activated tumor-specific effector/memory T cells; however, the percentage of immunosuppressive cells is low. Here, we show that SAM-FC induces functional reprogramming of the tumor immune microenvironment by activating both the innate and adaptive arms of the immune system and can be used for targeted delivery of multiple immunotherapeutic payloads for the establishment of potent and long-lasting antitumor immunity.


Conflict of interest statement

A patent for a novel DNA construct aimed at the diagnosis and treatment of cancer (KR102252939) has been registered by J.M., Y.H., and S.Y. as the inventors. In addition, a patent application for an innovative anticancer therapy using engineered bacteria expressing flagellin and pore-forming proteins (KR1020210153355) has been submitted by J.M., Y.H., S.Y., and D.N. as its inventors. CNCure Biotech, Inc. possesses exclusive licenses for these intellectual properties. This IP stands to gain financial benefits upon further validation. The remaining authors declare no competing interests.

Figures

Fig. 1
Fig. 1. SAM-FC-mediated induction of tumor regression and long-term immunological memory in tumor-bearing mouse models.
a Visual representation of the therapeutic mechanism underlying the mode of action of Salmonella (SAM) engineered to express ClyA and FlaB (SAM-FC). b Experimental scheme. Briefly, BALB/c mice were implanted subcutaneously (s.c) with CT26 cells. When tumors reached approximately 120 mm3 (day 0), the mice were randomly divided into five treatment groups: PBS; SAM-E; SAM-FR; SAM-CR; and SAM-FC. Mice received bacteria by intravenous injection (arrow). Bacteria-treated mice were then given Doxy (orally, 1.7 mg/kg) daily from day 3. ( + ) means Doxy was administered. The tumor-eradicated mice (survivors) were s.c rechallenged with CT26 cells on day 90. Naïve age-matched mice were implanted with CT26 cells used as controls. c Average growth curves of primary CT26 tumors [PBS (n = 24), SAM-E (n = 24), SAM-FR(+) (n = 21), SAM-CR (+) (n = 21), and SAM-FC(+) (n = 32)]. All mice were examined from three independent experimental replicates; *P = 0.0149, ****P < 0.0001; ns not significant; two-way ANOVA with Tukey’s multiple comparisons test. d Kaplan-Meier survival curves from (c) [*P = 0.0284, ***P = 0.0001 and ****P < 0.0001; Log-rank (Mantel-Cox) test]. e Average growth curves after CT26 tumor rechallenge [SAM-FR(+) (n = 6), SAM-CR(+) (n = 6), SAM-FC(+) (n = 16), and naïve mice (n = 9)]. All mice were examined from three independent experimental replicates; ****P < 0.0001; ns, not significant; two-way ANOVA with Tukey’s multiple comparisons test. f Experiment scheme. g Average growth curves of primary MC38 tumors [PBS (n = 9), SAM-E (n = 9), SAM-FR(+) (n = 10), SAM-CR(+) (n = 10), and SAM-FC(+) (n = 15)]. All mice were examined from two independent experimental replicates; **P = 0.0015, ***P = 0.0004, ****P < 0.0001; ns not significant; two-way ANOVA with Tukey’s multiple comparisons test. h Kaplan-Meier survival curves from (g) [*P = 0.0240, **P = 0.0017 in PBS vs SAM-CR(+), **P = 0.0014 in SAM-E vs SAM-FR(+), ****P < 0.0001; ns not significant; Log-rank in Mantel-Cox test]. i Average growth curves after MC38 tumor rechallenge [SAM-FR(+) (n = 7), SAM-CR(+) (n = 5 mice), SAM-FC(+) (n = 12), and naïve mice (n = 9 mice)]. All mice were examined from two independent experimental replicates; ***P = 0.0007 in SAM-FC(+) vs SAM-FR(+); ****P < 0.0001; ns, not significant; two-way ANOVA with Tukey’s multiple comparisons test.
Fig. 2
Fig. 2. Immunoprofiling of tumor-infiltrating immune cells after treatment with engineered SAM.
a Experimental schedule for SAM treatment of CT26 subcutaneous tumor (s.c)-bearing mice. Mice received the indicated amounts of SAM by intravenous (i.v) injection when their tumors had reached approximately 120 mm3 (day 0). Bacteria-treated mice were then given Doxy (orally, 1.7 mg/kg) daily from day 3. ( + ) means Doxy was administered. Tumors, spleens, tumor-draining lymph nodes (TdLNs), and blood were isolated on day 9 for flow cytometry (FACS) analysis. Ex vivo isolated tumor-infiltrating lymphocytes were restimulated with PMA/ionomycin in the presence of brefeldin A. bg Frequency of isolated intratumoral M1-like macrophages (F4/80+CD86+) (b), M2-like macrophages (F4/80+CD206+) (c), activated DCs (CD11c+CD86+MHCIIHi) (d), Tregs (CD3+CD4+CD25+FOXP3+) (e), activated CD4+ T cells (CD4+FOXP3IFN-γ+) (f), activated CD8+ T cells (GzmB+CD8+) (g) (n = 7 mice examined from two independent experimental replicates; ****P < 0.0001; ns not significant; unpaired two-tailed t-test). h, i Frequencies of L-2Ld MuLV gp70 peptide tetramer-bound (Tet+) CD8+ T cells in peripheral blood (left), TdLNs (middle), and tumors (right) (h); and exhausted/activated CD8+ T cells (PD-1+CD8+) (i) n = 7 mice examined from two independent experimental replicates; ****P < 0.0001; ns, not significant; unpaired two-tailed t-test). j, k Frequencies of central memory CD4+ T cells (CD4+CD44HiCD62Hi) (j) and central memory CD8+ T cells (CD8+CD44HiCD62Hi) (k) in TdLNs (n = 7 mice examined from two independent experimental replicates; ****P < 0.0001; ns not significant; unpaired two-tailed t-test). l Experimental scheme for SAM-FC treatment of CT26 tumor-bearing BALB/c mice with T cell depletion. The mice were injected intravenously with 2 × 107 cfu SAM-FC(+). T cells were depleted by intraperitoneal administration of anti-CD4 (αCD4) or anti-CD8 (αCD8) antibodies (200 µg/mouse, i.p injection, twice per week for 5 times). IgG isotype was used as a control. m Average tumor growth curves (left) and representative images (right) of CT26 tumor-bearing BALB/c mice with or without T cell depletion after SAM-FC(+) treatment as described in (l) (n = 5 mice/group, from one experiment; ****P < 0.0001; ns, not significant; two-way ANOVA with Tukey’s multiple comparisons test).
Fig. 3
Fig. 3. Inhibition of lung and liver metastases by SAM-FC in different murine and human tumor models.
a Experimental scheme. Briefly, 4T1 cells were implanted into the mammary fat pad of BALB/c mice. When tumors reached approximately 140 mm3, mice received bacteria through i.v injection (day 0). Doxy (+) and CSF-1R antibody (αCSF-1R) were administered as shown. Pimary tumors and metastatic lungs were collected on day 15 and 35, respectively (b, c) and flow cytometry was performed on day 9 (d, e). b Average growth curves of 4T1 primary tumors (n = 6 mice examined from two independent experimental replicates; *P = 0.0144, ****P < 0.0001; two-way ANOVA with Tukey’s multiple comparisons test). c Individual images (left) and metastatic nodule count (right) of lungs (n = 6 examined from two independent experimental replicates; ****P < 0.0001; ns not significant; unpaired two-tailed t-test). d Flow cytometry gating of M1 (F4/80+ CD86+) and M2 (F4/80+ CD206+) macrophages. e Ratio of M1/M2 macrophages in lungs (left) and tumors (right) (n = 6 mice examined from two independent experimental replicates; ****P < 0.0001; ns, not significant; unpaired two-tailed t-test). f In vivo and ex vivo bioluminescent imaging of MDA-MB-231-FLuc-GFP lung metastasis. Left, images of the mice on day 0 (pre-treatment) and on day 14 (post-treatment) and the excised lungs on day 14; right, quantitation of bioluminescence levels in the lungs. g Frequency of macrophages phagocytosing tumor cells (F4/80+GFP+) in the metastatic lungs of (f) (n = 3 mice/group, from one experiment, unpaired two-tailed t-test). h Experimental scheme. i Average growth curves of subcutaneous tumors (n = 7 mice examined from two independent experimental replicates; ****P < 0.0001; two-way ANOVA with Tukey’s multiple comparisons test). j Kaplan-Meier survival curves (n = 7 mice examined from two independent experimental replicates; ****P < 0.0001; Log-rank (Mantel-Cox) test). k Metastatic scores of livers. Metastatic nodules on the liver surface were counted at the experimental end point. The scores were classified as follows: 0, 0%; 1, <20%; 2, 20%–50%; 3, >50% (n = 7 mice examined from two independent experimental replicates; ****P < 0.0001; unpaired two-tailed t-test).
Fig. 4
Fig. 4. Immunophenotyping of hepatic metastases after treatment with engineered SAM-FC.
a Experimental scheme. C57BL/6 mice were implanted with MC38 cells simultaneously via the subcutaneous (s.c) and intrasplenic routes (SC + liver tumors) (day 0), and sequentially intravenously (i.v) injected with SAM-FC (2 × 107 cfu) on day 6 after tumor implantation. Bacteria-treated mice were then given Doxy (1.7 mg/kg, orally once daily) starting on day 3. The liver metastatic tumors and subcutaneous tumors were harvested on day 9 for flow cytometry analysis and immunofluorescence staining; (+) means Doxy was administered, (−) means no Doxy. b Frequency of CD45+ total leukocytes in the liver. Representative liver images (left upper panels). Flow cytometry plots of CD45+/− cells after live cell gating; the CD45+ cells are shown within the gates (left bottom). Quantitation of CD45+ cells (right) (n = 3 mice/group, from one experiment; unpaired two-tailed t-test). ce Different macrophage subsets in the liver. c Classification of M1-like (CD80+ CD206) and M2-like (CD80 CD206+) macrophages after gating on CD45+F4/80+ cells (left panels). Percentages of M1-like and M2-like subtypes within the total macrophage population (right panel) (n = 3 mice/group, from one experiment; ns not significant; two-way ANOVA with Tukey’s multiple comparisons test). FasL expression by M1- (d) and M2-(e) like macrophages (n = 3 mice/group, from one experiment; unpaired two-tailed t-test). f, g Frequencies of CD8+ T cells in different treatment groups (f) and the expression of Fas on CD8+ T cells (g) (n = 3 mice/group, from one experiment; unpaired two-tailed t-test). Please also see flow cytometry gating strategies in Supplementary Fig. 10m. h Immunofluorescence staining of CD8+ T cells isolated from the MC38 subcutaneous tumors of mice with subcutaneous tumor and liver metastasis treated with PBS or SAM-FC(−/+). The subcutaneous tumors were harvested and analysed on day 9, as described in (a). Scale bar, 50 µm.
Fig. 5
Fig. 5. Relationship between HMGB1 expression, cross-presentation of TSAs, and specific T cell responses in mice treated with SAM-FC.
a Experimental scheme of HMGB1 neutralization in mice treated with SAM-FC. BALB/c mice were implanted subcutaneously (s.c) with 5 × 105 CT26 cells. Tumor-bearing mice were injected intravenously with PBS alone or with SAM-FC (day 0) when tumor volume reached approximately 120 mm3. An anti-HMGB1 antibody (αHMGB1) was administrated intraperitoneally (i.p) twice a week (starting on day 2). An isotype antibody (IgG) was injected as a negative control. Tumors, spleens, tumor-draining lymph nodes (TdLNs), and peripheral blood were obtained on day 12. The splenocytes were co-cultured with a pool of four TSAs derived from the CT26 proteins Mtch1, Aldh18a1, E2f8, and Glud1. The tumor-specific immune response was evaluated by flow cytometry and in ELISA assays. b Average tumor growth curves (n = 10 mice examined from two independent experimental replicates; ****P < 0.0001; two-way ANOVA with Tukey’s multiple comparisons test). Frequency of intratumoral activated DCs (CD11c+ CD86+ MHCIIHi) (c), intratumoral Treg (CD3+CD4+FOXP3+CD25+) cells (d), activated intratumoral CD8+ T (GzmB+CD8+) cells (e), effector memory CD4+ T cells (CD3+CD4+CD44+CD62L) in TdLNs (f), CD8+ T cells (CD3+CD4+CD44+CD62L) in TdLNs (g), tumor specific CD8+ T (Tet+CD8+) cells in TdLNs (h) (n = 7 mice examined from two independent experimental replicates; ****P < 0.0001; unpaired two-tailed t-test). i Experimental scheme for evaluating the tumor-specific antigen (TSA)-specific T cell responses. CT26-bearing mice were treated with PBS, SAM-FC(−) or SAM-FC(+). Splenocytes were isolated on day 9 and co-cultured with TSA peptides overnight. The TSA-specific T cell response was then evaluated. Frequency of activated DCs (CD11c+CD86+MHCIIHi) (j), activated CD4+ T (CD45+CD3+IFN-γ+CD4+) cells (k), activated CD8+ T (CD45+CD3+IFN-γ+CD8+) cells (l) (n = 5 mice/group, from one experiment; unpaired two-tailed t-test). m The IFN-γ to IL-4 ratio produced by splenocytes; the cytokine concentrations were measured by ELISA (n = 5 mice/group, from one experiment; unpaired two-tailed t-test). Dimethyl sulfoxide (DMSO) and PMA/ionomycin were used as negative and positive controls, respectively.
Fig. 6
Fig. 6. Targeting of multiple tumors and induction of antitumor immune responses by unilateral intratumoral injection of SAM-FC.
CT26 cells (1 × 106) were implanted subcutaneously (s.c) into both hind flanks of BALB/c mice. When the tumors reached approximately 120–150 mm3, mice received an intratumoral (i.t) injection of SAM-lux (4 × 108 cfu), SAM-FR (2 × 108 cfu), or SAM-FC (2 × 108 cfu) into a tumor in the left flank. a Representative bioluminescence images of a mouse treated with SAM-lux (n = 3 mice/group, from one experiment); images were taken before and after bacterial treatment. b Representative bioluminescence images of a mouse treated with SAM-FR (n = 3 mice/group, from one experiment); images were taken after intravenous injection of coelenterazine, 12 h after the oral adminstration of Doxy on the indicated day. The images of mice in the Doxy (−) group were taken 12 h before Doxy adminstration. c Biodistribution of SAM-FC. After i.t injection of bacteria, the indicated organs or tissues were harvested on day 1, 3, and 5 for viable bacterial count. (n = 3 mice/group, from one experiment; ns not significant; two-way ANOVA with Tukey’s multiple comparisons test). d Average growth curves of injected and uninjected distal tumors. Bacterial i.t injection (2 × 108 cfu) was performed as shown (upper panel). The volumes of treated (left bottom) and untreated (right bottom) tumors were measured every 3 days, starting on day 0. PBS, untreated control group (n = 5 mice/group, from one experiment; **P = 0.0027, ****P < 0.0001; two-way ANOVA with Tukey’s multiple comparisons test). Please also see Supplementary Fig. 13. e Frequency of different immune cells within uninjected distal tumors. Uninjected distal tumors were obtained on day 9 and analyzed. Left, proliferating conventional CD4+ T cells (Ki-67+CD4+FOXP3); middle, proliferating CD8+ T cells (Ki67+CD8+); right, Tregs (CD3+CD4+FOXP3+CD25+) (n = 5 mice/group, from one experiment; ***P = 0.0001, ****P < 0.0001; unpaired two-tailed t-test). Please also see Supplementary Fig. 7a–c.

References

    1. Limeta, A., Ji, B., Levin, M., Gatto, F. & Nielsen, J. Meta-analysis of the gut microbiota in predicting response to cancer immunotherapy in metastatic melanoma. JCI Insight5, e140940 (2020). - PMC - PubMed
    1. Sun, J.-Y. et al. Resistance to PD-1/PD-L1 blockade cancer immunotherapy: mechanisms, predictive factors, and future perspectives. Biomark. Res.8, 1–10 (2020). - PMC - PubMed
    1. Haslam, A. & Prasad, V. Estimation of the percentage of US patients with cancer who are eligible for and respond to checkpoint inhibitor immunotherapy drugs. JAMA Netw. Open2, e192535–e192535 (2019). - PMC - PubMed
    1. D’Alise, A. M. et al. Adenoviral vaccine targeting multiple neoantigens as strategy to eradicate large tumors combined with checkpoint blockade. Nat. Commun.10, 1–12 (2019). - PMC - PubMed
    1. Xie, N. et al. Neoantigens: promising targets for cancer therapy. Signal Transduct. Target. Ther.8, 9 (2023). - PMC - PubMed

MeSH terms

LinkOut - more resources