. 2024 Aug 6;15(8):567.
doi: 10.1038/s41419-024-06961-7.

Stanniocalcin 2 governs cancer cell adaptation to nutrient insufficiency through alleviation of oxidative stress

Affiliations

Stanniocalcin 2 governs cancer cell adaptation to nutrient insufficiency through alleviation of oxidative stress

Shuo Qie et al. Cell Death Dis. .

Abstract

Solid tumours often endure nutrient insufficiency during progression. How tumour cells adapt to temporal and spatial nutrient insufficiency remains unclear. We previously identified STC2 as one of the most upregulated genes in cells exposed to nutrient insufficiency by transcriptome screening, indicating the potential of STC2 in cellular adaptation to nutrient insufficiency. However, the molecular mechanisms underlying STC2 induction by nutrient insufficiency and subsequent adaptation remain elusive. Here, we report that STC2 protein is dramatically increased and secreted into the culture media by Gln-/Glc- deprivation. STC2 promoter contains cis-elements that are activated by ATF4 and p65/RelA, two transcription factors activated by a variety of cellular stress. Biologically, STC2 induction and secretion promote cell survival but attenuate cell proliferation during nutrient insufficiency, thus switching the priority of cancer cells from proliferation to survival. Loss of STC2 impairs tumour growth by inducing both apoptosis and necrosis in mouse xenografts. Mechanistically, under nutrient insufficient conditions, cells have increased levels of reactive oxygen species (ROS), and lack of STC2 further elevates ROS levels that lead to increased apoptosis. RNA-Seq analyses reveal STC2 induction suppresses the expression of monoamine oxidase B (MAOB), a mitochondrial membrane enzyme that produces ROS. Moreover, a negative correlation between STC2 and MAOB levels is also identified in human tumour samples. Importantly, the administration of recombinant STC2 to the culture media effectively suppresses MAOB expression as well as apoptosis, suggesting STC2 functions in an autocrine/paracrine manner. Taken together, our findings indicate that nutrient insufficiency induces STC2 expression, which in turn governs the adaptation of cancer cells to nutrient insufficiency through the maintenance of redox homoeostasis, highlighting the potential of STC2 as a therapeutic target for cancer treatment.


Conflict of interest statement

The authors declare no competing interests.

Figures
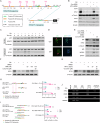
Fig. 1
Fig. 1. STC2 is upregulated under nutrient-insufficient conditions.
A The iDEP analysis was performed to compare the cDNA microarray data from cells cultured with Gln-/Glc- deprived media. A total of 5783 genes are upregulated/downregulated according to the criteria | log2(fold changes) | ≥ 1. B Circos plot shows the biological functions of the 58 most upregulated genes in cells exposed to nutrient insufficiency. STC2 is among the 58 most upregulated genes in MM01 cells and Gln-/Glc- deprived Hep3B cells. CE STC2 is induced in MM01 cells (C), Hep3B (D) and HeLa (E) cells cultured in Gln-free media. F STC2 mRNA is induced by Gln-deprivation in Hep3B and HeLa cells. Data are shown as the mean ± SD; **P < 0.01, n = 3. G, H STC2 is upregulated in human breast cancer cells when exposed to Gln-deprivation. I Glc-deprivation also upregulates STC2 in Hep3B, HeLa and MCF-7 cells. Note the loss of the high molecular weight band of STC2 in Glc-deprived cells (represents glycosylated STC2, unpublished data). JM Nutrient insufficiency upregulates intracellular STC2 and its secretion into culture media. Both Hep3B and HeLa cells were cultured in Gln-free (J, L) or Glc-free (K, M) media, and the cell lysate and culture media were collected and analysed by Western blots.
Fig. 2
Fig. 2. STC2 is transcriptionally upregulated by ATF4 and NF-κB.
A Bioinformatic analysis suggests the presence of putative ATF4, NF-κB and HRE binding sites in STC2 promoter. B ATF4 knockdown abolishes STC2 induction upon Gln-deprivation. ASNS was used as a positive control for ATF4. C p65/RelA is translocated into the nuclei in cells exposed to Gln-free media. D Immunofluorescent confocal microscopic photos show nuclear localisation of p65 post Gln-deprivation. E p65 knockdown or inhibition by curcumin effectively suppresses STC2 induction upon Gln-deprivation. VEGFA was used as a positive control for p65. F, G Curcumin effectively suppresses STC2 induction by the NF-κB signalling activators PMA (F) and TNF-α (G). H Luciferase reporter assays confirm the binding sites (located at nt[−337 ~ −329] and nt[−333 ~ −324] of STC2 promoter [NCBI Ref. #, NC_000005.10]) are required for STC2 induction by Gln-deprivation. I Mutation of either ATF4 or NF-κB binding sites impairs the response of STC2 promoter to Gln-deprivation. Data in (H, I) are shown as the mean ± SD; **P < 0.01, n = 3. J ChIP assays substantiate the direct binding of ATF4 or p65/RelA to the identified cis-elements on STC2 promoter. ASNS serves as a positive control for ATF4; IL-8 is used as a positive control for p65/RelA; GAPDH is used as a negative control.
Fig. 3
Fig. 3. STC2 is required for optimal cell proliferation in normal culture media but negatively regulates cell proliferation upon Gln-deprivation.
A, B STC2 is needed for optimal proliferation of Hep3B cells in regular media (A) but suppresses cell proliferation in Gln-free media (B). C, D STC2 is needed for optimal proliferation of HeLa cells in regular media (C) but suppresses cell proliferation in Gln-free media (D). EH Overexpression of STC2 has no apparent effects on the proliferation of Hep3B (E, F) and HeLa (G, H) cells. I, J Exogenous rSTC2 does not affect the proliferation of Hep3B (I) and HeLa (J) cells. All data are shown as the mean ± SD; **P < 0.01; NS, not significant, n = 3–6.
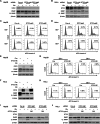
Fig. 4
Fig. 4. STC2 reduces apoptosis of cells under Gln-deprived conditions.
A, B STC2 knockdown leads to increased PARP cleavage in Hep3B (A) and HeLa (B) cells in Gln-deprived media. C, D Flow cytometry analyses show increased apoptosis of Hep3B (C) and HeLa (D) cells as assayed by Annexin V staining. E, F Overexpression of STC2 suppresses PARP cleavage in Hep3B (E) and HeLa (F) cells cultured with Gln-free media. G, H Flow cytometry analysis indicates overexpression of STC2 inhibits apoptosis of Hep3B (G) and HeLa (H) cells cultured in Gln-deprived media as measured by Annexin V staining. I, J rSTC2 effectively decreases STC2 knockdown-triggered PARP cleavage in Hep3B (I) and HeLa (J) cells cultured in Gln-free media.
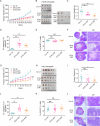
Fig. 5
Fig. 5. STC2 knockdown retards the growth of mouse xenografts.
A STC2 knockdown slows down the growth of Hep3B xenografts. B The photographs of Hep3B tumour xenografts shown in the same scale. C Loss of STC2 reduces the tumour weight of Hep3B xenografts. D STC2 knockdown causes increased apoptosis in Hep3B xenografts indicated by caspase-3 cleavage. E STC2 knockdown does not affect cell proliferation rates in Hep3B xenografts as detected by Ki-67 IHC staining. F Loss of STC2 leads to increased necrosis in Hep3B xenografts. Red arrow, necrotic area. G STC2 knockdown slows down the growth of HeLa xenografts. H The photographs of HeLa tumour xenografts. I Loss of STC2 reduces the tumour weight of HeLa xenografts. J STC2 knockdown causes increased apoptosis in HeLa xenografts indicated by caspase-3 cleavage. K STC2 knockdown does not affect cell proliferation rates in HeLa xenografts evaluated by Ki-67 IHC staining. L Loss of STC2 leads to increased necrosis in HeLa xenografts. Red arrow, necrotic area. The representative IHC staining results in (D, E, J, K) are put in Supplementary Fig. S9. All data are shown as the mean ± SD; *P < 0.05; **P < 0.01; NS, not significant; n = 10–12. Scale bar, 50 μm.
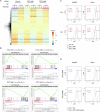
Fig. 6
Fig. 6. STC2 knockdown alters the expression signature of genes participating in redox homoeostasis and increases ROS levels in cells cultured in Gln-deprived media.
A iDEP analysis shows the RNA-Seq data in STC2 knockdown versus control cells. This analysis was performed to identify the altered signalling pathways in STC2 knockdown cells in Gln-free media. B GSEA analysis highlights the enrichment of genes related to redox homoeostasis in STC2 knockdown cells exposed to Gln-free media. C After dihydroethidium (DHE) staining, flow cytometry analyses were performed, and the results indicate that Gln-deprivation increases ROS levels in both Hep3B and HeLa cells and STC2 knockdown further increases ROS levels. Three biological replicates were performed, one representative result is shown. D rSTC2 treatment reduces ROS levels in Hep3B and HeLa cells in Gln-free media. The numbers in (C, D) indicate the percentage of cells with elevated ROS levels. Three biological replicates were analysed, one representative result is shown.
Fig. 7
Fig. 7. Loss of STC2 leads to MAOB dysregulation and redox imbalance when exposed to Gln-free media.
A, B ROS scavenger NAC decreases PARP cleavage in Hep3B (A) and HeLa (B) cells in Gln-free media. C Blue-Pink O’ Gram in the Space of the analysed Gene Set, the comparison of redox metabolic genes between STC2 knockdown and control cells cultured in Gln-free media. MAOB is one of the genes most significantly upregulated in STC2 knockdown cells. Detailed genes are listed in Supplementary Table 3. D qRT-PCR validates the upregulation of MAOB mRNA in STC2 knockdown Hep3B and HeLa cells cultured in Gln-free media. Data are shown as the mean ± SD; **P < 0.01; n = 3. E Western blot confirms that MAOB levels are higher in STC2 knockdown Hep3B and HeLa cells cultured in Gln-free media. F MAOB knockdown reduces PARP cleavage in STC2 knockdown Hep3B cells cultured in Gln-free media. G MAOB knockdown decreases ROS levels in STC2 knockdown Hep3B cells in Gln-free media. The numbers indicate the percentage of cells with elevated ROS levels. H MAOB knockdown prevents Gln-deprivation-triggered apoptosis of STC2 knockdown Hep3B cells. I MAOB knockdown rescues the proliferation of STC2 knockdown Hep3B cells cultured in Gln-free media. Data are shown as the mean ± SD; **P < 0.01; n = 4.
Fig. 8
Fig. 8. The expression levels of STC2 and MAOB are negatively correlated, and elevated STC2 is associated with tumour progression.
A Elevated MAOB levels are revealed in STC2 knockdown xenografts by IHC staining. Scale bar, 50 μm. B, C The xenografts from cells with STC2 knockdown show higher MAOB IHC staining score. All data are shown as the mean ± SD; *P < 0.05; **P < 0.01; n = 10–12. D The immunofluorescent staining indicates the reverse correlation between STC2 (green) and MAOB (red) expression in HCC specimens. Yellow line encircled area with low STC2 expression but high MAOB levels. Scale bar, 50 μm. E, F TMA IHC staining reveals a reverse correlation between STC2 and MAOB expression in HCC but not normal samples. G, H Elevated STC2 (G) and decreased MAOB (H) levels are detected in human HCC versus normal samples. **P < 0.01. I, J High STC2 expression is significantly correlated with poor prognosis in patients with HCC. K, L Schematic illustration of the proposed role of STC2 signalling in tumour cell adaptation to nutrient insufficiency. Under normal conditions, basal levels of STC2 perform its biological functions mainly by affecting intracellular targets, for example, maintaining Ca2+ homoeostasis to facilitate cell proliferation. Under nutrient-insufficient conditions, stress-triggered ATF4 and NF-κB activation upregulates STC2 expression. STC2 is secreted out of the cells to function in an autocrine/paracrine manner to prevent apoptosis through the alleviation of oxidative stress and to conserve nutrients by attenuating cell proliferation.

Update of

References

    1. Qie S, Liang D, Yin C, Gu W, Meng M, Wang C, et al. Glutamine depletion and glucose depletion trigger growth inhibition via distinctive gene expression reprogramming. Cell Cycle. 2012;11:3679–90. 10.4161/cc.21944 - DOI - PMC - PubMed
    1. Qie S, Chu C, Li W, Wang C, Sang N. ErbB2 activation upregulates glutaminase 1 expression which promotes breast cancer cell proliferation. J Cell Biochem. 2014;115:498–509. 10.1002/jcb.24684 - DOI - PMC - PubMed
    1. Qie S, Yoshida A, Parnham S, Oleinik N, Beeson GC, Beeson CC, et al. Targeting glutamine-addiction and overcoming CDK4/6 inhibitor resistance in human esophageal squamous cell carcinoma. Nat Commun. 2019;10:1296. 10.1038/s41467-019-09179-w - DOI - PMC - PubMed
    1. Qie S, Diehl JA. Glutamine addiction: an Achilles heel in esophageal cancers with dysregulation of CDK4/6. Mol Cell Oncol. 2019;6:1610257. 10.1080/23723556.2019.1610257 - DOI - PMC - PubMed
    1. Qie S, He D, Sang N. Overview of glutamine dependency and metabolic rescue protocols. Methods Mol Biol. 2019;1928:427–39. 10.1007/978-1-4939-9027-6_22 - DOI - PubMed

Substances

LinkOut - more resources