. 2024 Aug 6;14(1):18204.
doi: 10.1038/s41598-024-68952-0.

Rapid retinoic acid-induced trophoblast cell model from human induced pluripotent stem cells

Affiliations

Rapid retinoic acid-induced trophoblast cell model from human induced pluripotent stem cells

Kristen A Lemke et al. Sci Rep. .

Abstract

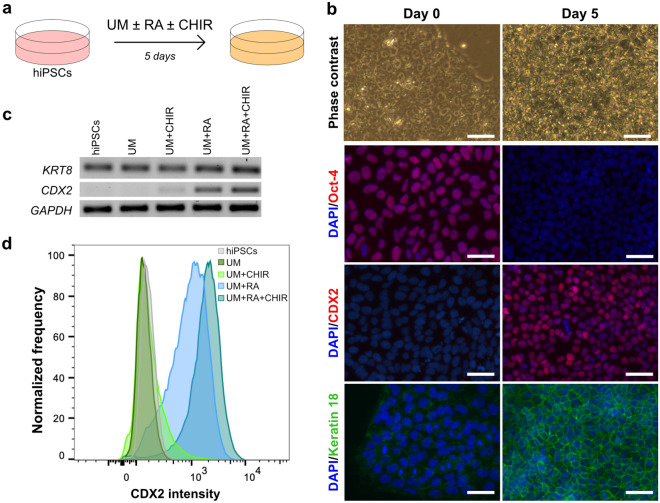
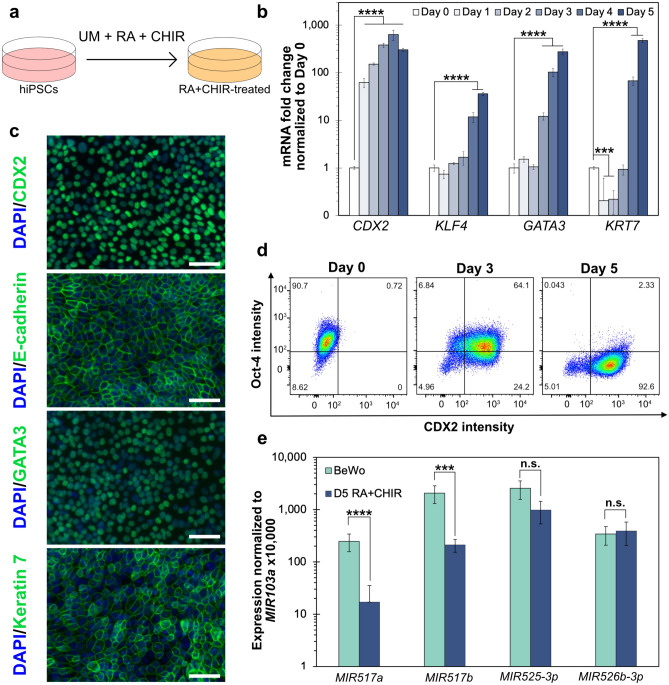
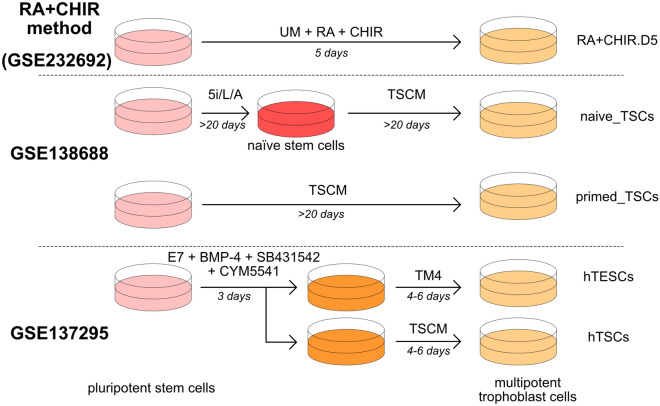
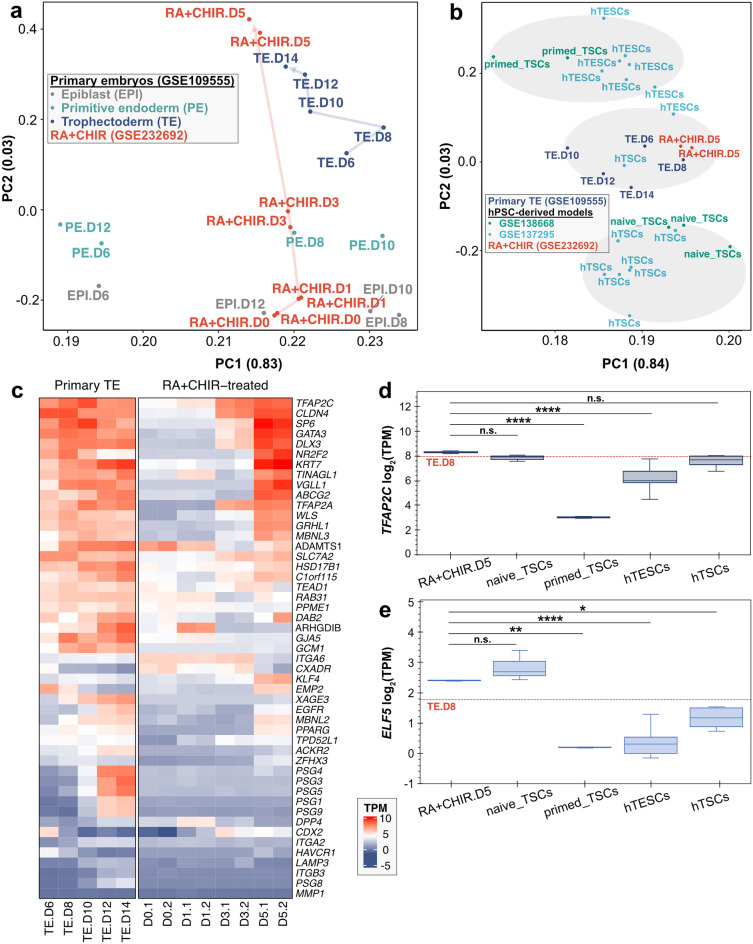
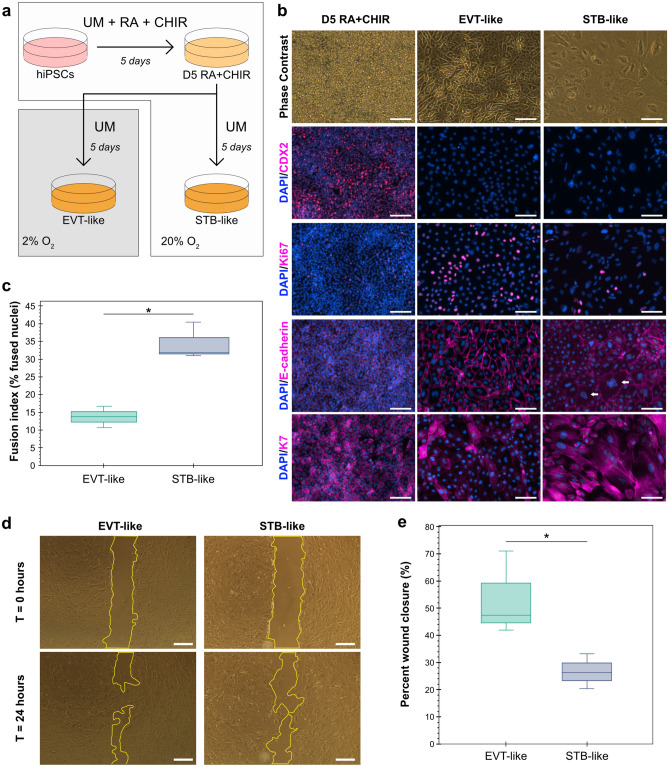
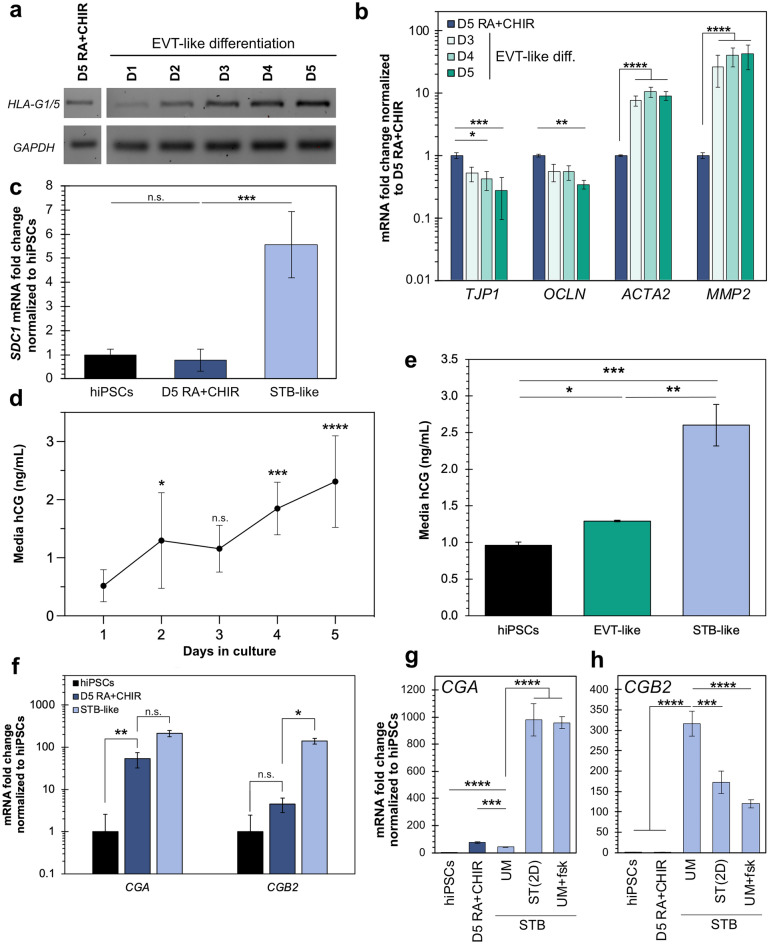
A limited number of accessible and representative models of human trophoblast cells currently exist for the study of placentation. Current stem cell models involve either a transition through a naïve stem cell state or precise dynamic control of multiple growth factors and small-molecule cues. Here, we demonstrated that a simple five-day treatment of human induced pluripotent stem cells with two small molecules, retinoic acid (RA) and Wnt agonist CHIR 99021 (CHIR), resulted in rapid, synergistic upregulation of CDX2. Transcriptomic analysis of RA + CHIR-treated cells showed high similarity to primary trophectoderm cells. Multipotency was verified via further differentiation towards cells with syncytiotrophoblast or extravillous trophoblast features. RA + CHIR-treated cells were also assessed for the established criteria defining a trophoblast cell model, and they possess all the features necessary to be considered valid. Collectively, our data demonstrate a facile, scalable method for generating functional trophoblast-like cells in vitro to better understand the placenta.


Conflict of interest statement

K.A.L., C.A.S., and S.M.A. have a patent pending for the methods described herein to establish the trophoblast model.

Figures

Figure 1
Figure 1
Treatment with both RA and CHIR results in consistent upregulation of CDX2. (a) Schematic diagram of differentiation. (b) Phase contrast and immunostaining images of cells before (Day 0) and following (Day 5) RA treatment. (c) RT-PCR of cells before treatment (hiPSCs) and cells treated for 5 days with conditions denoted above gel. GAPDH was used as a control. Original gel is presented in Fig. S4. (d) Representative flow cytometric histograms of CDX2 expression in cells before treatment (hiPSCs) or cells treated for 5 days with conditions denoted in legend. Scale bars are 50 μm.
Figure 2
Figure 2
RA and CHIR treatment induces expression of markers associated with trophoblast cell differentiation. (a) Schematic diagram of the differentiation. (b) qRT-PCR analysis during the differentiation in UM containing RA + CHIR. (c) Immunocytochemistry of cells treated for 5 days with UM containing RA + CHIR. (d) CDX2 and Oct-4 expression as determined by flow cytometry at the indicated timepoints during differentiation. Numeric values in each corner represent the percent of cells within each quadrant. (e) qRT-PCR analysis of C19 microRNAs during differentiation. Data are presented as mean ± SD of three independent replicates. Scale bars in images are 50 µm. n.s. = not significant, *p ≤ 0.05, **p ≤ 0.01, ***p ≤ 0.001, ****p ≤ 0.0001 based on ANOVA of three independent experimental replicates.
Figure 3
Figure 3
Methods, reagents, and nomenclature for alternative pluripotent stem cell differentiations to trophoblast cells. Schematic diagrams of differentiation methods and corresponding labels and GEO reference codes used for comparison in RNA-sequencing analysis. See Table S4 for media compositions.
Figure 4
Figure 4
Transcriptional analysis of RA + CHIR treated cells reveals similarity to primary trophectoderm cells and previously established trophoblast cell models. (a) PCA of transcript level data from primary human embryo cells (epiblast: EPI.D6-D12, primitive endoderm: PE.D6-D12, trophectoderm: TE.D6-D14) and cells treated with RA + CHIR (RA + CHIR.D0-D5). Arrows were added for clarity and do not indicate known trajectory. Fraction of variance captured by each PC is included in parentheses. (b) PCA of transcript level data from primary human trophectoderm cells (TE.D6-D14), RA + CHIR treated cells (RA + CHIR.D5), and two alternative hPSC-derived differentiations (hTSCs, hTESCs, naïve_TSCs, primed_TSCs). Shaded regions indicate distinct k-means clusters. (c) Heatmap of log2(TPM) expression of genes associated with trophectoderm development in primary trophectoderm (TE.D6-D14) and in cells treated with RA + CHIR (D0.1 and D0.2 represent day 0 replicates 1 and 2, respectively). Heatmap was generated using the ComplexHeatmap package (2.20.0, https://github.com/jokergoo/ComplexHeatmap/) available from Bioconductor. (d,e) Log2(TPM) expression of TFAP2C (d) and ELF5 (e) in RNA-sequencing samples. Red dashed lines indicate expression level in day 8 primary trophectoderm (TE.D8). Data are presented as boxplots of independent replicates shown where applicable. Significance is determined based on comparison to RA + CHIR.D5. n.s. = not significant, * p ≤ 0.05, ** p ≤ 0.01, *** p ≤ 0.001, **** p ≤ 0.0001 based on ANOVA of independent experimental replicates.
Figure 5
Figure 5
RA + CHIR-treated cells can be differentiated to EVT-like and STB-like cells. (a) Schematic diagram depicting the differentiation strategy. (b) Phase contrast and immunocytochemistry images after 5 days of differentiation in UM containing RA + CHIR (D5 RA + CHIR) or after subculture and an additional 5 days in UM with hypoxia (EVT-like) or normoxia (STB-like). Scale bar indicates 100 µm. White arrows denote sites of multinucleation. (c) Quantification of the fusion index in EVT-like and STB-like cells. (d) Phase contrast images immediately after scratch and 24 h after scratch in EVT-like and STB-like cells. Scale bar indicates 500 µm. Yellow outlines denote leading edge of cells. (e) Quantification of the percent of wound closure in EVT-like and STB-like cells. *p ≤ 0.05 based on t-test of three independent experimental replicates. Data are presented as mean ± SD of three independent experiments.
Figure 6
Figure 6
EVT-like and STB-like cells derived from day 5 RA + CHIR-treated cells show functional phenotypes. (a) RT-PCR of cells after 5 days of RA + CHIR or after sub-culture and maintenance in hypoxia for an additional 1, 2, 3, 4, or 5 days (D1-D5). Original gel is presented in Fig. S14. (b) qRT-PCR analysis of cells during days 3, 4, and 5 (D3-D5) in hypoxia treatment compared to day 5 RA + CHIR. (c) qRT-PCR analysis of SDC1 in hiPSCs, day 5 RA + CHIR cells, and STB-like cells normalized to hiPSCs. GAPDH was used as a reference gene. (d) hCG media concentration determined by ELISA on conditioned media from STB-like differentiated cells treated in normoxia for 1–5 days. Error bars indicate SEM of 3 independent replicates. Significance is determined based on comparison to day 1. (e) hCG concentration in media conditioned with hiPSCs, EVT-like cells, and STB-like cells. (f) qRT-PCR analysis of CGA and CGB2 in hiPSCs, day 5 RA + CHIR cells, and STB-like cells normalized to hiPSCs, GAPDH was used as a reference gene. (g,h) qRT-PCR analysis of CGA (g) and CGB2 (h) in hiPSCs, day 5 RA + CHIR cells, STB-like cells (UM), ST(2D)-treated cells, and UM + forskolin-treated (UM + fsk) cells. Transcript levels are shown relative to GAPDH expression and normalized to hiPSC expression. Data are presented as mean ± SD of three independent replicates unless otherwise specified. n.s. = not significant, *p ≤ 0.05, **p ≤ 0.01, ***p ≤ 0.001, ****p ≤ 0.0001 based on ANOVA of three independent experimental replicates.

Similar articles

References

    1. Latos, P. A. & Hemberger, M. From the stem of the placental tree: Trophoblast stem cells and their progeny. Dev. Camb.143, 3650–3660 (2016). - PubMed
    1. Knöfler, M. et al. Human placenta and trophoblast development: Key molecular mechanisms and model systems. Cell. Mol. Life Sci.76, 3479–3496 (2019). 10.1007/s00018-019-03104-6 - DOI - PMC - PubMed
    1. Okae, H. et al. Derivation of human trophoblast stem cells. Cell Stem Cell22, 50-63.e6 (2018). 10.1016/j.stem.2017.11.004 - DOI - PubMed
    1. Bilban, M. et al. Trophoblast invasion: Assessment of cellular models using gene expression signatures. Placenta31, 989–996 (2010). 10.1016/j.placenta.2010.08.011 - DOI - PubMed
    1. Tan, J. P., Liu, X. & Polo, J. M. Establishment of human induced trophoblast stem cells via reprogramming of fibroblasts. Nat. Protoc.17, 2739–2759 (2022). 10.1038/s41596-022-00742-2 - DOI - PubMed

MeSH terms