. 2024 Aug 6;25(1):210.
doi: 10.1186/s13059-024-03340-5.

Microsatellite instability at U2AF-binding polypyrimidic tract sites perturbs alternative splicing during colorectal cancer initiation

Affiliations

Microsatellite instability at U2AF-binding polypyrimidic tract sites perturbs alternative splicing during colorectal cancer initiation

Vincent Jonchère et al. Genome Biol. .

Abstract

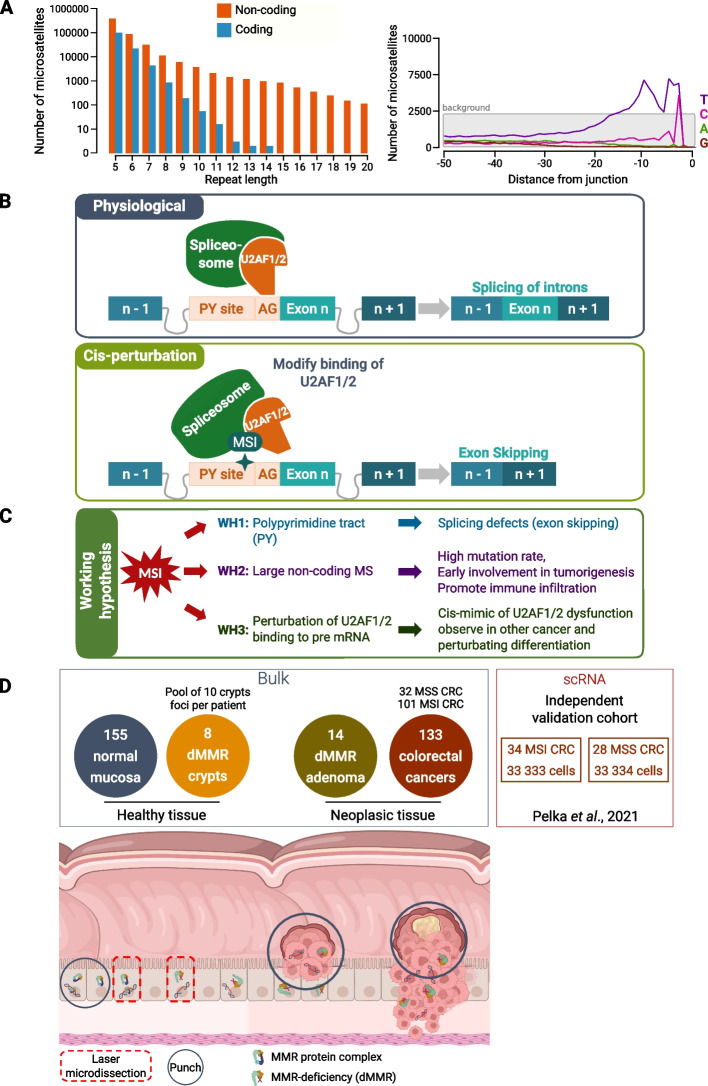
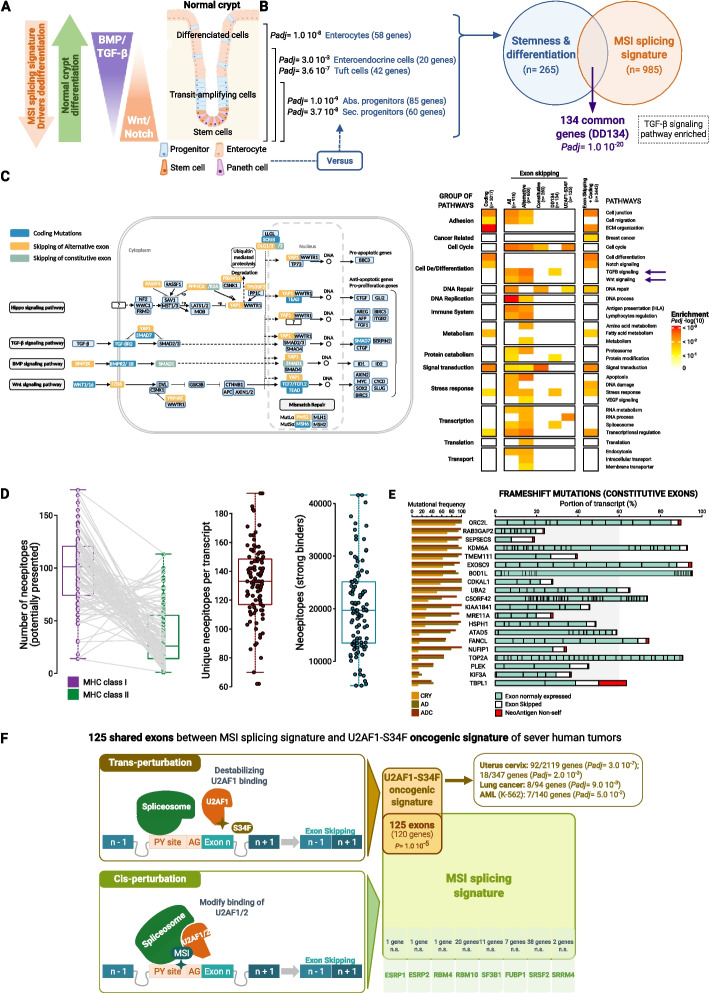
Background: Microsatellite instability (MSI) due to mismatch repair deficiency (dMMR) is common in colorectal cancer (CRC). These cancers are associated with somatic coding events, but the noncoding pathophysiological impact of this genomic instability is yet poorly understood. Here, we perform an analysis of coding and noncoding MSI events at the different steps of colorectal tumorigenesis using whole exome sequencing and search for associated splicing events via RNA sequencing at the bulk-tumor and single-cell levels.

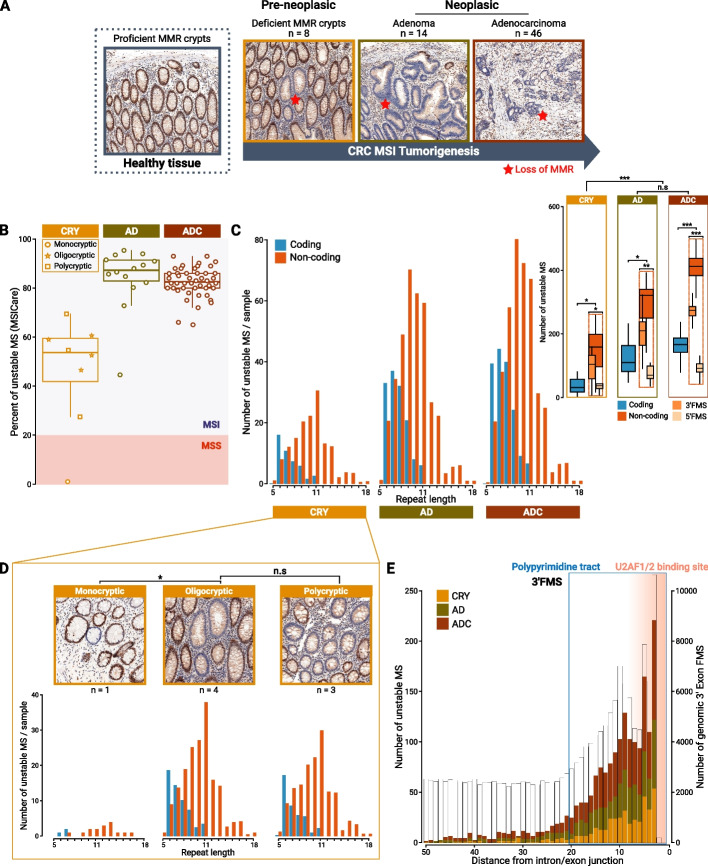
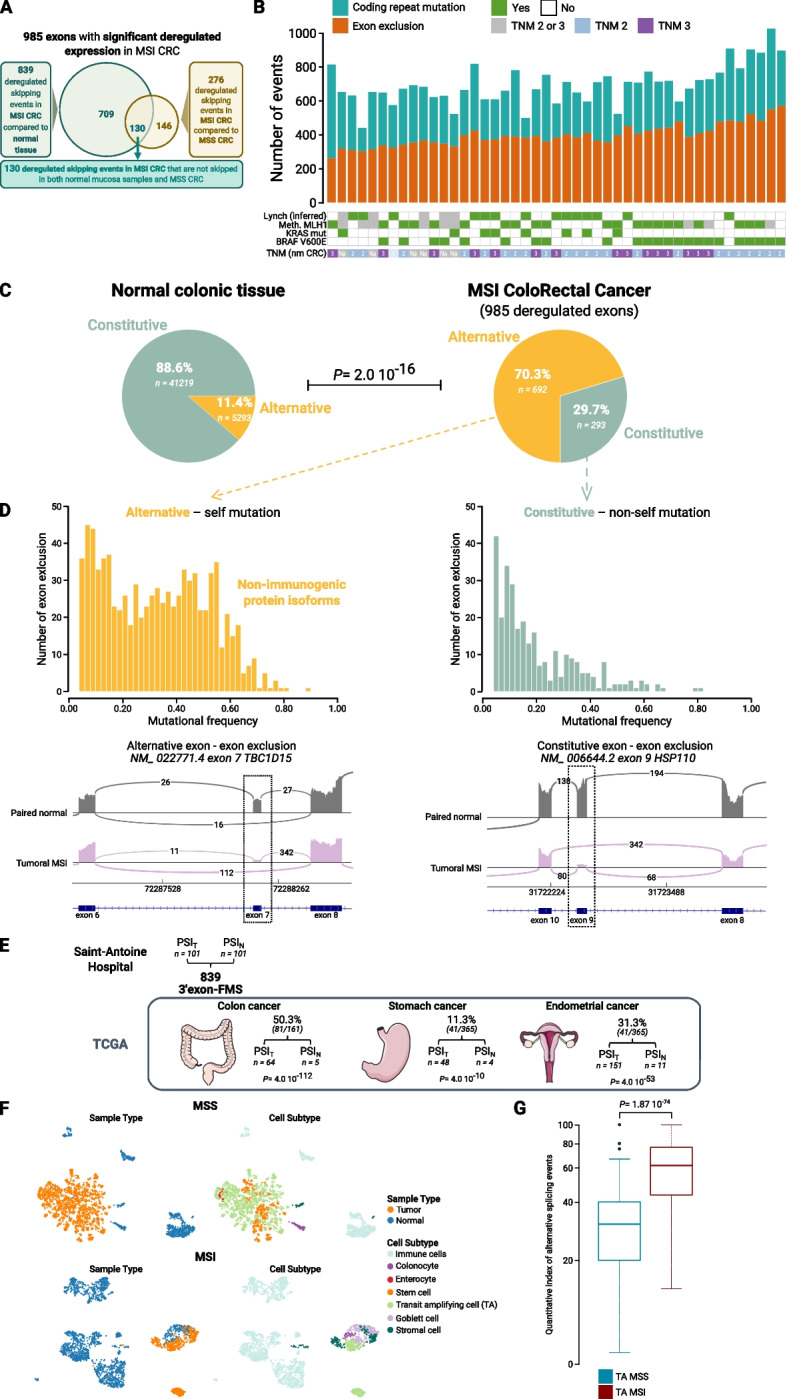
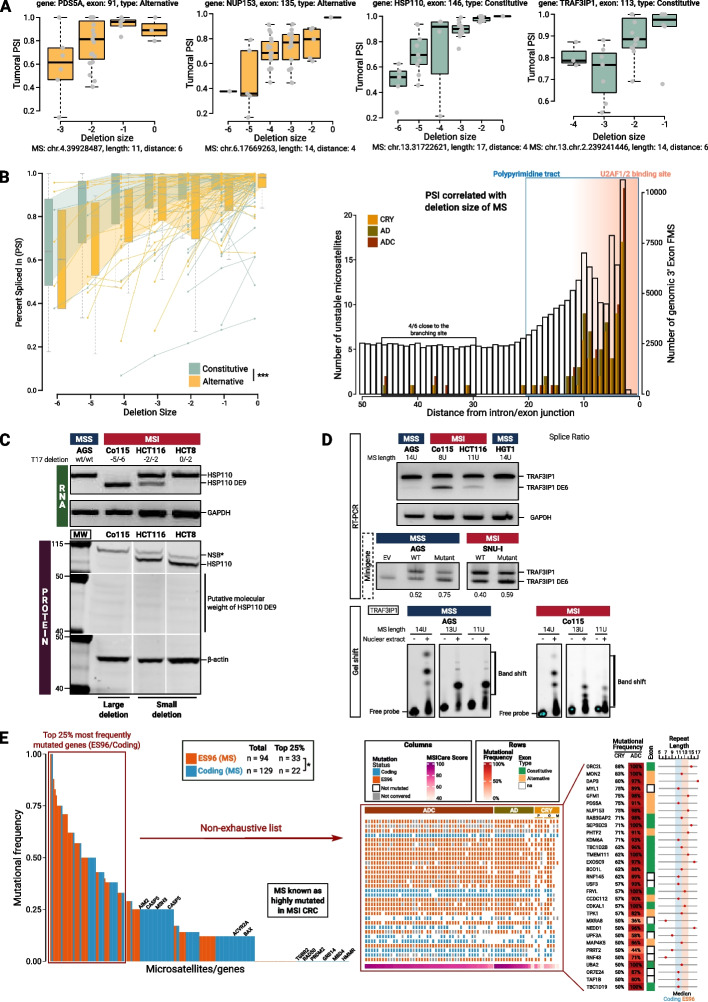
Results: Our results demonstrate that MSI leads to hundreds of noncoding DNA mutations, notably at polypyrimidine U2AF RNA-binding sites which are endowed with cis-activity in splicing, while higher frequency of exon skipping events are observed in the mRNAs of MSI compared to non-MSI CRC. At the DNA level, these noncoding MSI mutations occur very early prior to cell transformation in the dMMR colonic crypt, accounting for only a fraction of the exon skipping in MSI CRC. At the RNA level, the aberrant exon skipping signature is likely to impair colonic cell differentiation in MSI CRC affecting the expression of alternative exons encoding protein isoforms governing cell fate, while also targeting constitutive exons, making dMMR cells immunogenic in early stage before the onset of coding mutations. This signature is characterized by its similarity to the oncogenic U2AF1-S34F splicing mutation observed in several other non-MSI cancer.

Conclusions: Overall, these findings provide evidence that a very early RNA splicing signature partly driven by MSI impairs cell differentiation and promotes MSI CRC initiation, far before coding mutations which accumulate later during MSI tumorigenesis.

Keywords: Alternative splicing; Cancer initiation; Cell differentiation; Colonic crypt; Colorectal cancer; Microsatellite instability; Mismatch repair deficiency; Polypyrimidine U2AF binding site; Whole-exome and RNA sequencing.


Conflict of interest statement

PDLG and AJ (authors) declare a conflict of interest with the Genosplice company.

Figures

Fig. 1
Fig. 1
Frequently mutated intronic microsatellites may cause aberrant exon skipping in microsatellite instability (MSI) colorectal cancer (CRC). A Left panel, genomic distribution of microsatellite (MS) mutations (log10 scale) in two gene regions (exonic and intronic) according to repeat length. Right panel, distribution of all flanking MS (3′ splice acceptor site, 3′ FMS) according to their distance from the intron–exon boundary. The distribution of these MS signals is indicated according to their nucleotide composition (violet: thymine, pink: cytosine, green: adenosine, brown: guanine). The background corresponds to the distribution of all MS across the human genome. B Upper panel, schematic representation of physiological splicing. PY, polypyrimidine tract; AG, acceptor site. Lower panel, schematic representation of MSI cis-perturbations of splicing. C Working hypothesis (WH). D Experimental design to investigate splicing cis-perturbations in MSI CRC specimens
Fig. 2
Fig. 2
MSI-driven mutational events in non-coding regions lead mRNA changes which appear in the early stages of MSI tumorigenesis. A Histological description of MSI CRC tumorigenesis, from preneoplastic lesions (dMMR crypts) to neoplasms of different severity (adenoma and adenocarcinoma). Immunohistochemical staining of the MSH2 protein was performed. B The MSI status for each sample was defined by MSICare [27]. C Left panel, number of unstable MS by sample according to their length and considering their genomic position (coding or non-coding). C Right panel, boxplot representing the total number of unstable MS according to their region and condition. Statistics: Student’s t-test, *P-value < 0.05, **P-value < 1.10−3, ***P-value < 1.10−4, ****P-value < 1.10.−5. D Loss of MMR in the colonic crypt was categorized into three groups, depending on the number of dMMR crypts in the foci: monocryptic (1), oligocryptic (2–4), and polycryptic (> 4). In all the groups, crypts are identical and morphologically healthy, *P-value < 0.05. E Distribution of 3′ FMS according to the distance of the 3′ splice site (AG); the genomic background distribution of all flanking MS (n = 335,564) is indicated (phantom white bars)
Fig. 3
Fig. 3
MSI-driven mutational events in non-coding regions lead to the skipping of mainly alternatively regulated exons in MSI CRC. A Left panel, Venn diagram showing the overlap between exon skipping events in MSI CRC tissue compared to normal colonic tissue and to MSS CRC tissue. B Bar plot displaying the number of mutations in coding MS (expected frameshift mutations) and the number of skipped exons across the whole exome for 46 non-metastatic MSI tumors (TNM stage 2 or 3). C Left panel, pie chart representing the portion of alternative and constitutive exons in normal colorectal tissue (n = 57,030 exons, n = 133 normal tissue samples). Right panel, pie chart presenting the portion of the same alternative and constitutive exons whose expression was deregulated in MSI tumors. The results of the chi-square test between the two pie charts are indicated. D Distribution of exon skipping events according to their frequency in MSI tumors. Left and right panels, exons classified as constitutive (n = 293) or alternative (n = 692), respectively, in normal colonic tissue. Bottom panel, example of IGV-Sashimi plots showing the read coverage for 2 examples of significantly deregulated exons between tumors and normal tissue (right, constitutive and left, alternative). E Percentage overlap of MSI exon skipping between our study cohort and three independent TCGA cohorts. The number of overlapping events and total number of events analyzed are indicated in brackets. The P-values of the enrichments are indicated. F Cell distribution in MSS (Top panel) or in MSI (Bottom panel) according to sample status (tumor or normal tissue) (Left) and cell subset (Right). The total number of cells used was the same that in the Pelka et al. [26] study (n = 371,223) (more details in Fig. S5, also showing the distribution of the different cell types according to the MSI/MSS status of tumors). However, when we performed the splicing analysis, the total number of cells available was reduced to n = 128,370, but with the same distribution of cell types, i.e., no statistically significant difference was observed in the distribution of cell types in MSI/MSS tumor samples in the population and in the dataset with PSI data. The different number of cells were subsampled, and we performed a bootstrapping analysis (10,000 permutations), considering the same distribution of PSI values according to TA or colonocytes in MSS/MSI. In both situations, more than 100 cells in each condition, allowed to identify statistically significant differences. G Boxplot of quantitative index of alternative splicing events in transit amplifying cells (TA) according to MSI tumor status
Fig. 4
Fig. 4
Splicing anomalies found in MSI CRCs are frequently caused by MSI-related mutations that occur very early in cancer development, as early as the untransformed dMMR crypt state. A Four examples of genes in which exon skipping is closely related to the status of the DNA MS in the PY at the intronic boundary. B Left panel, boxplots representing the percent spliced included (PSI) values according to deletion size for the 96 MS (ES96). The results of two-sided ANOVA between exons classified as alternative and those classified as constitutive were as follows: ***P-value < .001. In the background, each MS displaying a significant correlation is indicated by a line and dots. Right panel, distribution of 96 MS (ES96) at the intronic boundary (50 to 0 of intron/exon junction), showing an enriched localization very close to the U2AF1/2 binding region in the PY (AG site). C In vitro analysis of HSP110 expression. Upper panel, the RT-PCR products of HSP110 show cDNA fragments with a completed or partial skipped exon (HSP110DE9), in mutated MSI cell lines with large deletion (CO115) and small deletion (HCT116) respectively. Bottom panel: western blotting analysis of HSP110wt and HSP110DE9 mutant proteins in the 3 cell lines (CO115, HCT116 and HCT8). NSB*, non-specific band; MW, molecular weight. Uncropped images are available in additional file 3. D In vitro analysis of TRAF3PIP1 gene. Upper panel, RT-PCR products of TRAF3IP1 showing cDNA fragments with a skipped exon (TRAF3IP1 DE6), in MSI cell lines (CO115 and HCT116). Middle panel, aberrant splicing event is also demonstrated by RT-PCR in endogenous and mutant (intronic MS mutation in the PY) TRAF3IP1 transcripts in both MSI and MSS transfected cells with minigene construction. EV, empty vector; WT, wild type; Splice Ratio = ratio of the intensity of the exon-lacking cDNA fragment to the intensity of the sum of exon-containing + exon lacking cDNA fragments. Lower panel, gel mobility shift assay. Nuclear protein extracts from MSS (left panel) and/or MSS (right panel) cells were incubated with TRAF3IP1 wild type or mutant labeled RNA probe. Shortened RNA probes do no longer allow the formation of large RNA/protein complexes. Uncropped images are available in Additional file 3. E Left panel, bar plots of microsatellites in the ES96 and C129 sub-signatures (consisting of coding MS covered in at least 50% of the samples and mutated in 30% of all lesions, n = 129) according to their mutational frequency in the early stage, i.e., dMMR crypts. The top 25% most frequently mutated MS (ES96/Coding) corresponded to MS in the first quartile when they were ranked by mutational frequency. Coding MS known to be highly mutated in MSI colorectal cancer are write in black. ES96 signature is significantly enriched in the top genes; *P-value < 1.10−2. Right panel, non-exhaustive list of the most frequently mutated MS (ES96/Coding) in the early stage of MSI CRC tumorigenesis (more details in Additional file 7: Table S6). MS are order by mutational frequency in dMMR crypts
Fig. 5
Fig. 5
Changes in mRNA impair cell differentiation and mimic oncogenic U2AF1 inactivation in MSI CRC. A Schematic representation of the normal colonic crypt. B A total of 134 genes that overlapped between our MSI splicing signature and that of Habowski et al. that regroups alternative mRNA changes that drive cell differentiation in the normal colonic crypt [19]. SC, stem cells; Abs., absorptive; Sec., secretory/deep crypt secretory cells/goblet; EEC, enteroendocrine; Ent, enterocytes, TuftC, tuft cells. The pathway analysis of the 134 genes shows a significative enrichment in TGF-beta signaling pathway (Padj = 0.032), BioPlanet 2019. C Left panel, heatmap displaying pathway analysis of coding mutations, exon skipping signature (All, Alternative, Constitutive, DD134, ES96), and of the exon skipping + coding mutations; colors represent enrich pathway Padj, -log10. Enrichment was realized with EnrichR BioPlanet 2019. Terms were sorted by Padj (< 0.05) and regroup first in pathways (rows, right) then in groups of pathways (rows, left). Columns were sorted by enriched condition parameters. A more detail heatmap showing the different terms is available in Fig. S12. Right panel, interactions between genes related to coding repeat mutations and/or genes with alterations in the splicing of genes involved in Hippo signaling pathways which play a role in CRC and in cell differentiation in the colonic crypt (adapted from KEGG: hsa04390). D Left panel, number of neoepitopes potentially represented by HLA-MHC class I or II for each patient (n = 101 CRC MSI). Middle panel, boxplot displaying the number of unique neoepitopes in average per transcript and per patient. Right panel, boxplot displaying the number of neoepitopes showing high affinity for HLA-MHC class I or II for each patient. E Constitutive exon skipping with a frameshift (ES96) exposing a neoantigen tail; genes were ordered by mutational frequency in the early stage. F Overlapping signature of 125 exons (120 genes) containing common exons between the U2AF-S34F signature and the MSI splicing signature

References

    1. Hanahan D, Weinberg RA. Hallmarks of cancer: the next generation. Cell. 2011;144:646–74. 10.1016/j.cell.2011.02.013 - DOI - PubMed
    1. Markowitz S, Wang J, Myeroff L, Parsons R, Sun L, Lutterbaugh J, Fan RS, Zborowska E, Kinzler KW, Vogelstein B, et al. Inactivation of the type II TGF-beta receptor in colon cancer cells with microsatellite instability. Science. 1995;268:1336–8. 10.1126/science.7761852 - DOI - PubMed
    1. Rampino N, Yamamoto H, Ionov Y, Li Y, Sawai H, Reed JC, Perucho M. Somatic frameshift mutations in the BAX gene in colon cancers of the microsatellite mutator phenotype. Science. 1997;275:967–9. 10.1126/science.275.5302.967 - DOI - PubMed
    1. Aaltonen LA, Peltomaki P, Leach FS, Sistonen P, Pylkkanen L, Mecklin JP, Jarvinen H, Powell SM, Jen J, Hamilton SR, et al. Clues to the pathogenesis of familial colorectal cancer. Science. 1993;260:812–6. 10.1126/science.8484121 - DOI - PubMed
    1. Branch P, Aquilina G, Bignami M, Karran P. Defective mismatch binding and a mutator phenotype in cells tolerant to DNA damage. Nature. 1993;362:652–4. 10.1038/362652a0 - DOI - PubMed

Substances

LinkOut - more resources