. 2024 Oct 15;22(4):qzae056.
doi: 10.1093/gpbjnl/qzae056.

Characterization of Cancer Stem Cells in Laryngeal Squamous Cell Carcinoma by Single-cell RNA Sequencing

Affiliations

Characterization of Cancer Stem Cells in Laryngeal Squamous Cell Carcinoma by Single-cell RNA Sequencing

Yanguo Li et al. Genomics Proteomics Bioinformatics. .

Abstract

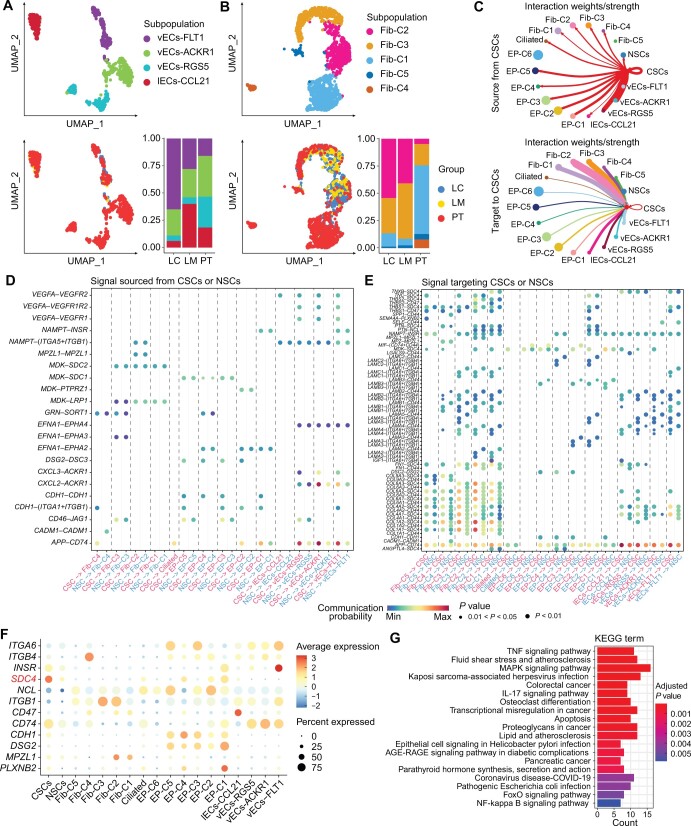
Cancer stem cells (CSCs) constitute a pivotal element within the tumor microenvironment (TME), driving the initiation and progression of cancer. However, the identification of CSCs and their underlying molecular mechanisms in laryngeal squamous cell carcinoma (LSCC) remains a formidable challenge. Here, we employed single-cell RNA sequencing of matched primary tumor tissues, paracancerous tissues, and local lymph nodes from three LSCC patients to comprehensively characterize the CSCs in LSCC. Two distinct clusters of stem cells originating from epithelial populations were delineated and verified as CSCs and normal stem cells (NSCs), respectively. CSCs were abundant in the paracancerous tissues compared to those in the tumor tissues. CSCs showed high expression of stem cell marker genes such as PROM1, ALDH1A1, and SOX4, and increased the activity of tumor-related hypoxia, Wnt/β-catenin, and Notch signaling pathways. We then explored the intricate crosstalk between CSCs and the TME cells and identified targets within the TME that related with CSCs. We also found eight marker genes of CSCs that were correlated significantly with the prognosis of LSCC patients. Furthermore, bioinformatics analyses showed that drugs such as erlotinib, OSI-027, and ibrutinib selectively targeted the CSC-specifically expressed genes. In conclusion, our results represent the first comprehensive characterization of CSC properties in LSCC at the single-cell level.

Keywords: Cancer stem cell; Cell–cell communication; Laryngeal squamous cell carcinoma; Single-cell RNA sequencing; Therapeutic target.


Conflict of interest statement

The authors have declared no competing interests.

Figures

Figure 1
Figure 1
Single-cell transcription profiles of matched tumor tissues, paracancerous tissues, and local lymph nodes from LSCC patients A. Overview of the experimental design. B. The t-SNE plots showing the categorization of 40,304 single cells into 8 major cell types. The cell types (left) and tissue types (right) are color-coded. C. Bar plot showing the proportion of different cell types in each sample, colored by the cell types. D. GO enrichment analysis based on the up-regulated genes in epithelial cells from LC compared to those from PT (adjusted P value < 0.01, log2 FC > 1). LSCC, laryngeal squamous cell carcinoma; B, B cell; pDC, plasmacytoid dendritic cell; T, T cell; LC, LSCC tissues; PT, paracancerous tissues; LM, local lymph nodes with tumor metastasis; t-SNE, t-distributed stochastic neighbor embedding; scRNA-seq, single-cell RNA sequencing; GO, Gene Ontology; FC, fold change.
Figure 2
Figure 2
Heterogeneity of epithelial cells and identification of SCs in LSCC A. UMAP plots showing the heterogeneity of epithelial cells across all the LSCC samples. The epithelial cells were assigned into eight subpopulations, including SC, EP-C1, EP-C2, EP-C3, EP-C4, EP-C5, EP-C6, and ciliated cells (left). The epithelial cell subpopulations (left) and groups (right) are color-coded. B. Estimation of the CNVs in the eight epithelial cell subpopulations based on inferCNV. Endothelial cells were used as reference cells. C. GSVA of the hallmark gene sets showing activities of different pathways in the eight epithelial cell subpopulations. D. Expression levels of EPCAM and SC marker genes in eight epithelial cell subpopulations. E. Immunohistochemical staining of PROM1 and FOLR1 in the paraffin-embedded LC and PT. The proteins detected by the corresponding antibodies are indicated on the left. Scale bar, 100 μm. F. Pseudotime trajectories showing the evolutionary process of epithelial subpopulations in LSCC. UMAP, Uniform Manifold Approximation and Projection; SC, stem cell; EP-C1/2/3/4/5/6, epithelial cell cluster 1/2/3/4/5/6; CNV, copy number variation; GSVA, gene set variation analysis.
Figure 3
Figure 3
Identification and characterization of CSCs in LSCC A. The t-SNE plots showing the distribution of two epithelial SC clusters in LSCC. B. Bar plot showing the absolute number of two SC subpopulations. Fisher’s exact test was used to assess the statistical significance between groups. C. Heatmap showing the expression levels of the marker genes in the two SC subpopulations (Table S3). D. GSVA of the hallmarker pathway activities between SC-C1 and SC-C2. E. Volcano plot showing the mean differences in the AUC scores for each regulon between the CSCs and NSCs. P values were calculated using Student’s t-test. F. Expression of CSC marker genes in an independent scRNA-seq dataset (GEO: GES206332). G. Re-clustering of cluster 21 from (F) revealed that CSC-like cells highly expressed PROM1 and were distributed across various tissue types. CSC, cancer stem cell; NSC, normal stem cell; AUC, area under the curve; SC-C1/2, stem cell cluster 1/2; GEO, Gene Expression Omnibus.
Figure 4
Figure 4
Clinical application of CSC signatures A. Point plot showing the fraction of marker genes detected in CSCs compared with all the other cell types. B. Confocal multiplex immunofluorescence images showing the expression levels of CK, PROM1, DMBT1, and FORL1 proteins in LC. Scale bars, 100 μm or 50 μm. C. Forest plot showing the hazard ratio of prognosis signatures in the model based on eight CSC marker genes. D. Kaplan–Meier survival curve showing the survival rates of the high-risk and low-risk groups of LSCC patients from TCGA based on the eight-gene prognosis signature. E. ROC curves showing the 1-, 3-, and 5-year overall survival of the LSCC patients as predicted by the risk score calculated using the eight-gene prognosis signature. F. Bar plot showing the GSVA scores for the CSC signatures in 116 LSCC samples from TCGA. G. Heatmap showing the expression pattern of query genes in Cancer Therapeutics Response Signatures. Genes with negative values were associated with drug sensitivity, whereas genes with positive values were associated with drug resistance. MOA refers to a specific biochemical interaction by which a drug produces pharmacological effects. CK, cytokeratin; ROC, receiver operating characteristic; TCGA, The Cancer Genome Atlas; MOA, mechanism of action; DAPI, 4′,6-diamidino-2-phenylindole.
Figure 5
Figure 5
Cell–cell communication between immune cells and CSCs A.–C. The t-SNE plots of seven T cell subpopulations (A), four myeloid cell subpopulations (B), and four B cell subpopulations (C) in all samples. The bar plot shows the proportions of various immune cell subpopulations in LC, LM, and PT. The cells are color-coded according to subpopulations (top) and tissues (bottom). D. and E. Dot plots illustrating the significant ligand–receptor pairs, with signals sourced from CSCs or NSCs targeting immune cells (D) and signals sourced from immune cells targeting CSCs or NSCs. Dot color represents the calculated communication probability; dot size represents the P values. F. NicheNet analysis showing the potential ligands expressed by immune cells that presumably affect the highly expressed genes in CSCs versus NSCs. Ligand activity indicates the ability of each ligand to predict the target genes. Ligands with better prediction are ranked higher. The regulatory potential score indicates the confidence that a particular ligand can regulate the expression of a particular target gene.
Figure 6
Figure 6
Intercellular communication between stromal cells and CSCs in LSCC A. and B. UMAP plots showing the four endothelial cell subpopulations (A) and five fibroblast subpopulations (B) across all the samples. The bar plot shows proportion of each subpopulation in different tissues. Various subpopulations (top) and tissues (bottom) are depicted by distinct colors. C. Circle plots showing signaling molecules from the CSCs that interact with stromal cells and the signaling molecules from stromal cells that interact with the CSCs. The edge width indicates strength of the communication. D. and E. Dot plots illustrating the significant ligand–receptor pairs, with signals sourced from CSCs or NSCs targeting stromal cells (D) and signals sourced from stromal cells targeting CSCs or NSCs (E). Dot color represents the calculated communication probability; dot size represents the P values. F. Dot plot showing the expression levels of key ligands or receptors in LSCC. G. KEGG pathway enrichment analysis results for the marker genes in the SDC4high CSCs. KEGG, Kyoto Encyclopedia of Genes and Genomes.

References

    1. Chu EA, Kim YJ.. Laryngeal cancer: diagnosis and preoperative work-up. Otolaryngol Clin North Am 2008;41:673–95. - PubMed
    1. Yu D, Jin C, Liu Y, Yang J, Zhao Y, Wang H, et al.Clinical implications of cancer stem cell-like side population cells in human laryngeal cancer. Tumour Biol 2013;34:3603–10. - PMC - PubMed
    1. Woodard TD, Oplatek A, Petruzzelli GJ.. Life after total laryngectomy: a measure of long-term survival, function, and quality of life. Arch Otolaryngol Head Neck Surg 2007;133:526–32. - PubMed
    1. Eun K, Ham SW, Kim H.. Cancer stem cell heterogeneity: origin and new perspectives on CSC targeting. BMB Rep 2017;50:117–25. - PMC - PubMed
    1. Greco A, Rizzo MI, De Virgilio A, Gallo A, Fusconi M, Pagliuca G, et al.Cancer stem cells in laryngeal cancer: what we know. Eur Arch Otorhinolaryngol 2016;273:3487–95. - PubMed

MeSH terms

Substances

LinkOut - more resources