. 2024 Aug;30(8):e14881.
doi: 10.1111/cns.14881.

S100A9 deletion in microglia/macrophages ameliorates brain injury through the STAT6/PPARγ pathway in ischemic stroke

Affiliations

S100A9 deletion in microglia/macrophages ameliorates brain injury through the STAT6/PPARγ pathway in ischemic stroke

Xi Liu et al. CNS Neurosci Ther. 2024 Aug.

Abstract

Background: Microglia and infiltrated macrophages (M/M) are integral components of the innate immune system that play a critical role in facilitating brain repair after ischemic stroke (IS) by clearing cell debris. Novel therapeutic strategies for IS therapy involve modulating M/M phenotype shifting. This study aims to elucidate the pivotal role of S100A9 in M/M and its downstream STAT6/PPARγ signaling pathway in neuroinflammation and phagocytosis after IS.

Methods: In the clinical study, we initially detected the expression pattern of S100A9 in monocytes from patients with acute IS and investigated its association with the long-term prognosis. In the in vivo study, we generated the S100A9 conditional knockout (CKO) mice and compared the stroke outcomes with the control group. We further tested the S100A9-specific inhibitor paqunimod (PQD), for its pharmaceutical effects on stroke outcomes. Transcriptomics and in vitro studies were adopted to explore the mechanism of S100A9 in modulating the M/M phenotype, which involves the regulation of the STAT6/PPARγ signaling pathway.

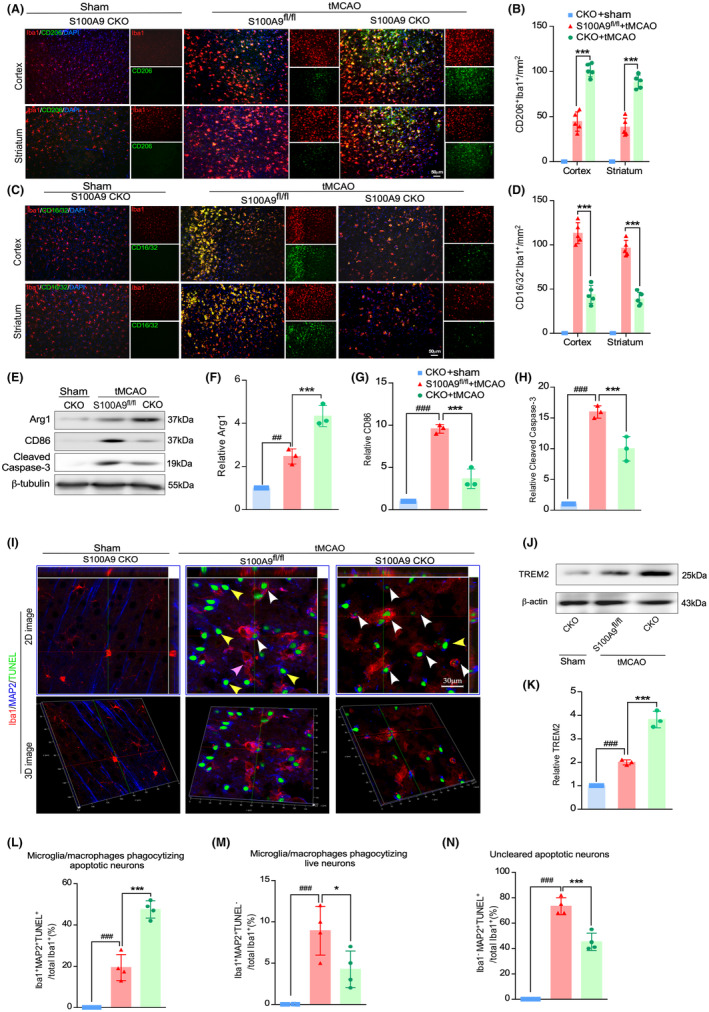
Results: S100A9 was predominantly expressed in classical monocytes and was correlated with unfavorable outcomes in patients of IS. S100A9 CKO mitigated infarction volume and white matter injury, enhanced cerebral blood flow and functional recovery, and prompted anti-inflammation phenotype and efferocytosis after tMCAO. The STAT6/PPARγ pathway, an essential signaling cascade involved in immune response and inflammation, might be the downstream target mediated by S100A9 deletion, as evidenced by the STAT6 phosphorylation inhibitor AS1517499 abolishing the beneficial effect of S100A9 inhibition in tMCAO mice and cell lines. Moreover, S100A9 inhibition by PQD treatment protected against neuronal death in vitro and brain injuries in vivo.

Conclusion: This study provides evidence for the first time that S100A9 in classical monocytes could potentially be a biomarker for predicting IS prognosis and reveals a novel therapeutic strategy for IS. By demonstrating that S100A9-mediated M/M polarization and phagocytosis can be reversed by S100A9 inhibition in a STAT6/PPARγ pathway-dependent manner, this study opens up new avenues for drug development in the field.

Keywords: S100A9; ischemic stroke; macrophage; microglia; neuroinflammation; phagocytosis.


Conflict of interest statement

The authors declare that they have no competing interests.

Figures

FIGURE 1
FIGURE 1
Intracellular S100A9 expression pattern in monocyte subpopulation and its correlation with clinical prognosis. (A) Flow cytometry images show the gating stratagem of monocyte subpopulations based on the expression of CD16 and CD14. The CD14++CD16classical monocyte was the primary source of intracellular S100A9. (B) Intracellular expression pattern of S100A9 in each monocyte subpopulation under healthy (upper panel) and IS (lower panel) conditions. (C) Quantification of S100A9‐positive cells in each subpopulation under healthy and IS conditions. The percentage of S100A9‐positive cells increased significantly in patients' CD14++CD16 classical monocyte subpopulation after a stroke. In contrast, the other monocyte subpopulations exhibited no significant change in S100A9 expression levels. **p < 0.01. (D) Quantifying the ratio of each subpopulation to total monocytes in healthy controls and IS patients. The CD14++CD16+ intermediate monocyte population increased after the stroke. *p < 0.05. (E) The modified Rankin Scale was used to determine the clinical progress of the patients at 90 days, with scores ranging from 0 to 6, with 0 indicating no symptoms, 1 indicating no clinically significant disability, 2 indicating slight disability, 3 indicating moderate disability, 4 indicating moderately severe disability, 5 indicating severe disability, and 6 indicating deaths. The numbers indicate the proportion of patients (%) per category.
FIGURE 2
FIGURE 2
S100A9 CKO improves cerebral blood flow, reduces infarct area, and improves neurologic outcome after tMCAO. (A) The schematic diagram illustrates the experimental procedure. (B) The cerebral blood flow after tMCAO was assessed at different time points in S100A9 CKO and control mice using Lasser sparkle contrast imaging, which was semi‐quantified by normalizing with contralateral blood flow (G). (C) The lesion area was evaluated by T2‐WI magnetic resonance imaging (MRI) at baseline and on days 3, 7, and 14 after tMCAO. Corrected infarct volume (H) and brain enlargement (I) were normalized to the contralateral hemisphere. (D) The injection of the Gd contrast agent was shown in a representative T1‐WI MRI before (top panel) and after (bottom panel) on day 3 after tMCAO. ΔΤ1‐map (lower panel) processed with ImageJ software was used to determine the BBB leakage area on each slide. S100A9 CKO mice exhibited significantly reduced leakage volume compared to the control group, **p < 0.01 (F). (E) Brain sections were stained with Luxol Fast blue to evaluate infarct volume in S100A9 CKO and control mice on days 7 and 14 after tMCAO. The infarct tissue unstained with Luxol fast blue is outlined by a black dashed line. (J) Infarct volume was quantified by normalizing to the contralateral hemisphere. *p < 0.05. (K) The neurologic deficits of S100A9 CKO and control mice were assessed at different time points after tMCAO using the mNSS scoring. *p < 0.05.
FIGURE 3
FIGURE 3
S100A9 CKO promotes M/M anti‐inflammatory polarization and augments efferocytosis after tMCAO. (A) The peri‐infarct area, comprising the cortex (upper panel) and striatum (lower panel) underwent co‐immunostaining with CD206 and Iba‐1. (B) The CD206+/Iba‐1+ ratio was quantified in the cortex and striatum of the S100A9 CKO and control groups. The CD206+/Iba‐1+ ratio increased significantly in the penumbra of S100A9 CKO mice. ***p < 0.01 (A) (C) Co‐immunostaining of CD16/32 and Iba‐1 in the cortex (upper panel) and the striatum (lower panel) in the peri‐infarct area. (B) Quantification of the CD16/32+/Iba‐1+ ratio in the cortex and striatum of the S100A9 CKO and control groups. The CD16/32+/Iba‐1+ ratio decreased significantly in the penumbra of S100A9 CKO mice. ***p < 0.01. (E) Immunoblots were conducted to detect Arg‐1, CD86, and cleaved caspase‐3 protein levels in brain tissue from the peri‐infarct area of each group. Protein expression levels were normalized to the internal control β‐tubulin. Quantification of protein expression of Arg‐1 (F), CD86 (G), and cleaved caspase‐3 (H). ### p < 0.001vs. sham, and ***p < 0.001vs. S100A9 CKO. (I) Immunofluorescence staining of MAP2, Iba‐1, and TUNEL in the peri‐infarct area of the different groups (2D image, upper panel). The successful efferocytosis (dying neurons taken up by M/M, indicated by white arrows) and mistaken efferocytosis (live neuron taken up by the M/M, indicated by yellow arrow) were confirmed by the 3D stack image (lower panel). Quantification of the successful efferocytosis ratio (L), mistaken phagocytosis ratio (M), and uncleared dying neuron ratio (N) ### p < 0.001. sham, *p < 0.05, ***p < 0.001vs. S100A9 CKO. (J) The phagocytosis marker TREM2 in the peri‐infarct region was detected by Western blotting, and protein expression levels were normalized to the internal control β‐tubulin. (K) Quantification of the relative expression of TREM2 in each group. ## p < 0.001. sham, **p < 0.01vs. S100A9 CKO.
FIGURE 4
FIGURE 4
S100A9 CKO protects against white matter lesions and cognitive impairment after tMCAO. (A) A brain slice scan to indicate ROI selection. (B) Co‐immunostaining of MAP2 and MBP in the cortex (right upper panel), callosum (right middle panel), and striatum (right lower panel) in the peri‐infarct area. The immunoactivity of the MAP2 (D) and MBP (E) clusters was normalized in the contralateral hemisphere and quantified in each group. (C) MBP expression in the infarcted hemisphere was detected by Western blotting. Protein expression in each group was quantified and normalized to that of the internal control β‐tubulin (F). (G) Fast blue staining of the axon density in the callosum, striatum, anterior commissure, and external capsule in each group. (H) The quantification of axon density was normalized to the contralateral hemisphere and expressed as the WML severity index. *p < 0.05, # p < 0.05, **p < 0.01, ### p < 0.001, ***p < 0.001. (I) Representative track plots (upper panel) and group heatmap (lower panel) of mice in each group in the Morris water maze test were analyzed. Escape latency (J), duration of the goal quadrant (K), and length of the swimming path (L) were quantified. *p < 0.05.
FIGURE 5
FIGURE 5
STAT6/PPARγ is involved in the protective effect of S100A9 CKO in tMCAO. (A) Immunofluorescence co‐staining of NeuN and TUNEL in the peri‐infarct area of S100A9 CKO mice treated with vehicle or AS was performed 3 and 7 days after tMCAO. (B) Quantification of NeuN+/TUNEL+ cells in the peri‐infarct area in each group. †† p < 0.01, ††† p < 0.01 vs. vehicle. (C) Immunofluorescence co‐staining and quantification (D) of CD206 and Iba‐1 in the cortex (upper panel) and striatum (lower panel) in vehicle‐ or AS‐treated S100A9 CKO mice on day 3 after tMCAO. (E) Immunofluorescence was co‐staining and quantification (F) of CD16/32 and Iba‐1 in the cortex and striatum in vehicle‐ or AS‐treated S100A9 CKO mice on day 3 after tMCAO. (G) Western blot detected Arg1, CD86, cleaved Caspase‐3, STAT6, and pSTAT6 in the infarcted brain hemisphere in vehicle‐ or AS‐treated CKO mice 3 days after tMCAO, protein expression levels were quantified in (H‐K). p < 0.05 vs. vehicle. (L) The expression of MBP and MAP2 in different areas of the brains of S100A9 CKO mice treated with vehicle or AS on day 21 after tMCAO was quantified (M,N). p < 0.05, p < 0.01 vs. vehicle. MBP expression (O) in the infarcted hemisphere and was quantified in (P). p < 0.05. (Q) Staining of MAP2, Iba‐1, and the cell death marker TUNEL in the peri‐infarct area of sham or tMCAO CKO mice (2D image, upper panel) and 3D stack image (lower panel). Dead neurons phagocytosed by M/M (white arrows) and live neurons phagocytosed by M/M (yellow arrows) were quantified as successful efferocytosis ratio (R), mistaken phagocytosis ratio (S), and unclear dying neuron ratio (T) p < 0.05, †† p < 0.01. (U) The expression of PPARγ in the infarcted hemisphere of CKO or control mice at 0, 1, 3, 5, 7, and 14 days after tMCAO was detected and quantified by WB and quantified in (V) **p < 0.05, ***p < 0. 001vs.S100A9fl/fl. (W) PPARγ expression in the infarcted hemisphere of sham, vehicle‐, or AS‐treated mouse brain hemispheres of CKO tMCAO CKO was detected by WB and quantified in (X). ††† p < 0.01 vs. CKO + vehicle, ### p < 0.01 vs. CKO sham.
FIGURE 6
FIGURE 6
Treatment with PQD mitigates brain lesions and improves neurologic function after tMCAO. (A) A schematic diagram depicting the experimental procedure and observation time points. (B) Cerebral blood flow was assessed using laser speckle contrast imaging at baseline and at different time points in wildtype mice that received vehicle or PQD after tMCAO. Semi‐quantification was performed by normalizing the results to the same region of interest (ROI) in the contralateral hemisphere (D). *p < 0.05. (C) Representative MRI T2‐WI was used to assess the lesion area of the mice that received vehicle or PQD at baseline and at different time points after tMCAO. The corrected infarct volume (E) and brain enlargement (F) were normalized to the contralateral hemisphere. *p < 0.05. (G) Neurologic deficits were evaluated by the modified neurologic severity score (mNSS) of the treatment groups at different time points after tMCAO. **p < 0.01. (H) Representative track plot (top) and group track heatmap (bottom) of mice in each group in the Morris water maze test. Escape latency (I), duration in the target quadrant (J), and length of the swimming path (K) were quantified. *p < 0.05 vs. vehicle. (L) Representative prints, timing view, and footfall pattern of each group. (M) Run the characterization parameters in each group. Difference in average speed and step sequence regularity index. ## p < 0.01 and ### p < 0.001 vs. sham, *p < 0.05 vs. tMCAO+PQD. (N) Run the locomotion parameters in each group. The difference in left hind swing speed left hind and left front limb stride length. ## p < 0.01 and ### p < 0.001 vs. sham, *p < 0.05 vs. tMCAO+PQD. (O) Run temporal parameters in each group. Difference in standing time of the left front and left hind limb. ## p < 0.01 and ### p < 0.001 vs. sham, *p < 0.05 vs. tMCAO+PQD.

References

    1. Fisher M, Savitz SI. Pharmacological brain cytoprotection in acute ischaemic stroke‐renewed hope in the reperfusion era. Nat Rev Neurol. 2022;18(4):193‐202. - PMC - PubMed
    1. Zhu L, Huang L, Le A, et al. Interactions between the autonomic nervous system and the immune system after stroke. Compr Physiol. 2022;12(3):3665‐3704. - PubMed
    1. Liu Y, Chen S, Liu S, et al. T‐cell receptor signaling modulated by the co‐receptors: potential targets for stroke treatment. Pharmacol Res. 2023;192:106797. - PubMed
    1. Ren H, Han R, Chen X, et al. Potential therapeutic targets for intracerebral hemorrhage‐associated inflammation: an update. J Cereb Blood Flow Metab. 2020;40(9):1752‐1768. - PMC - PubMed
    1. Doran AC. Inflammation resolution: implications for atherosclerosis. Circ Res. 2022;130(1):130‐148. - PMC - PubMed

Publication types

MeSH terms

LinkOut - more resources