

HIGD1B, as a novel prognostic biomarker, is involved in regulating the tumor microenvironment and immune cell infiltration; its overexpression leads to poor prognosis in gastric cancer patients
- PMID: 39108265
- PMCID: PMC11300267
- DOI: 10.3389/fimmu.2024.1415148
HIGD1B, as a novel prognostic biomarker, is involved in regulating the tumor microenvironment and immune cell infiltration; its overexpression leads to poor prognosis in gastric cancer patients
Abstract
Background: HIGD1B (HIG1 Hypoxia Inducible Domain Family Member 1B) is a protein-coding gene linked to the occurrence and progression of various illnesses. However, its precise function in gastric cancer (GC) remains unclear.
Methods: The expression of HIGD1B is determined through the TCGA and GEO databases and verified using experiments. The association between HIGD1B and GC patients' prognosis was analyzed via the Kaplan-Meier (K-M) curve. Subsequently, the researchers utilized ROC curves to assess the diagnostic capacity of HIGD1B and employed COX analysis to investigate risk factors for GC. The differentially expressed genes (DEGs) were then subjected to functional enrichment analysis, and a nomogram was generated to forecast the survival outcome and probability of GC patients. Additionally, we evaluated the interaction between HIGD1B and the immune cell infiltration and predicted the susceptibility of GC patients to therapy.
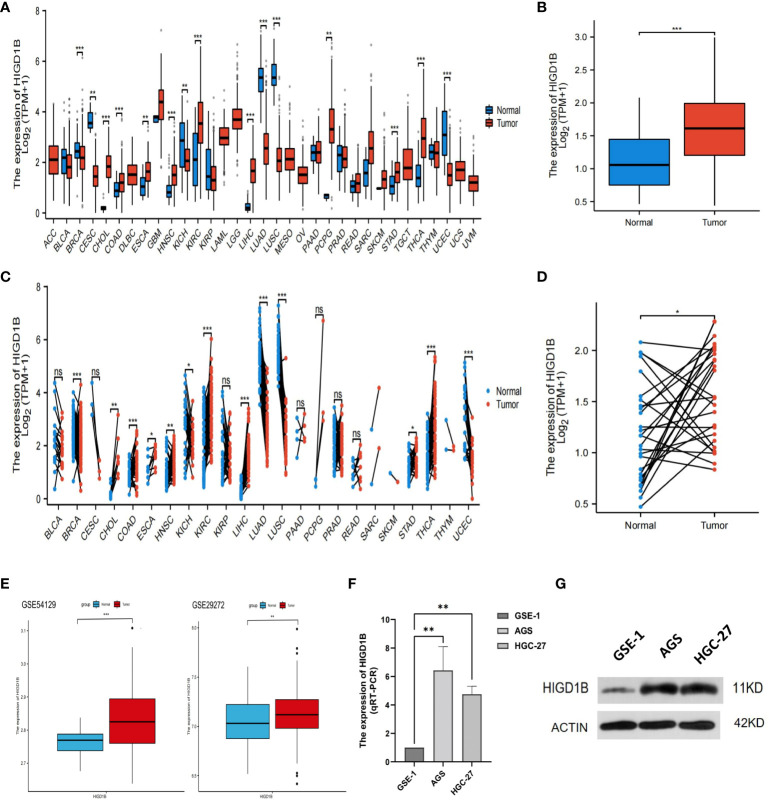
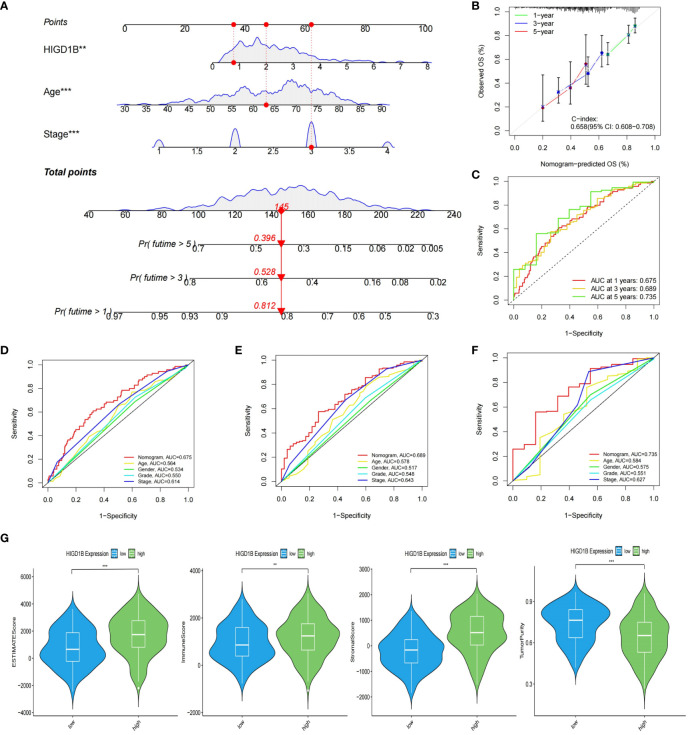
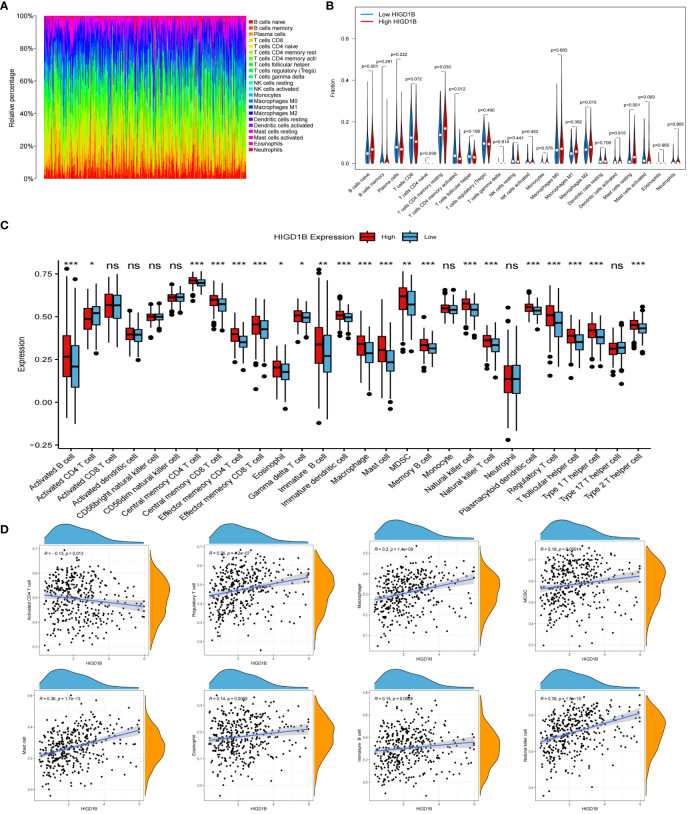
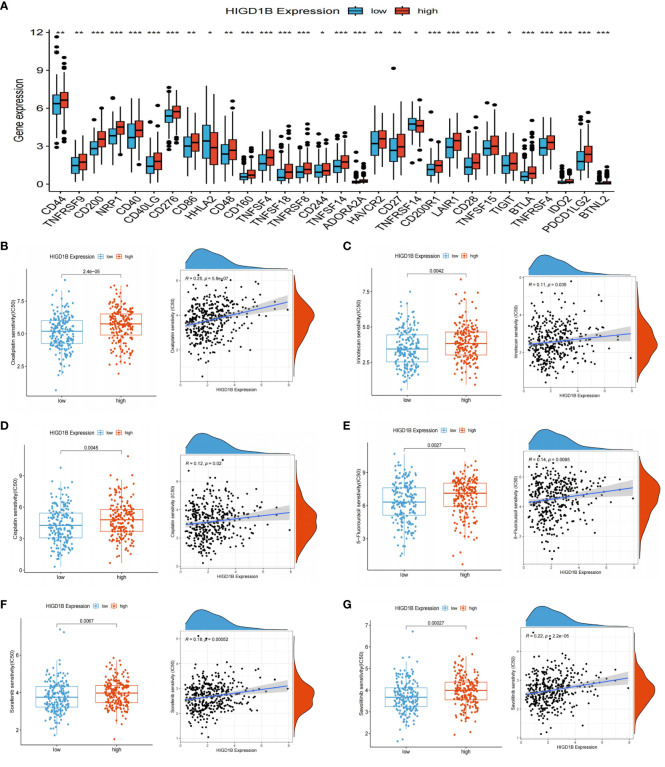
Results: HIGD1B is markedly elevated in GC tissue and cell lines, and patients with high HIGD1B expression have a poorer outcome. In addition, HIGD1B is related to distinct grades, stages, and T stages. The survival ROC curves of HIGD1B and nomogram for five years were 0.741 and 0.735, suggesting appropriate levels of diagnostic efficacy. According to Cox regression analysis, HIGD1B represents a separate risk factor for the prognosis of gastric cancer (p<0.01). GSEA analysis demonstrated that the HIGD1B is closely related to cancer formation and advanced pathways. Moreover, patients with high HIGD1B expression exhibited a higher level of Tumor-infiltration immune cells (TIICs) and were more likely to experience immune escape and drug resistance after chemotherapy and immunotherapy.
Conclusion: This study explored the potential mechanisms and diagnostic and prognostic utility of HIGD1B in GC, as well as identified HIGD1B as a valuable biomarker and possible therapeutic target for GC.
Keywords: HIGD1B; TME; gastric cancer; immune infiltration; immunotherapy; prognostic biomarker.
Copyright © 2024 Wang, Zhang, Li, Li, Zhao, Guo, Wang, Wang, Zhang and Qiu.
Conflict of interest statement
The authors declare that the research was conducted in the absence of any commercial or financial relationships that could be construed as a potential conflict of interest.
Figures


Similar articles
-
Construction of a prognostic model for gastric cancer based on immune infiltration and microenvironment, and exploration of MEF2C gene function.BMC Med Genomics. 2025 Jan 14;18(1):13. doi: 10.1186/s12920-024-02082-4. BMC Med Genomics. 2025. PMID: 39810215 Free PMC article.
-
Downregulation of HIGD1B induces mitochondria-mediated apoptosis in gastric cancer cells by inactivating Akt and ERK pathways.Drug Dev Res. 2024 Jun;85(4):e22221. doi: 10.1002/ddr.22221. Drug Dev Res. 2024. PMID: 38863387
-
Identification of a novel 10 immune-related genes signature as a prognostic biomarker panel for gastric cancer.Cancer Med. 2021 Sep;10(18):6546-6560. doi: 10.1002/cam4.4180. Epub 2021 Aug 12. Cancer Med. 2021. PMID: 34382341 Free PMC article.
-
[The phenomenon of tumor budding in gastric cancer].Arkh Patol. 2025;87(2):79-87. doi: 10.17116/patol20258702179. Arkh Patol. 2025. PMID: 40289438 Review. Russian.
-
The role of the tumor microenvironment and inflammatory pathways in driving drug resistance in gastric cancer: A systematic review and meta-analysis.Biochim Biophys Acta Mol Basis Dis. 2025 Aug;1871(6):167821. doi: 10.1016/j.bbadis.2025.167821. Epub 2025 Apr 7. Biochim Biophys Acta Mol Basis Dis. 2025. PMID: 40203956
Cited by
-
Differential Gene Expression Analysis in a Lumbar Spinal Stenosis Rat Model via RNA Sequencing: Identification of Key Molecular Pathways and Therapeutic Insights.Biomedicines. 2025 Jan 14;13(1):192. doi: 10.3390/biomedicines13010192. Biomedicines. 2025. PMID: 39857775 Free PMC article.
-
Overcoming immunotherapy resistance in gastric cancer: insights into mechanisms and emerging strategies.Cell Death Dis. 2025 Feb 7;16(1):75. doi: 10.1038/s41419-025-07385-7. Cell Death Dis. 2025. PMID: 39915459 Free PMC article. Review.
References
-
- Allemani C, Matsuda T, Di Carlo V, Harewood R, Matz M, Nikšić M, et al. . Global surveillance of trends in cancer survival 2000-14 (CONCORD-3): analysis of individual records for 37 513 025 patients diagnosed with one of 18 cancers from 322 population-based registries in 71 countries. Lancet. (2018) 391:1023–75. doi: 10.1016/S0140-6736(17)33326-3 - DOI - PMC - PubMed
MeSH terms
Substances
LinkOut - more resources
Full Text Sources
Medical
Molecular Biology Databases
Miscellaneous