[Preprint]. 2024 Jul 23:rs.3.rs-4746484.
doi: 10.21203/rs.3.rs-4746484/v1.

Maximizing the clinical utility and performance of cytology samples for comprehensive genetic profiling - A report on the impact of process optimization through the analysis of 4,871 cytology samples profiled by MSK-IMPACT

Affiliations

Maximizing the clinical utility and performance of cytology samples for comprehensive genetic profiling - A report on the impact of process optimization through the analysis of 4,871 cytology samples profiled by MSK-IMPACT

David Kim et al. Res Sq. .

Update in

Abstract

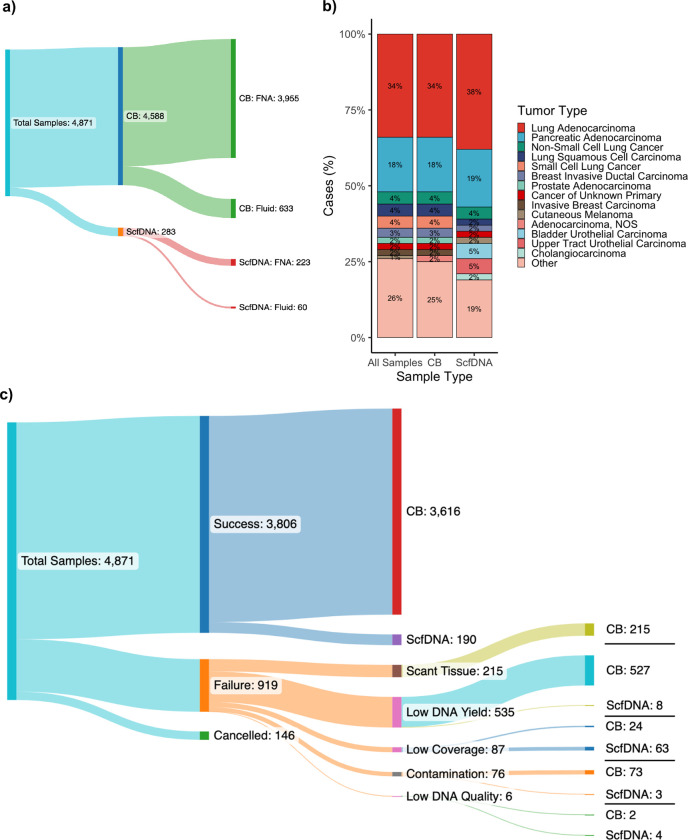
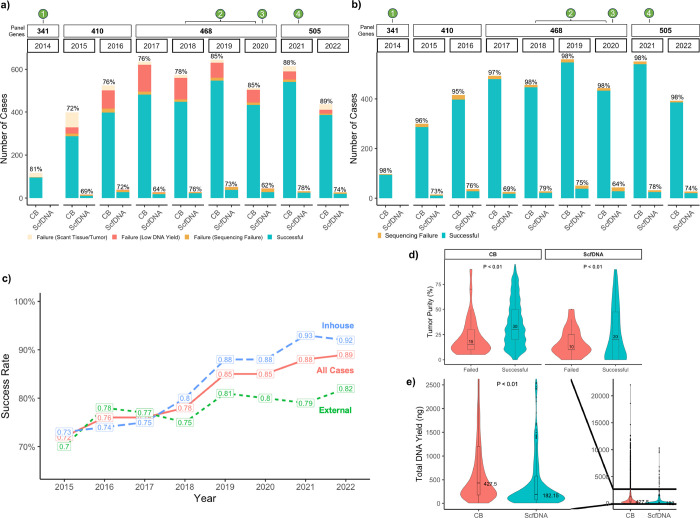
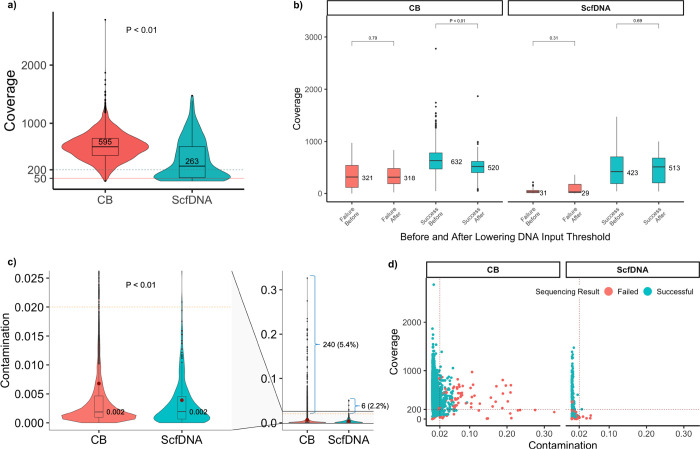
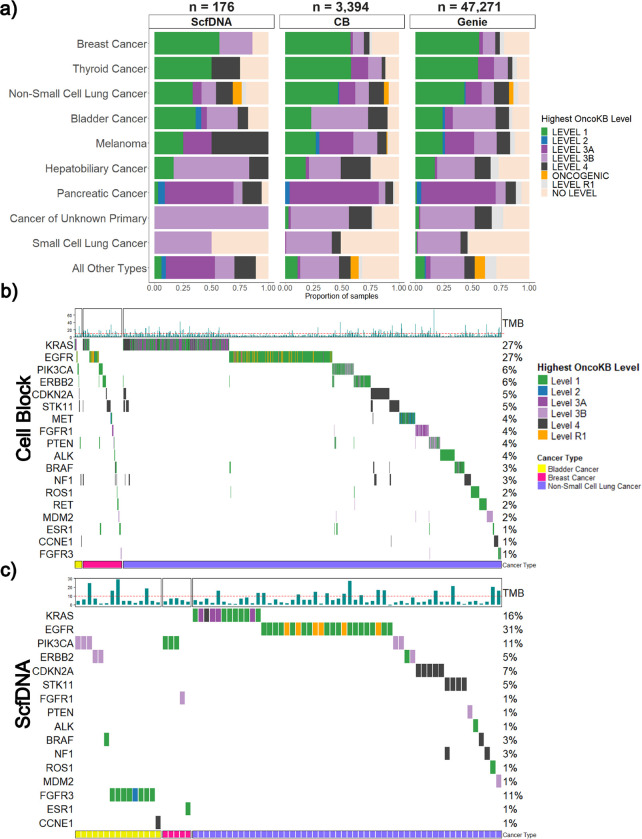
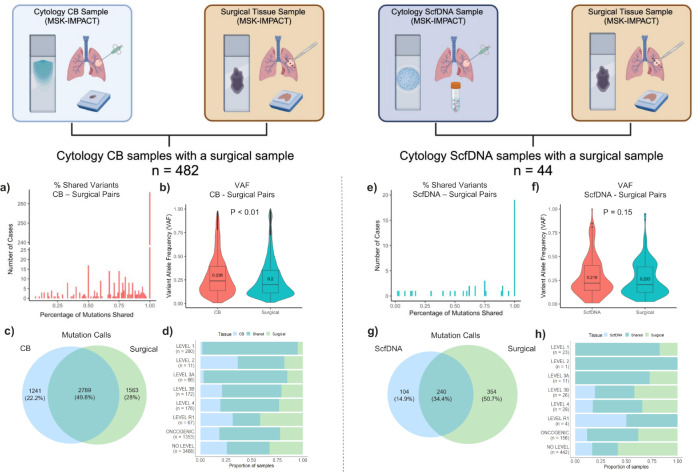
Comprehensive molecular profiling by next generation sequencing (NGS) has revolutionized tumor classification and biomarker evaluation. However, routine implementation is challenged by the scant nature of diagnostic material obtained through minimally invasive procedures. Here, we describe our long-term experience in profiling cytology samples with an in-depth assessment of the performance, quality metrics, biomarker identification capabilities, and potential pitfalls. We highlight the impact of several optimization strategies to maximize performance with 4,871 prospectively sequenced clinical cytology samples tested by MSK-IMPACT. Special emphasis is given to the use of residual supernatant cell free DNA (ScfDNA) as a valuable source of tumor DNA. Overall, cytology samples were similar in performance to surgical samples in identifying clinically relevant genomic alterations, achieving success rates up to 93% with full optimization. While cell block (CB) samples had excellent performance overall, low-level cross-contamination was identified in a small proportion of cases (4.7%), a common pitfall intrinsic to the processing of paraffin blocks, suggesting that more stringent precautions and processing modifications should be considered in quality control initiatives. By contrast ScfDNA samples had negligible contamination. Finally, ScfDNA testing exclusively used as a rescue strategy delivered successful results in 71% of cases where tumor tissue from CB was depleted.

Keywords: Cell-free DNA; Cytology; Molecular Cytology; Next-Generation Sequencing; Supernatant Fluid.


Figures

Figure 1
Figure 1. Overview of clinical cytology samples profiled by MSK-IMPACT
a The composition of the cytology cohort by sample preparation type, either cellblock (CB) or supernatant cfDNA (ScfDNA), and their respective collection method of either fine needle aspiration (FNA) or cytology fluid (e.g. pleural fluids, bronchial washes, ascites fluid, etc.). b The distribution of cancer types profiled by MSK-IMPACT clinically from cytology samples. The most common cancer types are at the top and are ordered in descending order for specific cancer types. Represented are all cytology samples and by sample type. c The distribution of testing outcome and sample type of cytology samples. In cytology cases that failed testing for MSK-IMPACT the cause of failure is further broken down with the corresponding number of sample type for each reason.
Figure 2
Figure 2. Determinants of successful mutational profiling by MSK-IMPACT in cytology samples
a Success rates of MSK-IMPACT testing on cytology samples by year and sample type. The colors denote successfully tested samples, samples failed due to scant/low tumor tissue, failed due to DNA content below sequencing thresholds, and all other failures (e.g. low DNA quality, contamination, etc.). Throughout the study period the panel genes increased in number and are denoted in the top bar by the number of panel genes included for that year. Various key optimization efforts for cytology samples were introduced in the clinical workflow at the corresponding timepoints including the use of a modified HistoGel cell-block preparation (1), improved bead-extraction procedures (2), dual-indexed libraries (3), and decreased lower DNA input for sequencing (4). b Success rates charted similar to that seen in (2a) but including only samples that were deemed to have adequate tumor for sequencing. The success rates therefore indicate the success rate of cytology sampled deemed to have adequate tumor on manual review as opposed to the overall testing success rate of a cytology sample received for testing. cOverall sequencing success rates on MSK-IMPACT for cytology samples charted by year and stratified by samples processed at an external laboratory (External), samples processed at the study institution (Inhouse), and all cytology cases (All Cases). Chi-squared test revealed a significant difference in the years 2019, 2021, and 2022 with a p value less than 0.01. d The distribution of tumor purity for cytology samples by outcome of MSK-IMPACT testing for CB (p = 0.00039) and ScfDNA (p = 0.63). e Comparisons of total extracted DNA yields for CB and ScfDNA cytology samples (p = 2.2 × 10⁻¹⁶). Group comparisons for continuous data (e,d) were performed with a two-tailed Mann-Whitney test set at a p < 0.01. All boxplots show the median (center line with value) and 25th and 75th percentiles (bounding box) along with the 1.5 interquartile range (whiskers).
Figure 3
Figure 3. Sequencing quality metrics of profiled cytology samples
a Sample coverage distribution by sequenced CB and ScfDNA cytology samples (p = 2.2 × 10⁻¹⁶). The p value was obtained by a two-sided Mann-Whitney test. The dashed horizontal line indicates the 200x coverage mark in which all samples tested by MSK-IMPACT are deemed to have low coverage with concerns for false negative assessment. The solid red line indicates the 50x mark for which all samples with lower coverage are highly considered to be failed due to low coverage. b The distribution of total sample coverage compared between samples before and after the decrease in DNA threshold for sequencing by MSK-IMPACT testing outcome. The sample coverage distributions were further stratified by cytology sample type. Comparisons of sample coverage before and after lowered DNA threshold for failed CB samples (p = 0.79), successful CB samples (p = 2.2 × 10⁻¹⁶), failed ScfDNA samples (p = 0.31), and successful ScfDNA samples (p = 0.69) were performed with a two-tailed Mann-Whitney test. c The distribution of non-patient DNA contamination rates and mean (red dot), as determined by comparing homozygous SNP sites between the sequenced tumor and matched patient normal sample, by sample type. The dashed horizontal line indicates a contamination rate of 0.02 for which samples with a higher rate are considered to have a concern for non-patient DNA contamination. The number and percentage of samples that exceed this threshold of 0.02 are shown adjacent to the representative bracket for each cytology sample type. d The distribution of contamination rates between cytology sample preparation method charted by sample coverage. Samples are colored based on sequencing result. The dashed vertical line indicates the threshold contamination rate of 0.02 and the dashed horizontal line denotes the threshold for adequate coverage (200x). Samples in the top-right quadrant indicate a high contamination rate in the face of adequate coverage, whereas samples in the bottom-right had low coverage that may falsely elevate the contamination rate. All boxplots show the median (center line with value) and 25th and 75th percentiles (bounding box) along with the 1.5 interquartile range (whiskers).
Figure 4
Figure 4. Comparison of mutation calls between cytology cellblock and supernatant cfDNA samples
a Comparative oncoprints of significant genomic alterations in three common tumor types profiled (bladder cancer, breast cancer, and non-small cell lung cancer) for samples with reported alterations identified from CB and ScfDNA samples. The significance of genomic alterations are color coded by corresponding OncoKB level. Sample level tumor mutational burden (TMB, mutations per megabase) is provided for each corresponding sample at the top. Comparative oncoprints of significant genomic alterations in three common tumor types profiled (bladder cancer, breast cancer, and non-small cell lung cancer) for samples with reported alterations identified from (b) CB and (c) ScfDNA samples. The significance of genomic alterations are color coded by corresponding OncoKB level. Sample level tumor mutational burden (TMB, mutations per megabase) is provided for each corresponding sample at the top with the horizontal dashed line indicating 10 mutations/megabase, for which sample with a higher number are TMB-High.
Figure 5
Figure 5. Comparison of mutation calls by MSK-IMPACT between matched cytology and surgical samples
Cytology samples with a corresponding surgical sample (e.g. core biopsy, resection, etc.) of the same patient tumor profiled by MSK-IMPACT (n = 526) for comparison were identified. A total of 482 cytology CB samples profiled by MSK-IMPACT had a corresponding surgical sample profiled by MSK-IMPACT. a The number of cases tallied by the proportion of genomic alterations identified on the surgical sample that was also identified on the corresponding cytology CB. b The distribution of variant allele frequency (VAF) of shared mutations identified on both cytology CB samples and corresponding surgical samples (p = 4.9 × 10⁻¹¹) of the same patient tumor. c Venn diagram representing the total mutation calls in cytology CB samples only, their corresponding surgical sample only, and those found in both. d The proportion of significant alterations identified in the cytology CB and corresponding pairs analyzed by if the mutation was identified exclusively in the cytology CB, corresponding surgical sample, or if it was seen in both (shared). The same analysis performed for ScfDNA samples (n = 44) with the proportion of genomic alterations identified (e), VAF distribution of shared alterations (f), venn diagram of mutation calls (g), and proportion of significant alterations identified by tissue sample and those seen in both (h).The p values were assessed as group comparisons for continuous data with a two-tailed Mann-Whitney test set at a p < 0.01. All boxplots show the median (center line) and 25th and 75th percentiles (bounding box) along with the 1.5 interquartile range (whiskers).

References

    1. Garraway LA (2013) Genomics-driven oncology: framework for an emerging paradigm. J Clin Oncol 31:1806–1814 - PubMed
    1. Wakai T et al. (2019) Next-generation sequencing-based clinical sequencing: toward precision medicine in solid tumors. Int J Clin Oncol 24:115–122 - PubMed
    1. Turner SR et al. (2018) Feasibility of endobronchial ultrasound transbronchial needle aspiration for massively parallel next-generation sequencing in thoracic cancer patients. Lung Cancer 119:85–90 - PMC - PubMed
    1. Ramani NS et al. (2021) Utilization of cytology smears improves success rates of RNA-based next-generation sequencing gene fusion assays for clinically relevant predictive biomarkers. Cancer Cytopathol 129:374–382 - PMC - PubMed
    1. Baum JE et al. (2017) Accuracy of next-generation sequencing for the identification of clinically relevant variants in cytology smears in lung adenocarcinoma. Cancer Cytopathol 125:398–406 - PubMed

Publication types

LinkOut - more resources