

This is a preprint.
The CentiMarker Project: Standardizing Quantitative Alzheimer's disease Fluid Biomarkers for Biologic Interpretation
- PMID: 39108526
- PMCID: PMC11302716
- DOI: 10.1101/2024.07.25.24311002
The CentiMarker Project: Standardizing Quantitative Alzheimer's disease Fluid Biomarkers for Biologic Interpretation
Update in
-
The CentiMarker project: Standardizing quantitative Alzheimer's disease fluid biomarkers for biologic interpretation.Alzheimers Dement. 2025 Apr;21(4):e14587. doi: 10.1002/alz.14587. Alzheimers Dement. 2025. PMID: 40235082 Free PMC article.
Abstract
Introduction: Biomarkers have been essential to understanding Alzheimer's disease (AD) pathogenesis, pathophysiology, progression, and treatment effects. However, each biomarker measure is a representation of the biological target, the assay used to measure it, and the variance of the assay. Thus, biomarker measures are difficult to compare without standardization, and the units and magnitude of effect relative to the disease are difficult to appreciate, even for experts. To facilitate quantitative comparisons of AD biomarkers in the context of biologic and treatment effects, we propose a biomarker standardization approach between normal ranges and maximum abnormal AD ranges, which we refer to as CentiMarker, similar to the Centiloid approach used in PET.
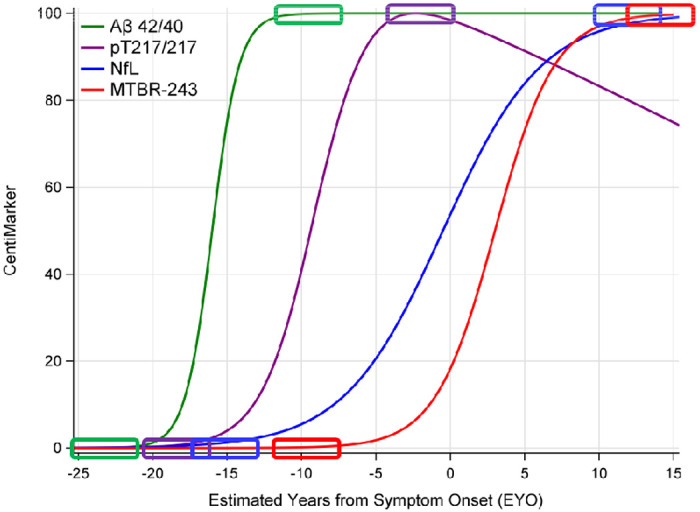
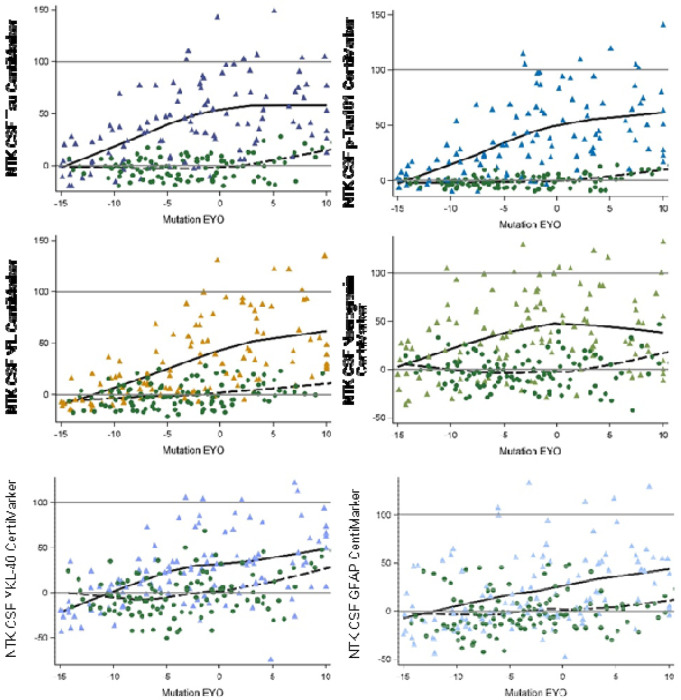
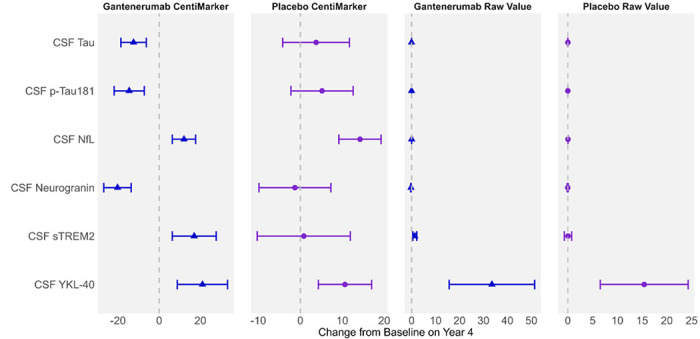
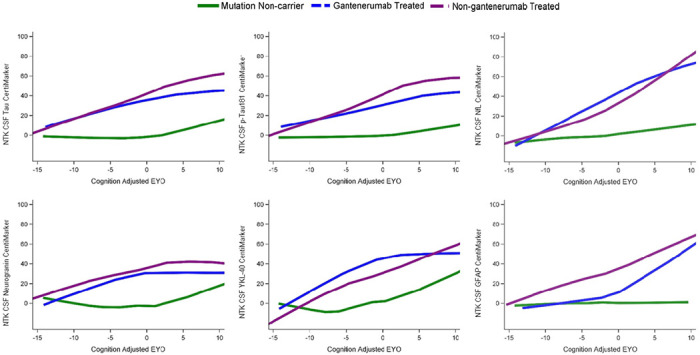
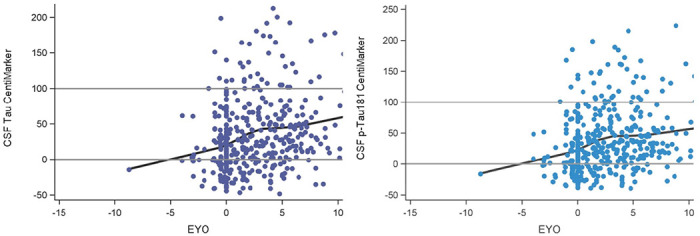
Methods: We developed a standardization scale that creates percentile values ranging from 0 for a normal population to 100 for the most abnormal measures across disease stages. We applied this scale to CSF and plasma biomarkers in autosomal dominant AD, assessing the distribution by estimated years from symptom onset, between biomarkers, and across cohorts. We then validated this approach in a large national sporadic AD cohort.
Results: We found the CentiMarker scale provided an easily interpretable metric of disease abnormality. The biologic changes, range, and distribution of several AD fluid biomarkers including amyloid-β, phospho-tau and other biomarkers, were comparable across disease stages in both early onset autosomal dominant and sporadic late onset AD.
Discussion: The CentiMarker scale offers a robust and versatile framework for the standardized biological comparison of AD biomarkers. Its broader adoption could facilitate biomarker reporting, allowing for more informed cross-study comparisons and contributing to accelerated therapeutic development.
Conflict of interest statement
All the other authors reported no conflicts of interest.
Figures
References
-
- Van Dyck CH, Swanson CJ, Aisen P, et al. Lecanemab in early Alzheimer’s disease. New England Journal of Medicine. 2023;388(1):9–21. - PubMed
-
- Wang G, Li Y, Xiong C, et al. Evaluation of dose-dependent treatment effects after mid-trial dose escalation in biomarker, clinical, and cognitive outcomes for gantenerumab or solanezumab in dominantly inherited Alzheimer’s disease. Alzheimer’s & Dementia: Diagnosis, Assessment & Disease Monitoring. 2022;14(1):e12367. - PMC - PubMed
-
- Kuhlmann J, Andreasson U, Pannee J, et al. CSF Aβ1–42–an excellent but complicated Alzheimer’s biomarker–a route to standardisation. Clinica Chimica Acta. 2017;467:27–33. - PubMed
Publication types
Grants and funding
LinkOut - more resources
Full Text Sources