. 2024 Jul 9;10(14):e34355.
doi: 10.1016/j.heliyon.2024.e34355. eCollection 2024 Jul 30.

Nicotinamide riboside first alleviates symptoms but later downregulates dopamine metabolism in proteasome inhibition mouse model of Parkinson's disease

Affiliations

Nicotinamide riboside first alleviates symptoms but later downregulates dopamine metabolism in proteasome inhibition mouse model of Parkinson's disease

Giorgio Turconi et al. Heliyon. .

Abstract

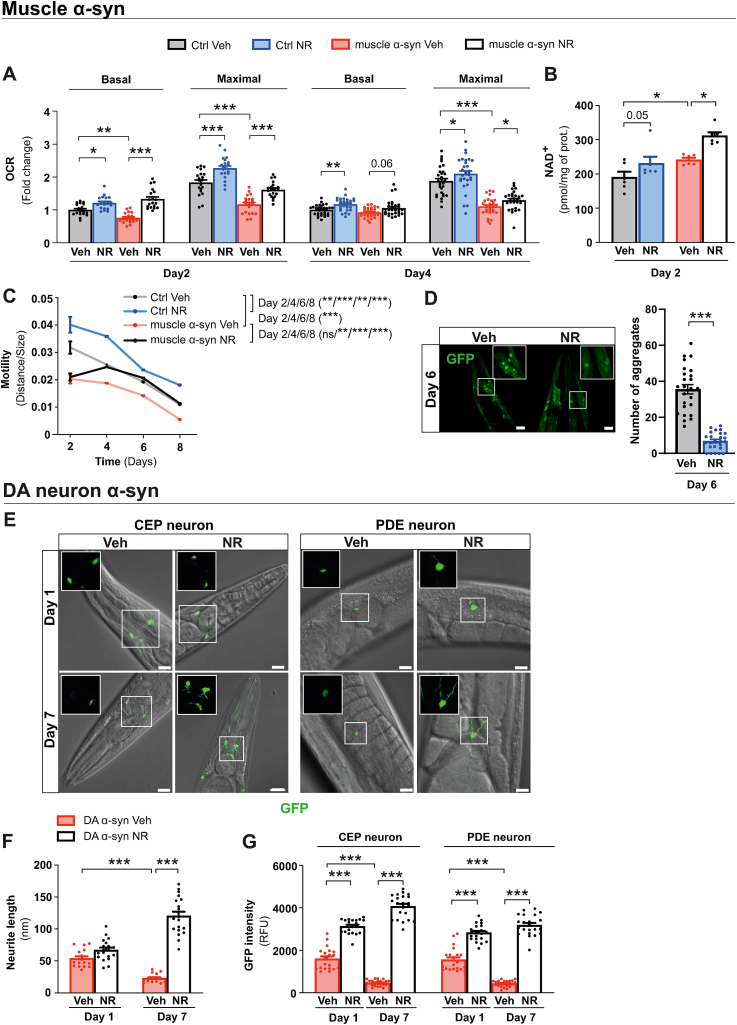
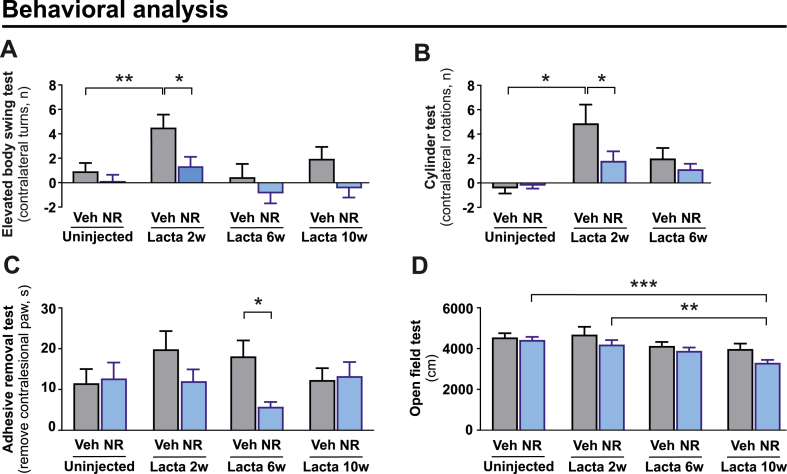
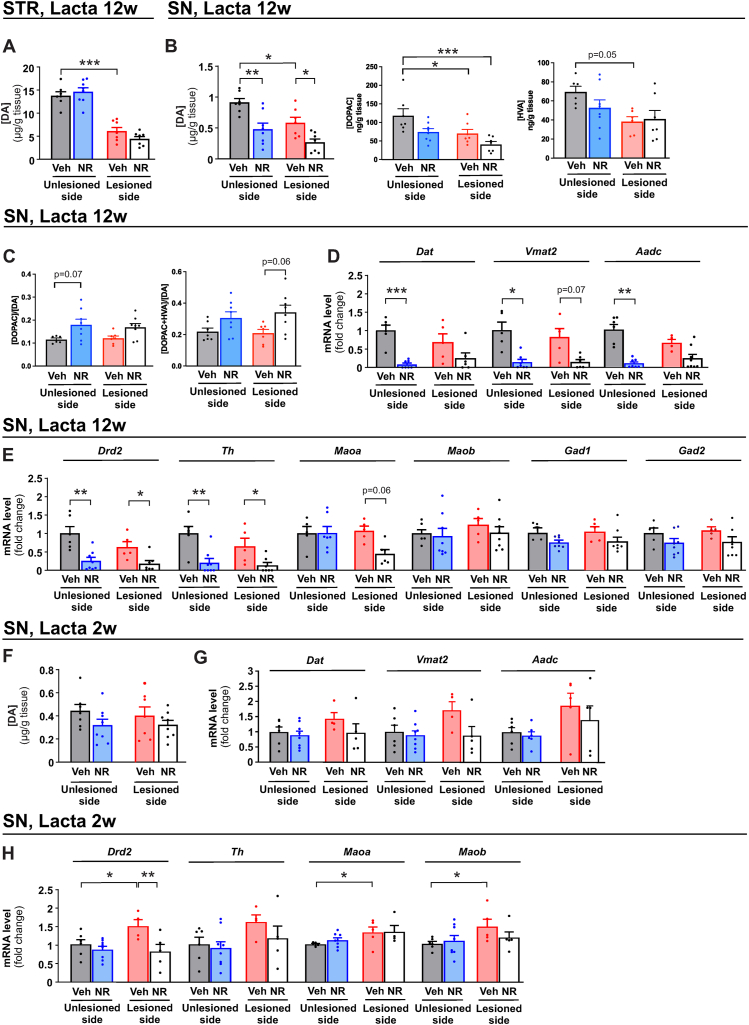
Parkinson's disease (PD) is associated with a reduction in 26/20S proteasome and mitochondrial function and depletion of dopamine. Activation of mitochondrial function with the NAD+ precursor nicotinamide riboside (NR) is a potential therapeutic for PD. However, despite recently started clinical trials, analysis of NR in mammalian animal PD models is lacking and data in simpler PD models is limited. We analyzed the effect of NR in C. elegans and in mouse 26/20S proteasome inhibition models of PD. In C. elegans, NR rescued α-synuclein overexpression induced phenotypes likely by activating the mitochondrial unfolded protein response. However, in a proteasome inhibitor-induced mouse model of PD, NR first partially rescued behavioural dysfunction, but later resulted in decrease in dopamine and its related gene expression in the substantia nigra. Our results suggest that reduction in 26/20S function with long term NR treatment may increase risk for developing reduced nigrostriatal DA function.

Keywords: Dopamine; Mitochondrial activation; Nicotinamide riboside; Parkinson's disease; Proteastasis failure.


Conflict of interest statement

The authors declare the following financial interests/personal relationships which may be considered as potential competing interests: Charles Brenner reports a relationship with ChromaDex Inc that includes: consulting or advisory and equity or stocks. Charles Brenner reports a relationship with Athena Therapeutics that includes: equity or stocks. Charles Brenner reports a relationship with Juvenis that includes: equity or stocks. Eija Pirinen reports a relationship with ChromaDex Inc that includes: speaking and lecture fees. If there are other authors, they declare that they have no known competing financial interests or personal relationships that could have appeared to influence the work reported in this paper.

Figures

Fig. 1
Fig. 1
NR alleviates PD-like phenotypes in ⍺-syn overexpressing C. elegans models. (A) Basal and maximal mitochondrial respiration after carbonyl cyanide-4-(trifluoromethoxy)phenylhydrazone (15 μM) injection measured in the control and muscle ⍺-syn strains after vehicle (Veh) or NR supplementation at days 2 and 4 of adult age. Each data point represents the mean of 2 independent experiments in total with 20 wells per group, with each group having 5 to 8 animals per well. (B) Total NAD+ levels in the vehicle and NR supplemented control and muscle ⍺-syn strains at day 2 of adult age measured by modified colorimetric enzymatic method (n = 6 biologically independent samples per group and two independent experiments). (C) Motility (distance travelled normalized to the size of the animals) in the control and muscle ⍺-syn strains with vehicle or NR supplementation at days 4, 6, and 8 of adult age. Each data point represents the mean of 2 independent experiments with 59–99 animals per group. (D) Confocal images (left) and quantification (right) of GFP-positive α-syn aggregates after vehicle or NR supplementation at day 6 of adult age in the C. elegans strain expressing human α-syn fused with GFP in body wall muscle cells. Scale bar, 20 μm. (E) Confocal images of CEP and PDE DA neurons and neurite extensions in the DA ⍺-syn strain after vehicle or NR supplementation at days 1 and 7 of adult age. Inserts show CEP and PDE neurites with 63X magnification. Scale bar, 5 μm. (F) Neurite length in the DA ⍺-syn strain after vehicle or NR supplementation at days 1 and 7 of adult age and (G) quantification of GFP signal intensity in CEP and PDE DA neurons in the DA ⍺-syn strain using ImageJ software (n = 20 to 23 biologically independent samples per group and two independent experiments), analyzed from the confocal images represented in panel (E) using ImageJ software (n = 16 to 19 biologically independent samples per group and two independent experiments). All data are mean ± SEM *P < 0.05; **P ≤ 0.01; ***P ≤ 0.001; ns, not significant. Statistical analysis was performed in GraphPad prism version 9.0.0. Overall differences between conditions were assessed in one-way ANOVA using an uncorrected version of Fisher's LSD test. OCR, oxygen consumption rate; GFP, green fluorescent protein; DA, dopamine; CEP, cephalic; PDE, posterior deirid. See also: Fig. S1. (For interpretation of the references to colour in this figure legend, the reader is referred to the Web version of this article.)
Fig. 2
Fig. 2
NR rescues behavioural deficits in LC-induced PD model but causes a mild and gradual decline in motor activity. (A) Effect of NR on the number of contralateral net turns during the elevated body swing test, measured at baseline (uninjected) and 2, 6, and 10 weeks after LC injection in vehicle and NR supplemented mice. (B) Effect of NR on the number of contralateral rotations during the cylinder test, measured at baseline (uninjected) as well as 2 and 6 weeks after LC injection in vehicle and NR supplemented mice. (C) Time required to remove the adhesive from the contralesional paw (time-to-remove—time-to-contact) during the adhesive removal test, measured at baseline (uninjected) and 2, 6, and 10 weeks after LC injection in vehicle and NR supplemented mice. (D) Effect of NR on the total distance travelled during the open field test, measured at baseline (uninjected) and 2, 6, and 10 weeks after LC injection in vehicle and NR supplemented mice. (A, C, D) Veh (n = 38) and NR (n = 38) before LC injection; Veh (n = 34) and NR (n = 38) after LC injection. (B) Veh (n = 18) and NR (n = 18). Data are presented as mean ± SEM. *P < 0.05, **P ≤ 0.01, ***P ≤ 0.001. Statistical analysis was performed in GraphPad prism version 8.0.2. Comparisons between more than two groups were performed with two-way repeated measures ANOVA followed by Sidak's multiple comparison test (A-D). Lacta, LC; NR, nicotinamide riboside; Veh, vehicle.
Fig. 3
Fig. 3
NR modulates mitochondrial dynamics. (A) Experimental design for the study in which mice receiving the vehicle diet (Veh) and NR-enriched diet (NR) were analyzed 2 weeks after nigral LC lesion. (B) Complex I [CI], (C) complex II [CII], and (D) Complex IV [CIV] mediated oxygen flux in SN tissues analyzed at the 2-week time point. Veh, unlesioned side (n = 7); NR, unlesioned side (n = 6); Veh, lesioned side (n = 7); NR, lesioned side (n = 6). (E) Representative transmission electron microscopy image and higher magnification inserts of the SN of vehicle and NR supplemented unlesioned and LC-lesioned mice. Mitochondria are highlighted with green colour. Scale bar, 2 μm. Corresponding quantification of (F) mitochondria intensity, mean mitochondrial cross-section (G) number, (H) area, (I) perimeter, and (J) length/width ratio expressed as eccentricity in vehicle and NR supplemented unlesioned and LC-lesioned mice. n = 3/group. Twenty non-overlapping images/sample were taken from each animal. (K-M) Oxygen flux data from (B-D) were normalized to the number of mitochondria from (G). Data are presented as mean ± SEM. *P < 0.05, **P ≤ 0.01, ***P ≤ 0.001. Statistical analysis was performed using GraphPad Prism version 8.0.2. Overall differences between conditions were assessed with one-way ANOVA followed by an uncorrected version of Fisher's LSD test. CI, complex I; CII, complex II; CIV, complex IV; Lacta, LC; NR, nicotinamide riboside; SN, SN; Veh, vehicle. (For interpretation of the references to colour in this figure legend, the reader is referred to the Web version of this article.)
Fig. 4
Fig. 4
Long-term NR treatment decreases DA levels and expression of DA related genes in the SN upon LC injection. Total tissue level of DA in (A) striatum and DA and metabolites DOPAC and HVA in (B) SN 12 weeks after LC injection. Veh, unlesioned side (n = 7); NR, unlesioned side (n = 8); Veh, lesioned side (n = 7); NR, lesioned side (n = 8). (C) Turnover rates of dopamine determined by tissue levels of metabolites DOPAC or DOPAC + HVA over tissue levels of dopamine. Gene expression of (D)Dat, Vmat2, and Aadc and (E)Drd2, Th, Maoa, Maob, Gad1, and Gad2 mRNA in the SN of vehicle and NR supplemented unlesioned and LC-lesioned mice 12 weeks after LC injection. Veh, unlesioned side (n = 6); NR, unlesioned side (n = 8); Veh, lesioned side (n = 6); NR, lesioned side (n = 8). (F) DA tissue level in the SN of vehicle and NR supplemented mice 2 weeks after LC injection. Veh, unlesioned side (n = 7); NR, unlesioned side (n = 8); Veh, lesioned side (n = 7); NR, lesioned side (n = 8). Gene expression of (G) Dat, Vmat2, and Aadc and (H) Drd2, Th, Maoa, and Maob in the SN of vehicle and NR supplemented mice 2 weeks after LC injection. Veh, unlesioned side (n = 6); NR, unlesioned side (n = 8); Veh, lesioned side (n = 5); NR, lesioned side (n = 5). Data are presented as mean ± SEM. *P < 0.05, **P ≤ 0.01, ***P ≤ 0.001. Statistical analysis was performed using GraphPad Prism version 8.0.2. Overall differences between conditions were assessed with one-way ANOVA followed by Tukey's post-hoc test for HPLC results or an uncorrected version of Fisher's LSD test or with uncorrected Dunn's test for qPCR results. Aadc, Aromatic l-amino acid decarboxylase; DA, dopamine; Dat, dopamine active transporter; DOPAC, 3,4-dihydroxyphenylacetic acid; Drd2, dopamine receptor 2; HVA, homovanillic acid; Lacta, LC; Maoa monoamine oxidase A; Maob, monoamine oxidase; NR, nicotinamide riboside; SN, SN; STR, striatum; Th, tyrosine hydroxylase; Veh, vehicle; Vmat2, vesicular monoamine transporter 2.

References

    1. DeMaagd G., Philip A. Parkinson's disease and its management: Part 1: disease entity, risk factors, pathophysiology, clinical presentation, and diagnosis. P T. 2015;40:504–532. - PMC - PubMed
    1. Dauer W., Przedborski S. Parkinson's disease: mechanisms and models. Neuron. 2003;39:889–909. doi: 10.1016/s0896-6273(03)00568-3. - DOI - PubMed
    1. Kish S.J., Shannak K., Hornykiewicz O. Uneven pattern of dopamine loss in the striatum of patients with idiopathic Parkinson's disease. Pathophysiologic and clinical implications. N. Engl. J. Med. 1988;318:876–880. doi: 10.1056/NEJM198804073181402. - DOI - PubMed
    1. Damier P., Hirsch E.C., Agid Y., Graybiel A.M. The substantia nigra of the human brain. II. Patterns of loss of dopamine-containing neurons in Parkinson's disease. Brain. 1999;122(Pt 8):1437–1448. doi: 10.1093/brain/122.8.1437. - DOI - PubMed
    1. Moehle E.A., Shen K., Dillin A. Mitochondrial proteostasis in the context of cellular and organismal health and aging. J. Biol. Chem. 2019;294:5396–5407. doi: 10.1074/jbc.TM117.000893. - DOI - PMC - PubMed

LinkOut - more resources