Observational Study
. 2025 Jan 21;110(2):317-333.
doi: 10.1210/clinem/dgae545.

Insulin Sensitivity and Insulin Secretion in Adults With Friedreich's Ataxia: The Role of Skeletal Muscle

Affiliations
Observational Study

Insulin Sensitivity and Insulin Secretion in Adults With Friedreich's Ataxia: The Role of Skeletal Muscle

Jaclyn Tamaroff et al. J Clin Endocrinol Metab. .

Abstract

Introduction: Friedreich's ataxia (FRDA) is a multisystem disorder caused by frataxin deficiency. FRDA-related diabetes mellitus (DM) is common. Frataxin supports skeletal muscle mitochondrial oxidative phosphorylation (OXPHOS) capacity, a mediator of insulin sensitivity. Our objective was to test the association between skeletal muscle health and insulin sensitivity and secretion in adults with FRDA without DM.

Methods: Case-control study (NCT02920671). Glucose and insulin metabolism (stable-isotope oral glucose tolerance tests), body composition (dual-energy x-ray absorptiometry), physical activity (self-report), and skeletal muscle OXPHOS capacity (creatine chemical exchange saturation transfer magnetic resonance imaging) were assessed.

Results: Participants included 11 individuals with FRDA (4 female), median age 27 years (interquartile range 23, 39), body mass index 26.9 kg/m2 (24.1, 29.4), and 24 controls (11 female), 29 years (26, 39), 24.4 kg/m2 (21.8, 27.0). Fasting glucose was higher in FRDA [91 vs 83 mg/dL (5.0 vs 4.6 mmol/L), P < .05]. Individuals with FRDA had lower insulin sensitivity (whole-body insulin sensitivity index 2.8 vs 5.3, P < .01), higher postprandial insulin secretion (insulin secretory rate incremental area under the curve 30-180 minutes, 24 652 vs 17,858, P < .05), and more suppressed postprandial endogenous glucose production (-.9% vs 26.9% of fasting endogenous glucose production, P < .05). In regression analyses, lower OXPHOS and inactivity explained some of the difference in insulin sensitivity. More visceral fat contributed to lower insulin sensitivity independent of FRDA. Insulin secretion accounting for sensitivity (disposition index) was not different.

Conclusion: Lower mitochondrial OXPHOS capacity, inactivity, and visceral adiposity contribute to lower insulin sensitivity in FRDA. Higher insulin secretion appears compensatory and, when inadequate, could herald DM. Further studies are needed to determine if muscle- or adipose-focused interventions could delay FRDA-related DM.

Keywords: Friedreich's ataxia; insulin secretion; insulin sensitivity; mitochondria; physical activity; skeletal muscle.


Figures

Figure 1.
Figure 1.
Overview of study participants. Overall, 11 participants with FRDA and 24 healthy controls were evaluated. One control participant was excluded due to significant elevation in labs related to muscle (aspartate aminotransferase and creatine kinase); this individual disclosed that in contradiction to guidance, he had engaged in significant heavy exercise the day prior to the study visit. Of note, individuals with other forms of primary mitochondrial disease were eligible for the parent protocol but not included in this FRDA-specific analysis. Abbreviation: FRDA, Friedreich's ataxia.
Figure 2.
Figure 2.
Study design. Overview of study procedures completed over a 2-day in-person study visit at the Hospital of the University of Pennsylvania.
Figure 3.
Figure 3.
Tracer-enhanced OGTT. Participants underwent stable-isotope tracer-enhanced OGTT following standardized meal and overnight fast (Fig. 2). Samples at each time point included: glucose, lactate, free fatty acids, insulin, C-peptide, 1-13C glucose. Abbreviation: OGTT, oral glucose tolerance test.
Figure 4.
Figure 4.
OGTT: glucose, lactate, free fatty acids. Concentrations of the following during OGTT are shown: (A) glucose, (B) 2,2-2H2 glucose, (C) lactate, (D) free fatty acids, stratified by disease status. Data are presented as mean and SEM. Individuals with Friedreich's ataxia (n = 11; 10 with postprandial data) are shown in blue and controls (n = 24) are shown in red. Abbreviation: OGTT, oral glucose tolerance test.
Figure 5.
Figure 5.
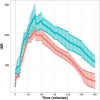
Oral glucose tolerance testing: insulin and C-peptide. Concentrations of the following during oral glucose tolerance test are shown: (A) insulin, (B) C-peptide, stratified by disease status. Data are presented as mean and SEM. Individuals with Friedreich's ataxia (n = 11; 10 with postprandial data) are shown in blue and controls (n = 24) are shown in red.
Figure 6.
Figure 6.
Oral glucose tolerance testing: glucose rate of appearance and disposal. Glucose rate of appearance and rate of disposal normalized to lean body mass (via dual-energy x-ray absorptiometry). (A) Overall rate of appearance; (B) enteral rate of appearance; (C) endogenous rate of appearance (endogenous glucose production); (D) rate of disposal, stratified by disease status. Individuals with Friedreich's ataxia (n = 11; 10 with postprandial data) are shown in blue and controls (n = 23) are shown in red.
Figure 7.
Figure 7.
Factors associated with whole-body insulin sensitivity evaluation of potential factors related to insulin sensitivity, as measured by the whole-body insulin sensitivity index. These are visual representations of the regression models (reported in Table 4), here with standardized β-coefficients (ie, the effect of a 1 SD change in the input variable on the output) and associated 95% confidence intervals. Sex indicates female sex (vs male).
Figure 8.
Figure 8.
Oral glucose tolerance testing: insulin secretion. Insulin secretion was estimated using modeled ISR. ISR area under the curve was calculated in the first phase, from 0 to 30 minutes, and the second phase, 30 to 180 minutes. Individuals with Friedreich's ataxia (n = 10) are shown in blue and controls (n = 24) are shown in red. Abbreviation: ISR, insulin secretory rate.
Figure 9.
Figure 9.
Factors associated with postprandial insulin secretory rate evaluation of potential factors related to postprandial insulin secretory rate. These are visual representations of the regression models (reported in Table 5), here with standardized β-coefficients (ie, the effect of a 1 SD change in the input variable on the output) and associated 95% confidence intervals. Sex indicates female sex (vs male).
Figure 10.
Figure 10.
Targeted quantitative metabolomics, exploratory. For metabolomics analyses, nonparametric tests of association were performed between metabolites and parameters reflecting glucose and insulin homeostasis; nominally statistically significant (unadjusted P-value <.05) associations are shown.

References

    1. Cossee M, Schmitt M, Campuzano V, et al. Evolution of the Friedreich's ataxia trinucleotide repeat expansion: founder effect and premutations. Proc Natl Acad Sci U S A. 1997;94(14):7452‐7457. - PMC - PubMed
    1. Kaplan J. Friedreich's ataxia is a mitochondrial disorder. Proc Natl Acad Sci U S A. 1999;96(20):10948‐10949. - PMC - PubMed
    1. Lodi R, Cooper JM, Bradley JL, et al. Deficit of in vivo mitochondrial ATP production in patients with Friedreich ataxia. Proc Natl Acad Sci U S A. 1999;96(20):11492‐11495. - PMC - PubMed
    1. Wang D, Ho ES, Cotticelli MG, et al. Skin fibroblast metabolomic profiling reveals that lipid dysfunction predicts the severity of Friedreich's ataxia. J Lipid Res. 2022;63(9):100255. - PMC - PubMed
    1. Dong YN, Mesaros C, Xu P, et al. Frataxin controls ketone body metabolism through regulation of OXCT1. PNAS Nexus. 2022;1(3):pgac142. - PMC - PubMed

Publication types