. 2024 Sep 15;213(6):808-822.
doi: 10.4049/jimmunol.2400265.

Cloning and Functional Characterization of Novel Human Neutralizing Anti-IFN-α and Anti-IFN-β Antibodies

Affiliations

Cloning and Functional Characterization of Novel Human Neutralizing Anti-IFN-α and Anti-IFN-β Antibodies

Emmanouil Papasavvas et al. J Immunol. .

Abstract

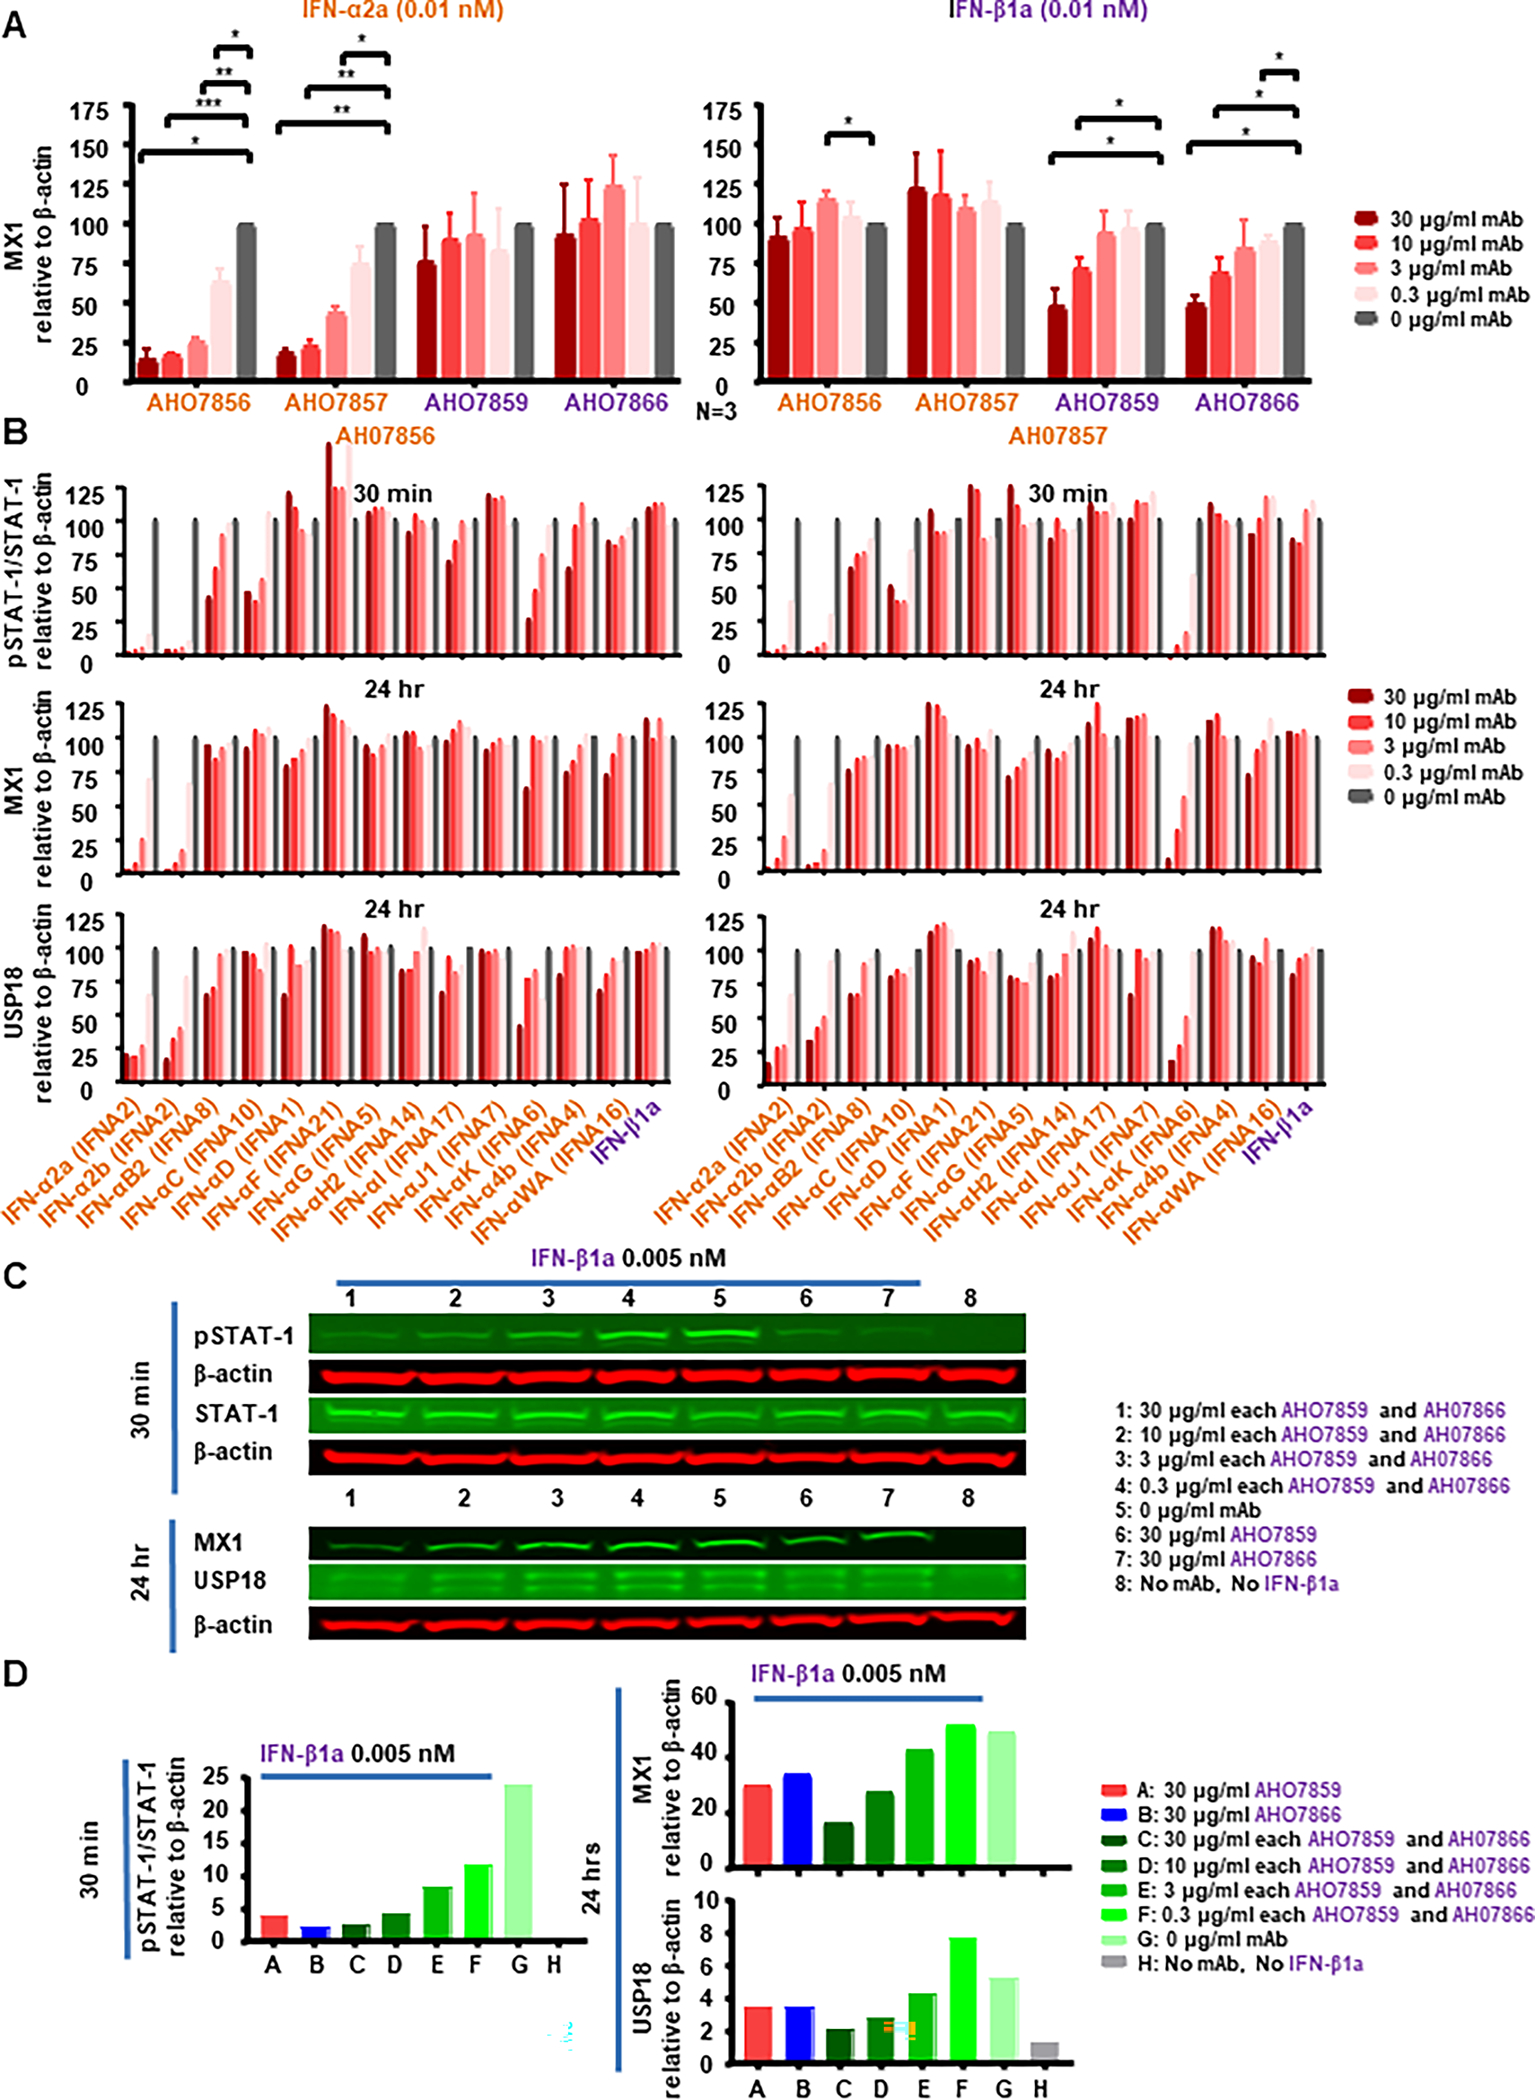
Type I IFNs play a pivotal role in immune response modulation, yet dysregulation is implicated in various disorders. Therefore, it is crucial to develop tools that facilitate the understanding of their mechanism of action and enable the development of more effective anti-IFN therapeutic strategies. In this study, we isolated, cloned, and characterized anti-IFN-α and anti-IFN-β Abs from PBMCs of individuals treated with IFN-α or IFN-β, harboring confirmed neutralizing Abs. Clones AH07856 and AH07857 were identified as neutralizing anti-IFN-α-specific with inhibition against IFN-α2a, -α2b, and -αK subtypes. Clones AH07859 and AH07866 were identified as neutralizing anti-IFN-β1a-specific signaling and able to block lipopolysaccharide or S100 calcium-binding protein A14-induced IFN-β signaling effects. Cloned Abs bind rhesus but not murine IFNs. The specificity of inhibition between IFN-α and IFN-β suggests potential for diverse research and clinical applications.


Conflict of interest statement

Disclosures

Kar Muthumani is an employee of Gene One Life Science Inc. Luis J Montaner is advisor to Gene One Life Sciences, and Sauvie Inc. The other authors declare no competing interests.

Figures

FIGURE 1.
FIGURE 1.
Identification of neutralizing IFN-α-specific and IFN-β-specific plasma from IFN-α or IFN-β-treated persons. (A) Percent (%) inhibition of IFNAR dimerization in the presence of IFN-β and plasma from participants with MS (MS-001 to MS-011) or from healthy control individuals M486-B55, F623-C32. Plasma was pre-incubated overnight with IFN-β at 4°C, at 3X of the final concentrations (final concentrations in the wells with HEK IFNAR1/IFNAR2 cells: 11% plasma, 1.2 nM IFN-β). (B) Top panel shows luminescence for IFNAR dimerization by IFN-β (in limiting dilutions) in the presence or absence of 11% plasma from participant MS-001 or from healthy control individuals M486-B55 and F623-C32. Bottom panel shows luminescence for IFNAR dimerization by IFN-β (in limiting dilutions) in the presence or absence of plasma (in limiting dilutions) from participant MS-001. (C) Luminescence for IFNAR dimerization by IFN-α (in limiting dilutions) in the presence or absence of 11% plasma from participant MS-001 or from healthy control individual M486-B55. (D) Top panel shows Western blot of 10% plasma from participant MS-001 before (indicated as “neat”), and at five rounds of Ab depletion with A/G sepharose beads. Bottom panel shows % inhibition of IFNAR dimerization in the absence of 1.2nM IFN-β, or in the presence of 1.2nM IFN-β and 10% plasma from participant MS-001 (before and after Ab depletion) or from healthy control individual F623-C32. (E) Percent (%) inhibition of IFNAR dimerization in the presence of IFN-α and plasma from ART-suppressed persons living with HIV having a history of receiving IFN-α immunotherapy (Peg-002 to Peg-032), or plasma from healthy control individuals M486-B55, F623-C32, or neutralizing anti-IFN-α Ab (BMS-13H5)]. Plasma was heat inactivated at 56°C for 1 h and then pre-incubated overnight with IFN-α at 4°C, at 3X of the final concentrations (final concentrations in the wells with HEK IFNAR1/IFNAR2 cells: 11% plasma, 2.4 nM IFN-α, 1.1. μg/ml anti-IFN-α Ab). (F) Luminescence for IFNAR dimerization by IFN-α (in limiting dilutions) in the presence or absence of 11% plasma from participant Peg-008 or from healthy control individual F623-C32. (G) Luminescence for IFNAR dimerization by IFN-β (in limiting dilutions) in the presence or absence of 11% plasma from participant Peg-008 or from healthy control individual F623-C32. (H) Top panel shows Western blot of 10% plasma from participant MS-001 before (indicated as “neat”), and at 5 rounds of depletion of Abs with A/G sepharose beads. Bottom panel shows % inhibition of IFNAR dimerization in the absence of 2.4nM IFN-α, or in the presence of 2.4nM IFN-α and 10% plasma from participant Peg-008 (before and after Ab depletion) and from healthy control individual M486-B55. In panels (B), (C), (F) and (G) plasma was heat inactivated at 56°C for 1 h and then pre-incubated overnight with IFN-β or IFN-α at 4°C, at 3X of the final concentrations. Dilution values shown are the final concentrations in the wells with cells. Data in panels (A), (D), (E) and (H) are shown as means and SD of % inhibition. Experiments shown are representative of a minimum of duplicate experiments.
FIGURE 2.
FIGURE 2.
Characterization of expressed and purified mAbs using Western blot and Coomassie blue straining together with analysis of mAb reactivities with IFN-α2a and IFN-β proteins using ELISA and Western blot assays. (A) The amplified VH and VL genes were selectively assembled into DNA cassettes. The pairs of IgH and IgL genes were co-transfected in Expi293F cell culture. (B) Following expression, mAb were purified, and the purified IgG was subjected to SDS-PAGE analysis using a NuPAGE 4–12% Bis-Tris gel. Gel analysis revealed the presence of two bands in each lane, with approximate molecular weights of 25 kDa and 50 kDa, respectively. These bands corresponded to the light and heavy chains of the mAb and subjected to immunoblotting using the fusion proteins as indicated. To further confirm the identity of the heavy and light chains, Western blotting results displayed the heavy and light chains on the left side of the panel (lane P is positive control Human IgG 1K, lane 1 sample prepared under reducing conditions, lane 2 sample prepared under non-reducing conditions), confirming the successful expression and purification of the mAb. (C) For ELISA, purified Abs were diluted by serial dilution and incubated with purified IFN-α2a and IFN-β proteins. The reactivity of the purified Abs was determined by indirect ELISA, where the Ab titer was defined as the highest dilution of serum exhibiting an OD450 ratio. The results showed that the purified Abs exhibited high reactivity. The data are presented as the mean ± SD, with OD representing optical density. (D) In Western blot analysis, recombinant proteins (0.5 μg) were separated by SDS-PAGE, and equal concentrations of purified mAbs were used to probe the blots for purification and identification. A protein molecular weight marker (Lane M) was included. The primary Ab (at a dilution of 1:200) was recombinantly expressed with high specificity and affinity for the target proteins. The secondary Ab used was IRDye© 800 CW goat anti-human IgG (at a dilution of 1:10000). Western blotting confirmed that the observed band corresponded to the target proteins. Clones specific for IFN-α2a and IFN-α are indicated in orange fonts, while clones specific for IFN-β are indicated in purple fonts. Experiments shown are representative of three experiments.
FIGURE 3.
FIGURE 3.
IFN-specific neutralization and binding saturation to human, rhesus or mouse IFN-α and IFN-β for anti-IFN-specific clones. (A) Percent (%) inhibition of IFNAR dimerization in the presence of IFN-α (top panel) or IFN-β (bottom panel) when combined with supernatants from IFN-specific binding clones, control plasma (MS-006 or Peg-008 from Fig. 1, respectively), or neutralizing control anti-IFN-α (BMS-13H5) and anti-IFN-β (CTI-AF1) Abs. Supernatants from clones or anti-IFN-α or anti-IFN-β Abs were pre-incubated overnight with IFN-α or IFN-β at 4°C at the final concentrations. Final concentrations in the wells with HEK IFNAR1/IFNAR2 cells: 67% clone’s supernatants, 2.4 nM IFN-α, 1.2 nM IFN-β, 10 μg/ml of anti-IFN-α (BMS-13H5) and anti-IFN-β (CTI-AF1) Abs. (B) Saturation binding of different concentrations of neutralizing anti-IFN-specific clones AH07856, AH07857, AH07859 and AH07866 to human IFN-α (left) or human IFN-β (right) panels. (C) Left column shows saturation binding of different concentrations of anti-IFN-α-specific clones AH07856 (top) and AH07857 (bottom) to human, rhesus, and mouse IFN-α with KD values indicated next to each clone. Right column shows saturation binding of different concentrations of anti-IFN-β-specific clones AH07859 (top) and AH07866 (bottom) to human, rhesus, and mouse IFN-β with KD values indicated next to each clone. See Table I and Supplemental Fig. 4 for added kinetic parameters for IFN-α and IFN-β clones binding to human, mouse and rhesus IFN-α and IFN-β, respectively. In panel (A) IFN-α and IFN-α-specific clones are indicated with orange fonts and orange shaded boxes respectively, while IFN-β and IFN-β-specific clones are indicated with purple fonts and purples shaded boxes respectively. In panels (B) and (C) saturation binding of different concentrations of clones to IFN-α and IFN-β from the different species are indicated with different shapes, while IFN-α and IFN-α-specific clones are indicated with orange fonts, and IFN-β and IFN-β-specific clones are indicated with purple fonts. Experiments shown are representative of a minimum of duplicate experiments.
FIGURE 4.
FIGURE 4.
Inhibition of IFN-mediated STAT-1 phosphorylation in CD3+CD4+ primary T cells by anti-IFN-specific clones. Levels of phosphorylated STAT-1 (pSTAT-1) are shown in CD3+CD4+ T cells following stimulation of PBMC with or without IFN-α or IFN-β and in the presence or absence of anti-IFN-specific clones. (A) pSTAT-1 histogram panels for the effects of clones AH07856, or AH07857 (tested at 25, 5 and 1 μg/ml) on 1250 U/ml IFN-α or IFN-β stimulation. (B) pSTAT-1 histogram panels for the effects of clones AH7859 and AH07866 (tested at 25 μg/ml) on decreasing concentrations of IFN-α or IFN-β stimulation (1250, 625, 312, 156, 78 U/ml). For all histograms: (i) pink shaded peak shows constitutive pSTAT-1 levels in the absence of stimulation with IFN-α or IFN-β and in the absence of clones, (ii) green peak shows pSTAT-1 levels in the presence of stimulation with IFN-α or IFN-β and in the absence of clones, (iii) blue peak shows pSTAT-1 in CD3+CD4+ T cells in the presence of stimulation with IFN-α or IFN-β and in the presence of clones, and (iv) black line and number with red font inside the histogram show CD3+CD4+pSTAT-1+ percent (%) of CD3+CD4+ T cells following stimulation with IFN-α or IFN-β and in the presence of clones. IFN-α and IFN-α-specific clones are indicated with orange fonts, while IFN-β and IFN-β-specific clones are indicated with purple fonts. Experiments shown are representative of a minimum of duplicate experiments. See Supplemental Fig. 1 for gating strategy for the detection of pSTAT-1 in CD3+CD4+ T cells by flow cytometry.
FIGURE 5.
FIGURE 5.
Inhibition of IFN-mediated expression of pSTAT-1, MX1 and USP18 in THP-1 cells by neutralizing anti-IFN-specific Abs. Shown are Western blots analysis for the expression of pSTAT-1, STAT-1, MX1, USP18 and β-actin in THP-1 cells following stimulation for 30 mins for pSTAT-1 and STAT-1, and for 24 hs for MX1 and USP18 after IFN-α subtypes or IFN-β stimulation. (A) Bar graphs showing mean and standard error of three Western blots experiments measuring MX1 expression relative to β-actin levels in PMA-differentiated THP-1 cells following stimulation for 24 hs with 0.01 nM of IFN-α2a or IFN-β1a in the presence or absence of clones AH07856, AH07857, AH07859 and AH07866 at 30, 10, 3, and 0.3 μg/ml. Statistical significant differences between the different concentrations as compared to 0 μg/ml control for each clone for the 3 experiments are shown on the top of the graphs wth * if <0.05, ** if <0.001, and *** if <0.0001. (B) Bar graphs showing the results of the Western blots of one experiment measuring pSTAT-1/STAT-1, MX1 and USP18 expression relative to β-actin levels in PMA-differentiated THP-1 cells following stimulation for 30 mins for STAT-1, and 24 hs for MX1 and USP18 with 0.01 nM of IFN-α subtypes or 0.005 nM IFN-β1a in the presence or absence of clones AH07856, and AH07857 at 30, 10, 3, and 0.3 μg/ml. The Western blots for this experiment are shown in Supplemental Fig. 7. (C) Western blots showing expression of pSTAT-1, STAT-1, MX1, USP18 and β-actin in PMA-differentiated THP-1 cells following stimulation for 30 mins for pSTAT-1 and STAT-1, and for 24 hs for MX1 and USP18 after exposure to 0.005 nM of IFN-β1a in the presence or absence of clones AH07859 and AH07866 used alone or in combination at 30, 10, 3, and 0.3 μg/ml. (D) Bar graphs showing pSTAT-1/STAT-1, MX1 and USP18 expression relative to β-actin levels in PMA-differentiated THP-1 for the Western blots shown in panel (C). Western products evaluated were pSTAT-1/STAT-1: 91, 84 kDa, MX1: 76 kDa, USP18: 39, 34 kDa, and β-actin: 42 kDa. In all panels, IFN-α, IFN-α subtypes and IFN-α-specific clones are indicated with orange fonts, while IFN-β, IFN-β1a and IFN-β-specific clones are indicated with purple fonts.
FIGURE 6.
FIGURE 6.
Inhibition of LPS or S100A14-induced IFN-mediated expression of MX1 and USP18 in THP-1 cells by neutralizing anti-IFN-specific Ab. Western blots showing the expression of pSTAT-1, STAT-1, MX1, USP18 and β-actin in THP-1 cells following stimulation for 30 mins for pSTAT-1 and STAT-1, and for 24 hs for MX1 and USP18 with IFN-α2a (0.01 nM, section C), IFN-β1a (0.01 nM, section D), LPS (10 ng/ml, section A) or S100A14 (10 ng/ml, section B) or unstimulated control (section E) in the presence of 30 μg/ml of clones AH07856 (lane 1) or AH07866 (lane 2) or in the absence of clones (lane 3). pSTAT-1/STAT-1: 91, 84 kDa, MX1: 76 kDa, USP18: 39, 34 kDa, and β-actin: 42 kDa. IFN-α and IFN-α-specific clones are indicated with orange fonts, while IFN-β and IFN-β-specific clones are indicated with purple fonts. Experiments shown are representative of three experiments.

Update of

References

    1. McNab F, Mayer-Barber K, Sher A, Wack A, and O’Garra A. 2015. Type I interferons in infectious disease. Nat Rev Immunol 15: 87–103. - PMC - PubMed
    1. Biron CA 2001. Interferons alpha and beta as immune regulators--a new look. Immunity 14: 661–664. - PubMed
    1. Malmgaard L 2004. Induction and regulation of IFNs during viral infections. J Interferon Cytokine Res 24: 439–454. - PubMed
    1. Stark GR, Kerr IM, Williams BR, Silverman RH, and Schreiber RD. 1998. How cells respond to interferons. Annu Rev Biochem 67: 227–264. - PubMed
    1. Asmuth DM, Utay NS, and Pollard RB. 2016. Peginterferon alpha-2a for the treatment of HIV infection. Expert Opin Investig Drugs 25: 249–257. - PubMed

LinkOut - more resources