. 2024 Aug 7:13:e86042.
doi: 10.7554/eLife.86042.

Actin networks modulate heterogeneous NF-κB dynamics in response to TNFα

Affiliations

Actin networks modulate heterogeneous NF-κB dynamics in response to TNFα

Francesca Butera et al. Elife. .

Abstract

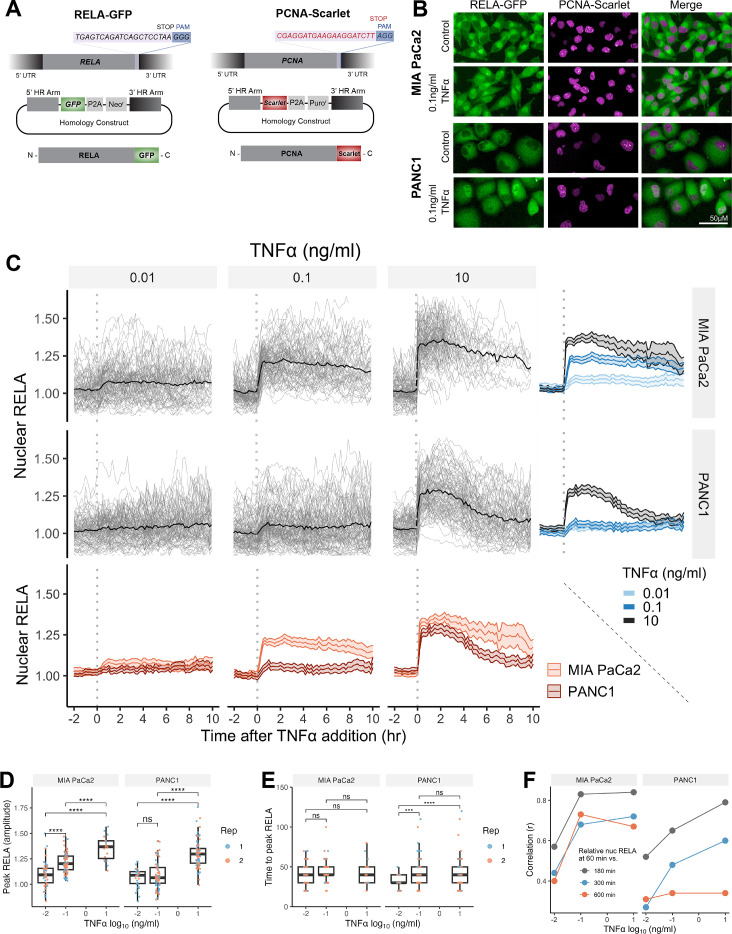
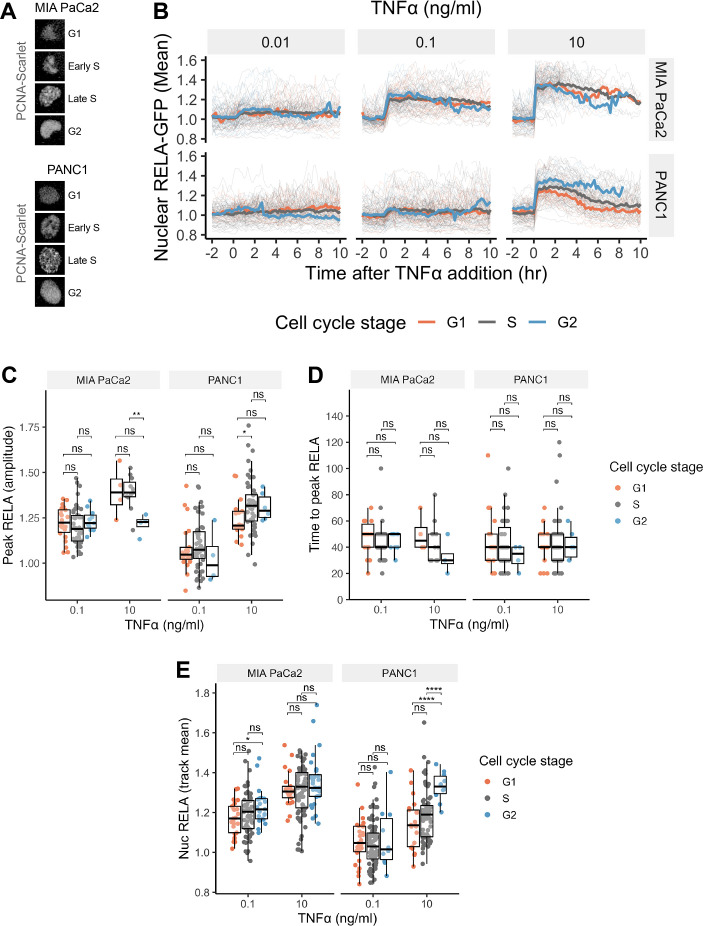
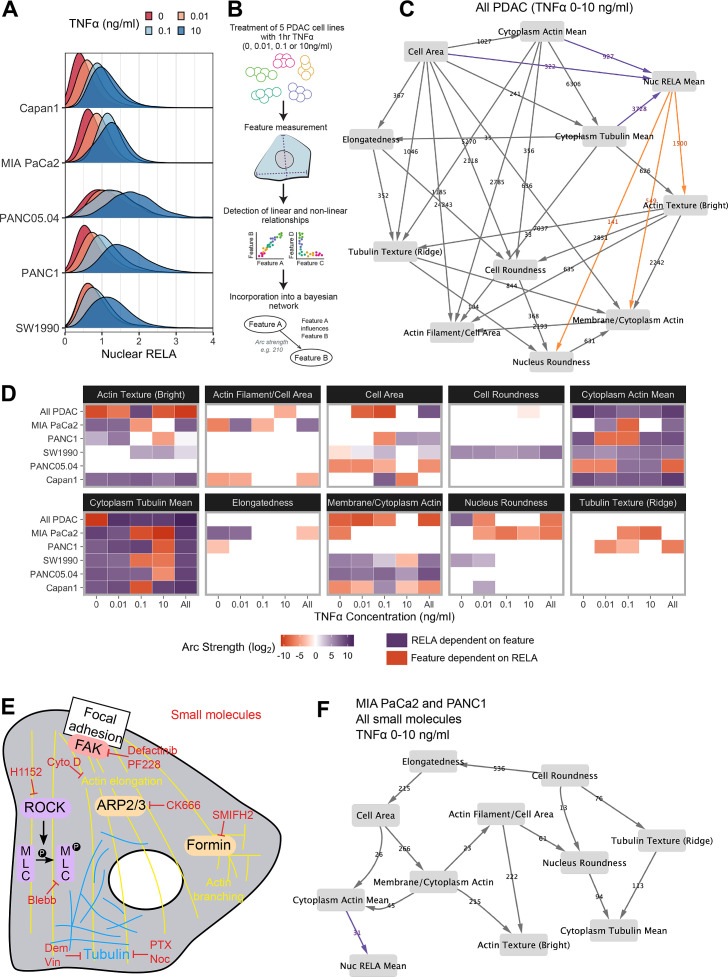
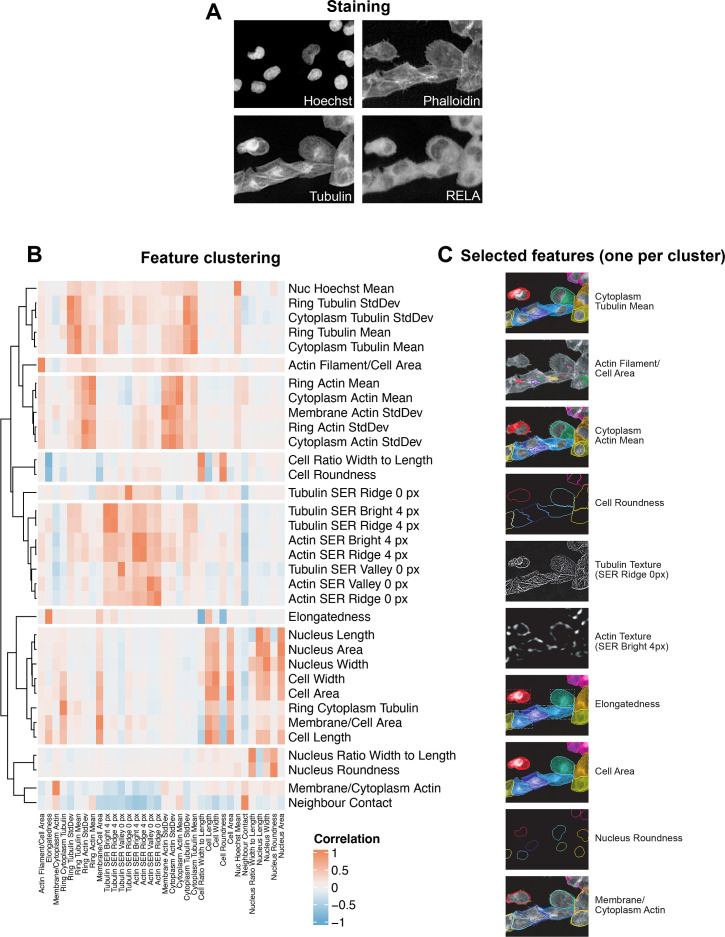
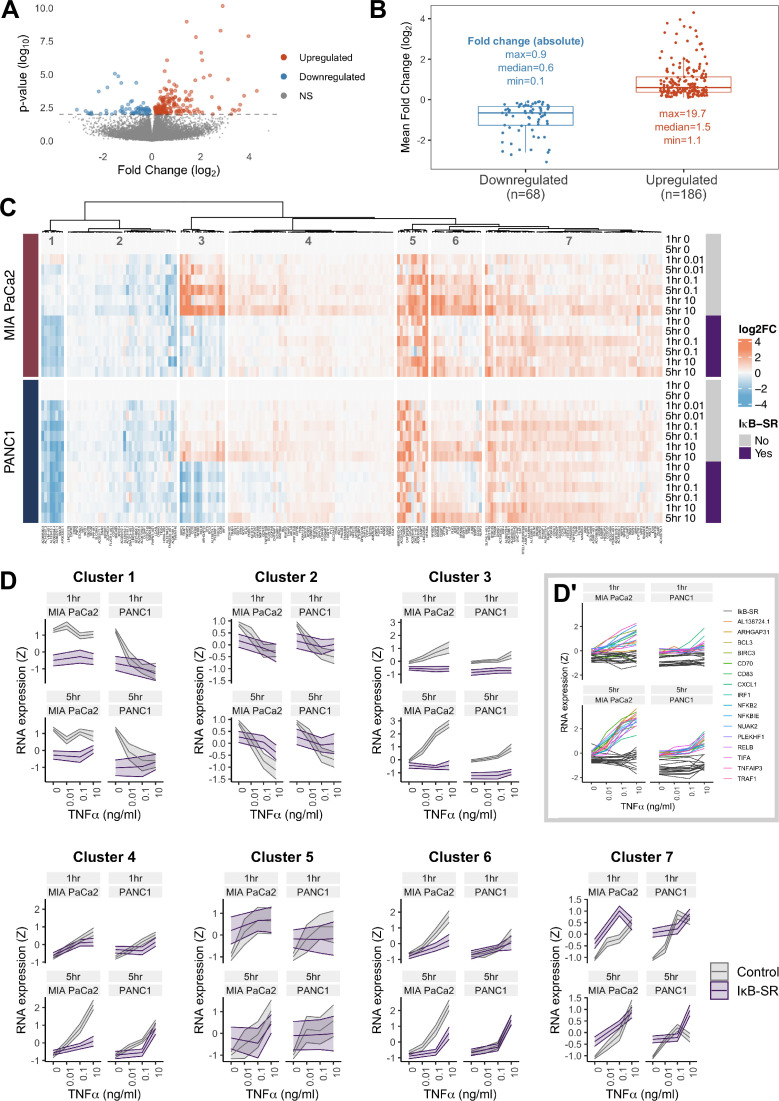
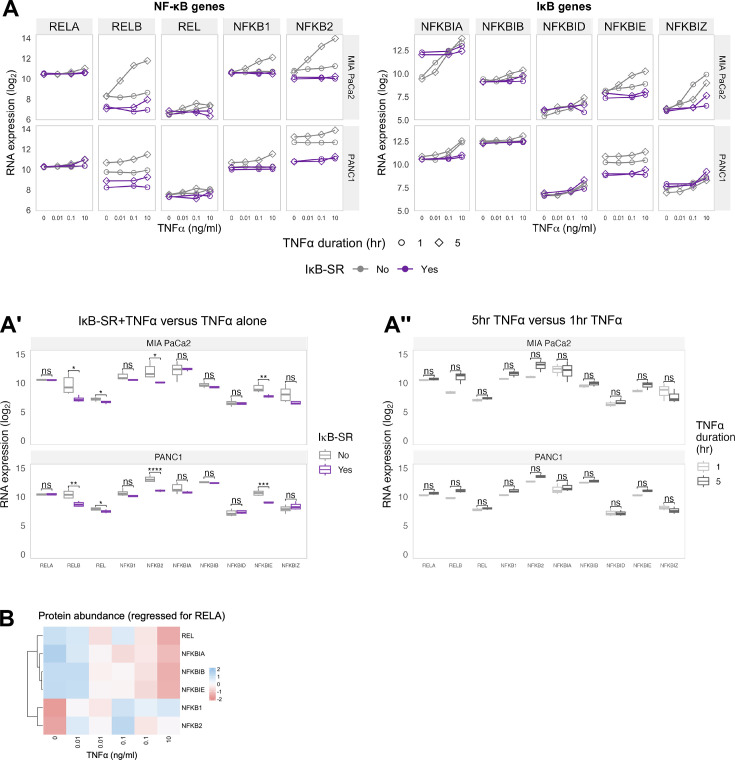
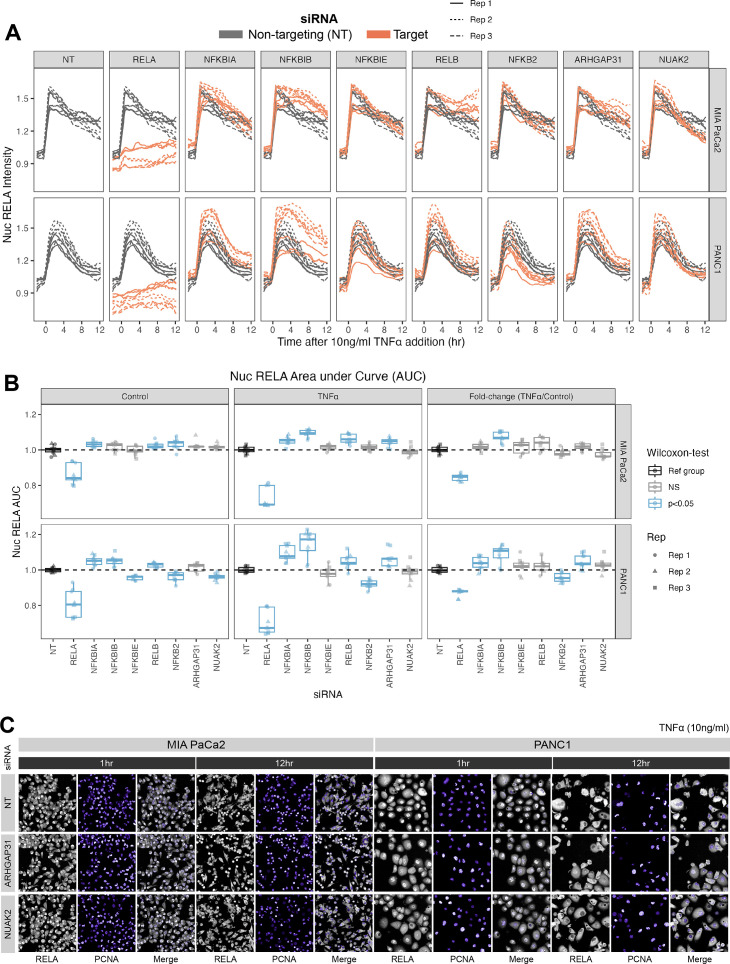
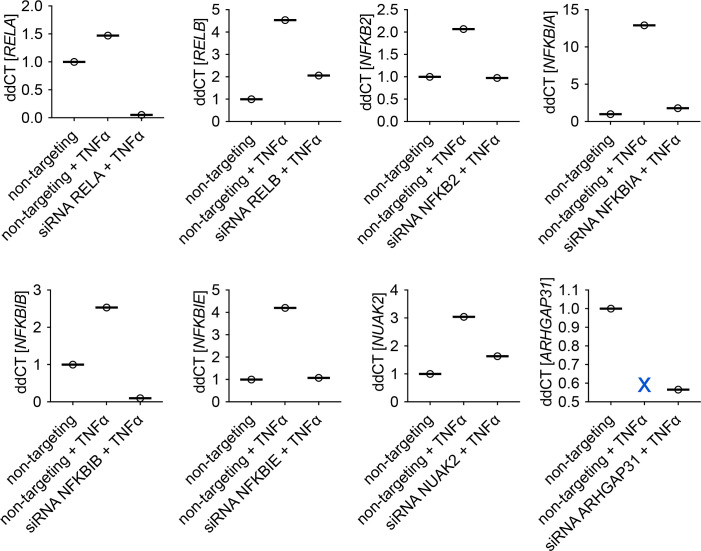
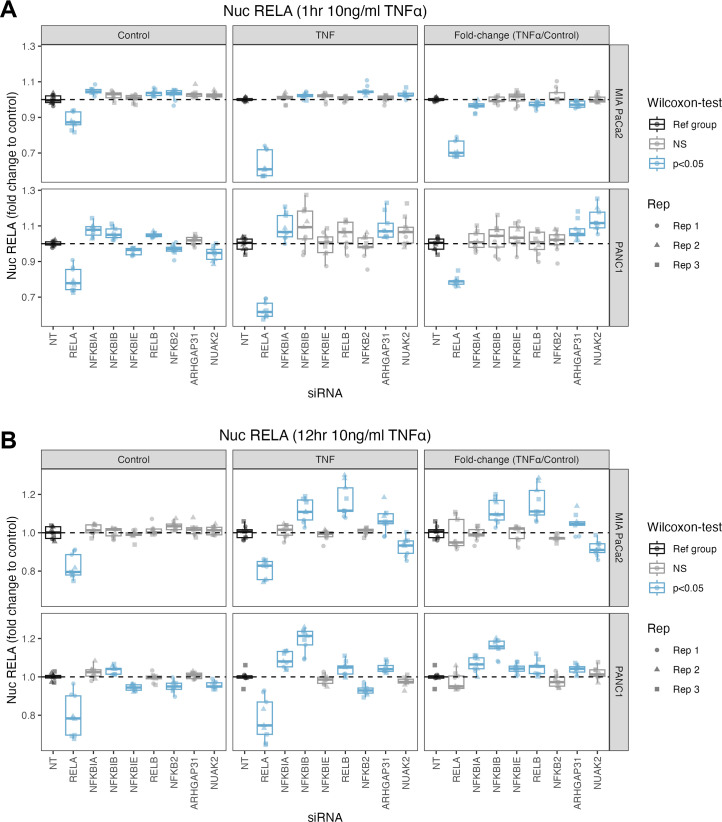
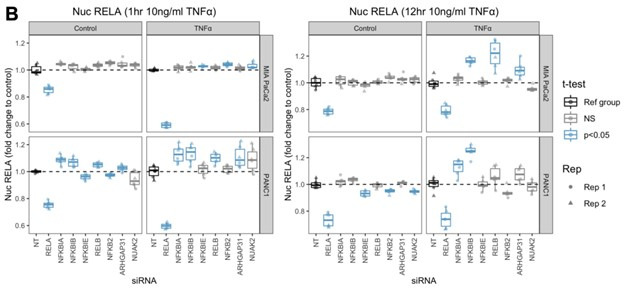
The canonical NF-κB transcription factor RELA is a master regulator of immune and stress responses and is upregulated in pancreatic ductal adenocardinoma (PDAC) tumours. In this study, we characterised previously unexplored endogenous RELA-GFP dynamics in PDAC cell lines through live single-cell imaging. Our observations revealed that TNFα stimulation induces rapid, sustained, and non-oscillatory nuclear translocation of RELA. Through Bayesian analysis of single-cell datasets with variation in nuclear RELA, we predicted that RELA heterogeneity in PDAC cell lines is dependent on F-actin dynamics. RNA-seq analysis identified distinct clusters of RELA-regulated gene expression in PDAC cells, including TNFα-induced RELA upregulation of the actin regulators NUAK2 and ARHGAP31. Further, siRNA-mediated depletion of ARHGAP31 and NUAK2 altered TNFα-stimulated nuclear RELA dynamics in PDAC cells, establishing a novel negative feedback loop that regulates RELA activation by TNFα. Additionally, we characterised the NF-κB pathway in PDAC cells, identifying how NF-κB/IκB proteins genetically and physically interact with RELA in the absence or presence of TNFα. Taken together, we provide computational and experimental support for interdependence between the F-actin network and the NF-κB pathway with RELA translocation dynamics in PDAC.

Keywords: NF-κB; PDAC; RELA; TNF; actin; cancer biology; cell biology; human; single-cell dynamics.

Plain language summary

The prognosis for the most common type of pancreatic cancer, pancreatic ductal adenocarcinoma, also known as PDAC, remains poor. Only around 4% of PDAC patients are likely to live 5 years after being diagnosed. The immune system plays a part in the progression of PDAC, as increased inflammation contributes to the growth of the tumour and its ability to resist treatment. The NF-κB proteins of the immune system are transcription factors that control when and how much certain other proteins are produced. The protein RELA is an important member of the NF-κB family. It is known to be overactivated in PDAC tumours and may be responsible for the high levels of inflammation found in this type of pancreatic cancer. A better understanding of how RELA is activated in PDAC cells will help develop medicines targeting this process. Butera et al. combined experimental and computational approaches to model a network of interactions between key molecules in lines of human PDAC cells grown in the laboratory to investigate how RELA is controlled. Usually, when the RELA protein is activated, it is located in the cell’s nucleus, this means that tracking the location of RELA within the cell can reveal its activated form. To follow RELA, it was labelled with a fluorescent marker and visualised using live, high-throughput fluorescence microscopy. When RELA was activated with a pro-inflammatory molecule TNFα, it changed how it moved in and out of the cell’s nucleus. Using computational modelling approaches, Butera et al. could build a statistical model that revealed that the location and activity of RELA is affected by actin, a key component of the cell’s molecular scaffolding called the cytoskeleton. When actin was disrupted, RELA's activity was altered. Moreover, profiling targets of RELA using RNA sequencing revealed two genes that encode proteins related to the regulation of actin. This indicates that RELA activity – which is itself affected by actin organisation – can feed back to regulate actin. Butera et al. have identified genes regulated by RELA in PDAC cells that could be used as targets for anti-cancer drug development. Further research into the feedback between RELA and actin will help untangle the complex network that causes inflammation in pancreatic cancer.


Conflict of interest statement

FB, JS, LD, CB No competing interests declared

Figures

Figure 1.
Figure 1.. Single-cell analysis of live endogenous RELA-GFP dynamics with TNFα in human pancreatic cell lines.
(A) Schematic of CRISPR gRNA and homology constructs, with neomycin (neo) resistance for tagging of the RELA C-terminus with GFP and puromycin (puro) resistance for tagging of the PCNA C-terminus with Scarlet. (B) Confocal microscopy images of MIA PaCa2 and PANC1 monoclonal cell lines expressing endogenously tagged RELA-GFP and PCNA-Scarlet and treated with 1 hr solvent control or 0.1 ng/ml TNFα. (C) Tracks of single-cell nuclear RELA-GFP intensity measurements in MIA PaCa2 and PANC1 cells from –120 min to +600 min relative to TNFα addition (0.01, 0.1, and 10 ng/ml). n = 50–60 tracked cells per TNFα dose for each of the two experimental repeats. (D) Amplitude and (E) time of first nuclear RELA-GFP intensity peak in MIA PaCa2 cand PANC1 single cells. Boxplots show median and interquartile range. M = median per cluster. σ = standard deviation. Statistical significance shown for t-tests with Benjamini–Hochberg correction. ns (non-significant) = p>0.05, *p<0.05, **p<0.01, ***p<0.001, ****p<0.0001. (F) Pearson’s correlation coefficient (r) between nuclear RELA-GFP intensity at 60 min versus 180, 300, or 600 min within single-cell RELA-GFP tracks. Data are normalised within each track to nuclear RELA-GFP intensity at 0 min.
Figure 1—figure supplement 1.
Figure 1—figure supplement 1.. Cell cycle independence of TNFα-mediated RELA dynamics in PDAC cells.
(A) Confocal microscopy images of PCNA-Scarlet in representative MIA PaCa2 and PANC1 nuclei in G1, early S, late S or G2 cell cycle stage. (B) Single-cell nuclear RELA-GFP tracks for MIA PaCa2 and PANC1 cells categorised by cell cycle stage at the time of TNFα addition (0.01, 0.1, or 10 ng/ml), based on the intensity and appearance of PCNA-Scarlet. (C) Single-cell measurements of nuclear RELA intensity at track peak and (D) time to track peak by cell cycle stage at TNFα addition. (E) Mean nuclear RELA intensity per single-cell track, by cell cycle stage at TNFα addition. (C–E) show statistical significance from t-test comparisons with Benjamini–Hochberg correction: ns (non-significant) = p>0.05, *p<0.05, **p<0.01, ***p<0.001, ****p<0.0001.
Figure 2.
Figure 2.. Bayesian network analysis predicts statistical dependence of RELA on actin.
(A) Single-cell nuclear RELA intensity distributions by immunofluorescence and automated image analysis. (B) Schematic depicting generation of a Bayesian network model for probabilistic relationships between cell features in PDAC cells. PDAC cells were treated with 0, 0.01, 0.1, or 10 ng/ml TNFα for 1 hr. Using automated image analysis of cell markers, features are measured on a single-cell basis and Bayesian analysis is used to detect linear and non-linear relationships between the features. These relationships are incorporated into a Bayesian network model, which is an influence diagram consisting of nodes, each representing a measured feature, and arcs between the nodes that depict predicted dependencies between the nodes. Network was generated using single-cell data with 1000 single cells sampled per cell line (MIA PaCa2, PANC1, Capan1, SW1990, and PANC05.04), TNFα dose and biological repeat (n = 3 biological repeats, each with four wells/technical replicates). (C) Bayesian network model incorporating data from all PDAC lines treated for 1 hr with 0 (solvent control), 0.01, 0.1, or 10 ng/ml TNFα. Values next to arcs represent the strength of the probabilistic relationship expressed by the arc (arc strength). Orange arcs connect features predicted to depend on nuclear RELA mean, and purple arcs connect features predicted to influence nuclear RELA mean. (D) Dependencies involving nuclear RELA mean in Bayesian network models generated with single-cell data for individual treatments or cell lines, or for all cell lines collated (top row in each cell feature section), or all treatments collated (rightmost column in each cell feature section). Purple indicates that nuclear RELA mean is predicted to depend on the cell feature in the Bayesian network model. Orange represents that a cell feature is predicted to depend on nuclear RELA intensity. Dependency strengths are calculated as log2(|arc strength|), multiplied by –1 for dependencies of cell features on nuclear RELA intensity. (E) Schematic indicating small molecules targeting the cytoskeleton. CK666 inhibits the ARP2/3 complex that mediates actin filament nucleation and branching (Mullins et al., 1998). SMIFH2 inhibits formins (Rizvi et al., 2009), which produce long straight filaments by promoting actin nucleation and filament elongation (Pruyne et al., 2002). Cytochalasin D binds to the growing end of actin filaments and inhibits polymerisation (Schliwa, 1982). H1152 targets Rho-kinase (ROCK), preventing ROCK phosphorylation of myosin light chain that normally promotes actin-binding and contractility, while blebbistatin blocks myosin II ATPase and actin contractility (Sasaki et al., 2002; Kovács et al., 2004). Tubulin-targeting drugs prevent MT assembly (vinblastine and nocodazole), limit MT formation and cause MT depolymerisation (demecolcine), or stabilise MTs and prevent disassembly (paclitaxel) (Spencer and Faulds, 1994; Vasquez et al., 1997; Gigant et al., 2005). Focal adhesion kinase (FAK) regulates turnover of focal adhesions, which are integrin-containing complexes linking intracellular actin to extracellular substrates. (F) Bayesian network model generated by single-cell data from MIA PaCa2 and PANC1 cells treated separately with the small molecules in (E) for 2 hr, then simultaneously treated with TNFα (0, 0.01, 0.1, or 10 ng/ml) for 1 hr. Numbers indicate arc strengths. In the presence of small molecule inhibition of the cytoskeleton, nuclear RELA mean is predicted to be dependent on cytoplasm actin mean alone, indicated by the purple arc connecting ‘cytoplasm actin mean’ and ‘nuc RELA mean’. Cells were analysed from three biological repeats, each with four wells/technical replicates. Numbers of cells per treatment and cell line are included in Figure 2—source data 1 (range 9,800–20,530 cells per treatment/cell line).
Figure 2—figure supplement 1.
Figure 2—figure supplement 1.. Automated image analysis of RELA localisation, cell shape, and the cytoskeleton in human cells.
(A) Staining by immunofluorescence (α-tubulin and RELA) and dyes marking DNA (Hoechst) and F-actin (phalloidin). Cell regions were segmented using Hoechst and α-tubulin stains and features were measured in these regions using the four stains. (B) Hierarchical clustering of 35 normalised cell features (excluding RELA measurements) measured in five PDAC cell lines. (C) Images and names of the selected features (one per cluster) in the reduced feature set.
Figure 2—figure supplement 2.
Figure 2—figure supplement 2.. Principal component analysis (PCA) of five human PDAC cell lines with a reduced set of cytoskeletal and cell shape features.
PCA of the 10 reduced features used in Bayesian analysis for five PDAC cell lines using two principal components (PC1 and PC2). Overlayed is a biplot (arrows) as an indication of the contribution of each cell feature to the two PCs. Circles represent technical replicates. n = 4 biological repeats. Horizontal bar graphs for individual cell lines show mean z-scores for each feature, calculated across all cell lines to compare differences in each feature between the cell lines. Z-scores were calculated using the mean and standard deviation for control measurements across all cell lines for each biological repeat. Displayed is the mean z-score across all biological repeats (n = 4). Images for each cell line show Hoechst, phalloidin marking F-actin (Actin), α-tubulin (Tubulin), and RELA staining by immunofluorescence.
Figure 2—figure supplement 3.
Figure 2—figure supplement 3.. Dose–responses for cytoskeleton-targeting drugs.
Dose–response curves and representative images of MIA PaCa2 cells treated with small molecules in the absence of TNFα. n = 4 technical replicates per drug dose. (A, B) 24 hr treatment with tubulin-targeting drugs: vinblastine (0–100 nM), paclitaxel (0–200 nM), nocodazole (0–400 nM), and demelcoline (0–200 nM). (C, E) 24 hr treatment with actin-targeting drugs: cytochalasin D (0–4 µM) and CK666 (0–400 µM). (D, E) 24 hr treatment with myosin-targeting drugs: H1152 (0–40 µM) and blebbistatin (0–40 µM). (F) 3 hr treatment with the actin-targeting drug SMIFH2 (0–100 µM). (G) 24 hr treatment with the FAK inhibitors PF-573228 (PF228; 0–2 µM) and defactinib (0–20 µM).
Figure 3.
Figure 3.. RNA-seq analysis of genes regulated by TNFα and RELA in human PDAC cells.
(A) Volcano plot of p-value against mean fold-change (log2) per gene comparing RNA expression with high TNFα (0.1 or 10 ng/ml) to control conditions (no TNFα) across MIA PaCa2 and PANC1 cells, using abundance at both 1 and 5 hr (handled as pseudo-replicates). Counts were normalised and log2 fold-changes were calculated using DESeq2. Two technical replicates were processed per cell line and treatment. (B) Mean fold-change (log2) across MIA PaCa2 and PANC1 cells for genes significantly downregulated (n = 68) or upregulated (n = 186) by TNFα (p<0.01) from (A). Also displayed are the maximum, median and minimum absolute fold-changes for downregulated and upregulated genes. (C) Clustered heatmap of TNFα regulated genes. Normalised counts from DESeq2 were log2 transformed and relative to the respective control (no TNFα or IκB-SR) per timepoint (1 or 5 hr) and cell line (MIA PaCa2 or PANC1), then z-scored across all samples independent per gene. Columns are annotated by gene and rows are annotated by cell line, TNFα dose and time, and presence of IκB-SR. (D) Z-scores for all genes per cluster, faceted by cell line and treatment time (1 or 5 hr). Ribbons show the 95% confidence interval and the middle line depicts the mean. Colour corresponds to the presence of IκB-SR. (D’) Individual genes within cluster 3, coloured by gene for control (no IκB-SR) data and grey for all data with IκB-SR (all genes).
Figure 3—figure supplement 1.
Figure 3—figure supplement 1.. Hierarchical clustering of TNFα/RELA-regulated gene expression in PDAC cells.
(A) RNA-seq expression of genes encoding NF-κB (left) and IκB (proteins) in MIA PaCa2 and PANC1 cells treated with TNFα for 1 or 5 hr in the presence of IκB-SR (constitutively active IκB) or a DMSO control. Normalised counts were generated by DESeq2 and log2 transformed. (A’’, A’’’) Statistical analysis (Wilcoxon tests with Benjamini–Hochberg correction) of data in (A) comparing RNA expression of each gene (A’’) between cells treated with TNFα (data from 0.01, 0.1, and 10 ng/ml, and 1 and 5 hr treatment collated) in the presence or absence of IkB-SR; or (A’’’) between cells with 1 or 5 hr TNFα treatment (0.01, 0.1, and 10 ng/ml collated) in the absence of IkB-SR. ns (non-significant) = p>0.05, *p<0.05, **p<0.01. (B) Summary of proteins detected by Co-IP and mass spectrometry using GFP-Trap in MIA PaCa2 RELA-GFP cells. Cells were treated with TNFα (0, 0.01, 0.1, or 10 ng/ml) for 1 hr. Pull-downs were analysed using mass spectrometry. n = 1 experimental repeat for 0 and 10 ng/ml TNFα and n = 2 experiment repeats for 0.01 and 0.1 ng/ml TNFα. Protein abundances at each TNFα dose adjusted to RELA abundance.
Figure 4.
Figure 4.. Effects of siRNA knockdown of genes involved in TNFα and actin signalling on RELA dynamics.
(A) Tracks of RELA-GFP intensity measurements relative to the timing of 10 ng/ml TNFα addition (–2 hr to +12 hr) following 48 hr siRNA incubation, across two PDAC cell lines: MIA PaCa2 and PANC1. Each panel corresponds to an siRNA, with the three biological/experimental replicates shown in different line styles (solid, dotted, and dashed). Each line depicts well mean data (n = 3 wells/technical replicates per biological repeat). Grey lines represent RELA-GFP measurements with non-targeting (NT) siRNA and are identical in all facets. Orange lines show RELA-GFP tracks from cells with siRNA depletion for the target gene indicated in the column facet. (B) Area under the curve (AUC) measurements (see ‘Materials and methods’) for nuclear RELA intensity over time for each siRNA gene knockdown, for MIA PaCa2 and PANC2 cells treated with 10 ng/ml TNFα or control treatment. All data are normalised by dividing the nuclear RELA AUC by the mean AUC for the NT siRNA control by biological repeat, cell line and treatment (TNFα versus control). Statistical results are shown for Wilcoxon tests with Benjamini–Hochberg correction for multiple comparisons, testing for differences in AUC measurements between technical replicates for each siRNA to the non-targeting siRNA control, independently by cell line and treatment (TNFα versus control). Blue boxplots represent statistically significant (p<0.05) results and grey boxplots show statistically non-significant results. n = 3 experimental repeats, each with three wells/technical replicates per treatment (siRNA, TNFα dose, and cell line). Experimental repeats are depicted by shape (Rep 1 = circle, Rep 2 = triangle, Rep 3 = square). AUC fold-changes (rightmost facet) are calculated by dividing each measurement by the mean of the control (no TNFα) measurements for each siRNA. (C) Snapshots from confocal microscopy timelapse imaging of endogenous RELA-GFP (grey) and PCNA-Scarlet (nuclear marker, shown in purple) in MIA PaCa2 and PANC1 cells following NT, ARHGAP31, or NUAK2 48 hr siRNA treatment, followed by 1 or 12 hr 10 ng/ml TNFα addition.
Figure 4—figure supplement 1.
Figure 4—figure supplement 1.. Validation of siRNA knockdown by qRT-PCR.
MIA PaCa2 cells expressing endogenous RELA-GFP were transfected with siRNA for 48 hr, then treated with 1 hr 10 ng/ml TNFα or vehicle control. Gene expression was determined by qRT-PCR (n = 3 technical replicates) and normalised to GAPDH expression.
Figure 4—figure supplement 2.
Figure 4—figure supplement 2.. Mean nuclear RELA intensity in MIA PaCa2 and PANC1 cells following siRNA and TNFα treatment.
(A, B) Nuclear RELA-GFP intensity measurements for cells at (A) 1 hr or (B) 12 hr following 10 ng/ml TNFα addition. n = 3 biological repeats, each with three technical/well replicates per siRNA, TNFα dose, and cell line. All data are normalised to the mean nuclear RELA intensity of the non-targeting control by experimental repeat, cell line and treatment (TNFα or control). Statistical results are shown for multiple Wilcoxon tests with Benjamini–Hochberg correction comparing technical replicates from each siRNA to the non-targeting siRNA control, independently by cell line and treatment (0 or 10 ng/ml TNFα). Blue boxplots represent statistically significant (p<0.05) results and grey boxplots show statistically non-significant results. Experimental repeats are depicted by circles (Rep 1), triangles (Rep 2), or squares (Rep 3). The nuclear RELA fold-change (rightmost facets in each graph) is calculated by dividing each measurement by the mean of the control (no TNFα) measurements by each siRNA.
Author response image 1.
Author response image 2.
Author response image 3.

Update of

  • doi: 10.1101/2022.01.19.476961

Similar articles

Cited by

References

    1. Alraies Z, Rivera CA, Delgado M-G, Sanséau D, Maurin M, Amadio R, Maria Piperno G, Dunsmore G, Yatim A, Lacerda Mariano L, Kniazeva A, Calmettes V, Sáez PJ, Williart A, Popard H, Gratia M, Lamiable O, Moreau A, Fusilier Z, Crestey L, Albaud B, Legoix P, Dejean AS, Le Dorze A-L, Nakano H, Cook DN, Lawrence T, Manel N, Benvenuti F, Ginhoux F, Moreau HD, P F Nader G, Piel M, Lennon-Duménil A-M. Cell shape sensing licenses dendritic cells for homeostatic migration to lymph nodes. Nature Immunology. 2024;25:1193–1206. doi: 10.1038/s41590-024-01856-3. - DOI - PMC - PubMed
    1. Ankers JM, Awais R, Jones NA, Boyd J, Ryan S, Adamson AD, Harper CV, Bridge L, Spiller DG, Jackson DA, Paszek P, Sée V, White MR. Dynamic NF-κB and E2F interactions control the priority and timing of inflammatory signalling and cell proliferation. eLife. 2016;5:e10473. doi: 10.7554/eLife.10473. - DOI - PMC - PubMed
    1. Ashall L, Horton CA, Nelson DE, Paszek P, Harper CV, Sillitoe K, Ryan S, Spiller DG, Unitt JF, Broomhead DS, Kell DB, Rand DA, Sée V, White MRH. Pulsatile stimulation determines timing and specificity of NF-kappaB-dependent transcription. Science. 2009;324:242–246. doi: 10.1126/science.1164860. - DOI - PMC - PubMed
    1. Baeuerle PA, Baltimore D. Activation of DNA-binding activity in an apparently cytoplasmic precursor of the NF-kappa B transcription factor. Cell. 1988;53:211–217. doi: 10.1016/0092-8674(88)90382-0. - DOI - PubMed
    1. Barr AR, Cooper S, Heldt FS, Butera F, Stoy H, Mansfeld J, Novák B, Bakal C. DNA damage during S-phase mediates the proliferation-quiescence decision in the subsequent G1 via p21 expression. Nature Communications. 2017;8:14728. doi: 10.1038/ncomms14728. - DOI - PMC - PubMed

MeSH terms