. 2024 Dec 5;26(12):2288-2304.
doi: 10.1093/neuonc/noae153.

Defective autophagy of pericytes enhances radiation-induced senescence promoting radiation brain injury

Affiliations

Defective autophagy of pericytes enhances radiation-induced senescence promoting radiation brain injury

Na Luo et al. Neuro Oncol. .

Abstract

Background: Radiation-induced brain injury (RBI) represents a major challenge for cancer patients undergoing cranial radiotherapy. However, the molecular mechanisms and therapeutic strategies of RBI remain inconclusive. With the continuous exploration of the mechanisms of RBI, an increasing number of studies have implicated cerebrovascular dysfunction as a key factor in RBI-related cognitive impairment. As pericytes are a component of the neurovascular unit, there is still a lack of understanding in current research about the specific role and function of pericytes in RBI.

Methods: We constructed a mouse model of RBI-associated cognitive dysfunction in vivo and an in vitro radiation-induced pericyte model to explore the effects of senescent pericytes on the blood-brain barrier (BBB) and normal central nervous system cells, even glioma cells. To further clarify the effects of pericyte autophagy on senescence, molecular mechanisms were explored at the animal and cellular levels. Finally, we validated the clearance of pericyte senescence by using a senolytic drug and all-trans retinoic acid to investigate the role of radiation-induced pericyte senescence.

Results: Our findings indicated that radiation-induced pericyte senescence plays a key role in BBB dysfunction, leading to RBI and subsequent cognitive decline. Strikingly, pericyte senescence also contributed to the growth and invasion of glioma cells. We further demonstrated that defective autophagy in pericytes is a vital regulatory mechanism for pericyte senescence. Moreover, autophagy activated by rapamycin could reverse pericyte senescence. Notably, the elimination of senescent cells by senolytic drugs significantly mitigated radiation-induced cognitive dysfunction.

Conclusions: Our results demonstrated that pericyte senescence may be a promising therapeutic target for RBI and glioma progression.

Keywords: autophagy; cellular senescence; pericyte; radiation-induced brain injury.


Conflict of interest statement

The authors declare that they have no known competing financial interests or personal relationships that could have appeared to influence the work reported in this paper.

Figures

Graphical Abstract
Graphical Abstract
Figure 1.
Figure 1.
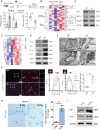
WBRT leads to blood-brain barrier (BBB) disruption and pericyte senescence. (A) Experimental design for irradiated mice. Cognitive memory was evaluated using the NOR test at 12 weeks post-irradiation. The percentage of new object preference (bottom left) and discrimination ratio (bottom right) were tested in NOR for control (Ctrl) and radiation (IR) mice. IR mice showed a significant preference for the old object A but not the new object C. Apparently, the ability of IR mice to discriminate novel objects was reduced; n = 5–6. (B) Differential gene expression (DGE) analyzed by bulk RNA-sequencing showed BBB-associated gene expression levels in between the Ctrl and IR mice brains in Heat map (n = 3). (C) Protein levels of BBB-related markers ZO-1, MMP9, pericyte marker PDGFRβ were analyzed in mice brains using western blotting; n = 3. (D) Heat map of brain bulk RNA-sequencing data demonstrating senescence-associated gene expression levels in Ctrl and IR mice; n = 3. (E) Protein levels of senescence-associated markers P16, P21, IL-1β, IL-6, and CCl2 were analyzed in mice brains using western blotting in Ctrl and IR groups; n = 3. (F) Electron microscopy revealed the localization of brain microvascular pericytes in a specific area. In the Ctrl group, the brain region exhibited an intact structure, characterized by normal pericyte nuclear morphology, intact cell membranes, and a normal peripheral neuropil structure. Conversely, the brain regions in the IR group displayed structural disorganization, swelling, and injured areas, including partial peripheral neuropil lysis. Additionally, the pericytes located next to the cerebral microvasculature in IR mice brains were filled with lysosomes. The bottom inset is a higher magnification of the boxed area. 5 μm (top) or 1 μm (bottom). (G) Representative immunofluorescence images of ctrl and IR mice brains stained with PDGFRβ (pericytes), P16 (senescence-associated marker), and DAPI (blue, nuclei). Scale bars, 100 μm (left) or 20 μm (right). Plot the pixel intensity along the white line from left to right to show the colocalization relationship between P16, PDGFRβ, and DAPI (middle). Quantifications show the proportion of P16+ PDGFRβ+/ PDGFRβ+ pericytes in the brain 3 months later after IR (right); n = 5. (H) SA-β-Gal activity was determined in HBVPs 5 days after ionizing radiation (10 Gy) in vitro. Representative images and quantitative datas for SA-β-Gal activity were shown. Scale bar, 200 μm (top) or 100 μm (bottom); n = 3. (I) Western blotting analyses were performed for P21 and P16 protein in HBVPs 5 days after ionizing radiation (10 Gy) in vitro; n = 3. All data are were represented as means ± SEMs; 2-tailed unpaired Student’s t-tests; **P ≤ .01, ***P ≤ .001, and ****P ≤ .0001.
Figure 2.
Figure 2.
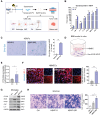
SASP factors secreted by irradiated pericytes are toxic to normal cells but favor tumor cells. (A) Experimental design for irradiated pericyte (PC) in vitro. HBVPs were exposed to radiation (single dose of 10 Gy), and then 5 days later the irradiated HBVP (IR HBVP) and nonirradiated HBVP (non-IR HBVP) supernatants were collected to test SASP factors. The supernatant from these cells was collected and resulting in HBVP supernatant (HBVP-S) and irradiated HBVP supernatant (HBVP-SIR) to coculture with central nervous system (CNS) cells (EC [endothelial cell], astrocyte, MG [microglia], OL [oligodendrocyte] and neuron cell) and tumor cell (glioma cell). Cells were cultured with normal fresh medium as the blank control group (Ctrl). HBVPs were collected to construct BBB model in vitro. (B) Secreted proteins in irradiated and non-irradiated HBVP supernatants were measured by ELISA kit; unpaired Student’s t-test; n = 3. (C) SA-β-Gal activity was determined in 5 days after treatment with HBVP-S and HBVP-SIR. Representative images and quantifications for SA-β-Gal activity were shown. Scale bar, 100 μm; unpaired Student’s t-test; n = 3. (D) Schematic overview of the BBB model in vitro. Human brain microvascular endothelial cells HBMEC were cultured on semipermeable filter inserts and HBVPs were incubated on the bottom side of the filters. In vitro BBB models were composed of HBMEC/IR HBVP and HBMEC/non-IR HBVP. (E) HBMEC/IR HBVP and HBMEC/non-IR HBVP cultured supernatants in BBB model filter inserts were collected. Barrier integrity of the standard was evaluated by permeability coefficient for FITC-BSA leakage assay between 2 groups; n = 3–5; unpaired Student’s t-tests. (F) HBMEC were subjected to staining for ZO-1 and Hoechst (nuclei) at day 48 hours after culture with HBVP-S and HBVP-SIR (left). Quantifications show the proportion of cells with frayed ZO-1 borders (right). Scale bar, 50 μm; n = 4; unpaired Student’s t-test. (G) Western blotting showed the levels of microglia activation marker CD68, inflammatory factor IL-6, M1 phenotype iNOS, and M2 phenotypes Arg1, CD206 in human microglial cell line HMO6. (H) Representative images from the transwell assay in the glioma cell line GL261 at day 48 hours after culture with HBVP-S and HBVP-SIR (left). Scale bar, 200 μm. The number of invasion cells were statistically analyzed (right); n = 3; 2-way ANOVA with Tukey’s post hoc test. All data are were represented as means ± SEMs; *P ≤ .05, **P ≤ .01, ***P ≤ .001, and ****P ≤ .0001.
Figure 3.
Figure 3.
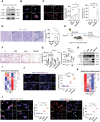
The effects of pericyte Autophagy Deficiency on WBRT-Induced Cognitive Impairment and Pericyte Senescence. (A) Western blotting was performed for autophagy-related markers P62, LC3BI, and LC3BII protein in HBVP 5 days after ionizing radiation (10 Gy) in vitro; n = 3; (B) HBVPs, both irradiated and unirradiated, were transfected with mRFP-GFP-LC3 after 48 hours administration of 50 nM BafilomycinA1 (BafA1) treatment for 4 hours to inhibit autophagic flux. Autophagic flux in HBVPs were examined using immunofluorescence confocal microscopy. Autophagosomes displayed both GFP+ and mRFP+ fluorescence (yellow–green), while autolysosomes exhibited only mRFP+ fluorescence (red) due to GFP quenching in the acidic lysosomal environment; C, control group; BafA1, BafilomycinA1 treatment group; IR, irradiation (10 Gy) treatment group; IR + BafA1, irradiated HBVPs following BafA1 treatment group; n = 3; scale bar, 20 μm. (C) Representative images and quantifications of immunofluorescence staining with P16 (green, senescence-related markers) and P62 (red, autophagy-related markers) were shown in irradiated and non-irradiated HBVP following BafA1 treatment; scale bar, 50 μm; n = 3. (D) Evaluation of SA-β-Gal senescence staining and quantifications in irradiated and non-irradiated HBVPs after BafA1 treatment; scale bar, 50 μm; n = 3. (E) Generation of PDGFRβ-Cre-Atg7flox/flox mice (Atg7-CKO, CKO group) model, in which the autophagy gene Atg7 was specifically knocked out in pericytes (PDGFRβ); Atg7flox/flox mice without PDGFRβ-Cre marker served as controls (Atg7-C, C group). After genetic identification, Atg7-C and Atg7-CKO mice, aged 6–8 weeks, were subjected to 15 Gy WBRT (C + IR and CKO + IR groups), and then behavioral tests (open field test [OF] and novel object recognition test [NOR]) were performed 12 weeks post-WBRT. (F) A behavioral trajectory was investigated in an open field test with 4 groups (C, CKO, C + IR, and CKO + IR groups) of mice; n = 5. (G) Percentage of new object preference (left). Quantification of discrimination ratio (right). n = 7–8. (H) Protein levels of autophagy-related markers (P62, LC3BI, and LC3BII) and senescence-associated markers (P16 and P21) were analyzed in mice brains using western blotting in C, CKO, C + IR, and CKO + IR groups for 12 weeks post-WBRT. Deletion of the autophagy gene Atg7 could prevent the conversion of LC3BI to LC3BII after autophagy activation. The results suggested that the hallmark Atg proteins P62 and LC3BII were changed, P62 was upregulated in the groups CKO, C + IR, and CKO + IR compared to group C, suggesting that autophagic degradation was blocked, and the expression of LC3BII was not upregulated in the group CKO + IR compared to the group C + IR, suggesting that autophagy Atg7 deletion also blocked the formation of LC3BII in the brain of mice after WBRT; n = 3. (I) A heat map of brain RNA-seq data illustrating the expression levels of senescence-related genes across C, CKO, C + IR and CKO + IR groups for 12 weeks post-WBRT; n = 3. (J) Representative immunofluorescence images of PDGFRβ (red, pericytes), P21 (gray, senescence-associated marker), and DAPI (blue, nuclei) were shown in C, CKO, C + IR and CKO + IR mice brains for 12 weeks post-WBRT. Scale bars, 20 μm. The proportion of P21+ PDGFRβ+/PDGFRβ+ pericytes was quantified; n = 5. (K) Heat map of brain RNA-seq data demonstrating myelination-associated gene expression levels in 4 groups; n = 3. (L) Representative immunofluorescence images and quantifications of Olig2 (orange, oligodendrocyte precursor cell (OPC)-associated marker), P16 (green, senescence-associated marker), and DAPI (blue, nuclei) were displayed in brain sections from mice. Representative images and quantifications of NG2 (orange, OPC-associated marker), P16 (green, senescence-associated marker), and DAPI (blue, nuclei) immunoreactivities were displayed in brain sections from mice. Scale bar, 50 μm; n = 5. All data are represented as means ± SEMs; 2-way ANOVA with Tukey’s post hoc test; *P ≤ .05, **P ≤ .01, ***P ≤ .001, and ****P ≤ .0001.
Figure 4.
Figure 4.
Activating Lysosomal Clearance Protein Aggregates by Rapamycin Reduces IR-Induced HBVP Senescence. (A) HBVPs were exposed to 10 Gy of radiation. At day 5 in culture, irradiated and non-irradiated HBVP were treated with 50 nM BafA1 for 4 hours or 50 nM BafA1 for 4 hours then washed twice with PBS, followed by 100 nM rapamycin (Rap) for 24 hours. Assessment of autophagic flux alterations in groups C, C + BafA1, C + BafA1 + Rap, IR, IR + BafA1, and IR + BafA1 + Rap using immunofluorescence. Autophagosomes displayed both GFP and mRFP fluorescence (yellow–green) or solely mRFP fluorescence (red) due to GFP quenching by lysosomal acidity. Therefore, an increase in the ratio of red to yellow–green fluorescence indicated an increase in autophagic flux. The transfected HBVP showed yellow–green fluorescence after BafA1 treatment because BafA1 mainly blocked the binding of autophagosomes to lysosomes, and LC3 was accumulated in autophagosomes. The HBVP showed an increase in the number of yellow–green and red spots after IR, suggesting an increase in the autophagic flux. The number of yellow–green spots did not increase in individual cells after BafA1 treatment, suggesting that autophagic flux was inhibited after IR, which could be attributed to lysosomal degradation dysfunction. Rapamycin treatment increased the ratio of red and yellow–green fluorescence, indicating that rapamycin-activated autophagy and enhanced autophagic flux after IR. Scale bar, 20 μm; n = 3. C, control group; C + BafA1, BafilomycinA1 treatment only group; C + BafA1 + Rap, C + BafA1 following Rapamycin group; IR, irradiation (10 Gy) treatment group; IR + BafA1, irradiated HBVP following BafA1 treatment group; IR + BafA1 + Rap, IR + BafA1 following Rapamycin group. (B) Representative images and quantifications of P16 and P62 immunofluorescence in HBVPs from 4 groups; Scale bars, 50 μm; n = 3. (C) Representative images and quantifications of SA-β-Gal-specific senescence staining in 4 groups. Scale bar, 100 μm; n = 3. (D) Cell proliferation was assessed using EdU incorporation assay. Scale bars, 50 μm; n = 3. (E) An acidic organelle-specific fluorescent probe, LysoTracker, was used to label the HBVP lysosomes. Images and mean intensity of LysoTracker-positive cells; n = 3. (F) During cellular senescence, these oxidized, misfolded, cross-linked protein aggregations gradually accumulate due to progressive disruption of pathways that maintain cellular homeostasis and repair, which in turn directly disrupts homeostasis, leading to further dysfunction. Shown are representative immunofluorescence images and quantifications of Proteostat positive LAMP-1 cells in HBVP. Cells were stained with LAMP-1(green, lysosomal membranes), Proteostat (red, protein aggregates), and Hoechst (blue, nuclei). Scale bars, 50 μm; n = 3; 2-way ANOVA with Tukey’s post hoc test. (G) Schematic diagram of the mechanism by which autophagy modulates pericyte senescence following ionizing radiation (IR). Firstly, autophagic degradation involves the cleavage of LC3 precursor proteins to cytosolic LC3-I, which is activated by Atg7 to form LC3-II, coupling with phosphatidylethanolamine (PE) on autophagosome membranes. P62 facilitates the incorporation of ubiquitylated substrates (Ub) into the autophagosome. LC3-II binds to the lysosomal membrane (LAMP1), where it fuses with lysosomes to form autophagic lysosomes. This fusion enables the degradation of abnormal protein aggregates by the action of lysosomal H+ ions. Secondly, inhibition of autophagy, either by Bafilomycin A1 interfering with autophagosome-lysosome fusion or Atg7 knockout preventing LC3I to LC3II conversion, results in protein aggregate accumulation, promoting pericyte senescence. Conversely, enhancing autophagy with Rapamycin reverses these effects, reducing senescence by facilitating the degradation process. All data are represented as means ± SEMs; 2-way ANOVA with Tukey’s post hoc test; *P ≤ .05, **P ≤ .01, ***P ≤ .001, and ****P ≤ .0001.
Figure 5.
Figure 5.
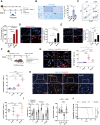
D + Q treatment ameliorates radiation-induced pericytes senescence. (A) Experimental design for panels in vitro. HBVPs were irradiated with 10 Gy, and 5 days later were treated with D + Q (at a dosage of 1 µM dasatinib and 20 µM quercetin) for 24 hours, and then replaced with the fresh medium (FM) for 24 hours before senescence-related experiments. (B) Representative images and quantifications of SA-β-Gal activity were shown in vitro. Scale bar, 200 μm (left) or 100 μm (right); n = 3. Control group (C); D + Q treatment only group (C + DQ); irradiation treatment group (IR); irradiated HBVP following D + Q treatment group (IR + DQ). (C) FACS analysis images were shown in vitro (left). The total percentages of early apoptotic and late apoptotic/necrotic cells were quantified (right; n = 3). (D) Representative images and quantifications of immunofluorescence staining with Caspase3 and nuclei (DAPI) were displayed in HBVP. Scale bar, 50 μm; n = 3. (E) Representative images and quantifications for cell proliferation Edu (red) and Hoechst (blue, nuclei) staining were shown in HBVP. Scale bar, 50 μm; n = 3. (F) Experimental design for administration in irradiated mice. The C57BL/6J mice were irradiated with 15 Gy whole-brain radiation followed by oral administration of dasatinib (12 mg/kg) and quercetin (50 mg/kg) for 2 weeks starting at week 8 post-WBRT for 5 consecutive days per week. Cognitive memory was evaluated using the NOR test at 12 weeks post-irradiation. (G) Representative images show PDGFRβ (red, pericytes), P21 (green, senescence-associated marker), Caspase3 (gray, apoptosis-associated marker), and DAPI (blue, nuclei) immunoreactivities in brain sections from IR mice treated with vehicle or D + Q. Scale bars, 10 μm. The proportion of P21+ PDGFRβ+/PDGFRβ+ pericytes and Caspase3+ PDGFRβ+/PDGFRβ+ pericytes was quantified (right). Control group (C), D + Q treatment only group (C + DQ), irradiation (15 Gy) treatment group (IR), WBRT following D + Q treatment group (IR + DQ); n = 5. (H) Representative images show PDGFRβ (red, pericytes), Ki67 (green, senescence-associated marker), and DAPI (blue, nuclei) immunoreactivities in brain sections from IR mice treated with vehicle or D + Q. Scale bars, 50 μm(top) or 20 μm (bottom). Quantifications showed the proportion of ki67+PDGFRβ+/PDGFRβ+ pericytes; n = 4–5. (I) Percentage of new object C preference for vehicle or D + Q treatment irradiated mice in novel object recognition test (left). Quantification of discrimination ratio (right); n = 9–14. (J) The survival curve indicated the survival rates in 4 groups; n = 8–16. All data are represented as means ± SEMs; 2-way ANOVA with Tukey’s post hoc test; *P ≤ .05, **P ≤ .01, ***P ≤ .001, and ****P ≤ .0001.
Figure 6.
Figure 6.
Retinoic acid (RA) treatment ameliorates radiation-induced pericytes senescence. (A) Experimental design for panels in vitro. HBVPs were irradiated with a dose of 10 Gy and treated with RA (retinoic acid) at doses of 0.01, 0.1, and 1 μM starting 24 hours before irradiation, administered daily until day 5 after IR. Senescence-associated experimental assays were conducted 5 days post-irradiation. (B) Western blot analysis of senescence-related markers P16 and P21 in cells treated with 0.01, 0.1, or 1 μM RA in irradiated HBVP. (C) Representative images of SA-β-Gal activity in irradiated HBVP treated with vehicle or RA (0.01μM) were shown (left). Scale bar, 100 μm (left) or 200 μm (right). The SA-β-Gal positive cells were quantified (right); n = 3. Control group (C); RA treatment only group (C + RA); irradiation treatment group (IR); RA treatment irradiated group (IR + RA). (D) Representative images for cell proliferation Edu and Hoechst (nuclei) staining were shown (left). Scale bar, 50 μm. The Edu-positive cells were quantified (right); n = 3. (E) The HBVP was exposed to 10 Gy and treated with RA (0.01 μM) 24 hours before IR until day 5 after IR in vitro. Supernatants were collected from these cells and mixed with fresh medium in a ratio of 1:1 in order to obtain Ctrl, RA supernatants, IR supernatants, and IR + RA supernatants. After 5 days of supernatant treatment, SA-β-Gal activity was measured. Representative images and quantifications of SA-β-Gal activity are shown. Scale bar, 100 μm (left) or 200 μm; n = 3. (F) Experimental design of irradiated mice for drug administration in vivo. (G) Percentage of new object preference (preference for the new object C but not the old object A) for vehicle or RA treatment irradiated mice in novel object recognition test (left). Quantification of discrimination ratio (right); n = 5–8. control group (C), Control group (C); RA treatment only group (C + RA); irradiation treatment group (IR); RA treatment irradiated group (IR + RA). (H) The survival curve indicates the survival rates of vehicle or RA treatment irradiated mice; n = 7–16. (I) Protein levels of BBB-related markers ZO-1, VE-cadherin and senescence-associated markers P16, P21 were analyzed in mice brains using western blotting in 4 groups; n = 3. (J) Heat map of brain RNA-SEQ data demonstrating pericytes-associated gene and senescence-associated gene expression levels in 4 groups; n = 3. (K) Representative images of PDGFRβ (red, pericytes), p16 (green, senescence-associated marker) and DAPI (blue, nuclei) immunoreactivities were displayed in brain sections from IR mice treated with vehicle or RA. Scale bars, 20 μm (left) or 100 μm (right). Quantifications for the proportion of P16+ PDGFRβ+/PDGFRβ+ pericytes in mice brains were shown; n = 3–5. All data are represented as means ± SEMs; 2-way ANOVA with Tukey’s post hoc test; *P ≤ .05, **P ≤ .01, ***P ≤ .001, and ****P ≤ .0001.

References

    1. De Ruysscher D, Niedermann G, Burnet NG, et al.Radiotherapy toxicity. Nat Rev Dis Primers. 2019;5(1):13. - PubMed
    1. Wilke C, Grosshans D, Duman J, Brown P, Li J.. Radiation-induced cognitive toxicity: Pathophysiology and interventions to reduce toxicity in adults. Neuro Oncol. 2018;20(5):597–607. - PMC - PubMed
    1. Makale MT, McDonald CR, Hattangadi-Gluth JA, Kesari S.. Mechanisms of radiotherapy-associated cognitive disability in patients with brain tumours. Nat Rev Neurol. 2017;13(1):52–64. - PMC - PubMed
    1. Cheng J, Jiang J, He B, et al.A phase 2 study of thalidomide for the treatment of radiation-induced blood-brain barrier injury. Sci Transl Med. 2023;15(684):eabm6543. - PubMed
    1. Sweeney MD, Kisler K, Montagne A, Toga AW, Zlokovic BV.. The role of brain vasculature in neurodegenerative disorders. Nat Neurosci. 2018;21(10):1318–1331. - PMC - PubMed

MeSH terms