. 2024 Aug 7;73(10):208.
doi: 10.1007/s00262-024-03786-3.

DNA hypo-methylation and expression of GBP4 induces T cell exhaustion in pancreatic cancer

Affiliations

DNA hypo-methylation and expression of GBP4 induces T cell exhaustion in pancreatic cancer

Yesiboli Tasiheng et al. Cancer Immunol Immunother. .

Abstract

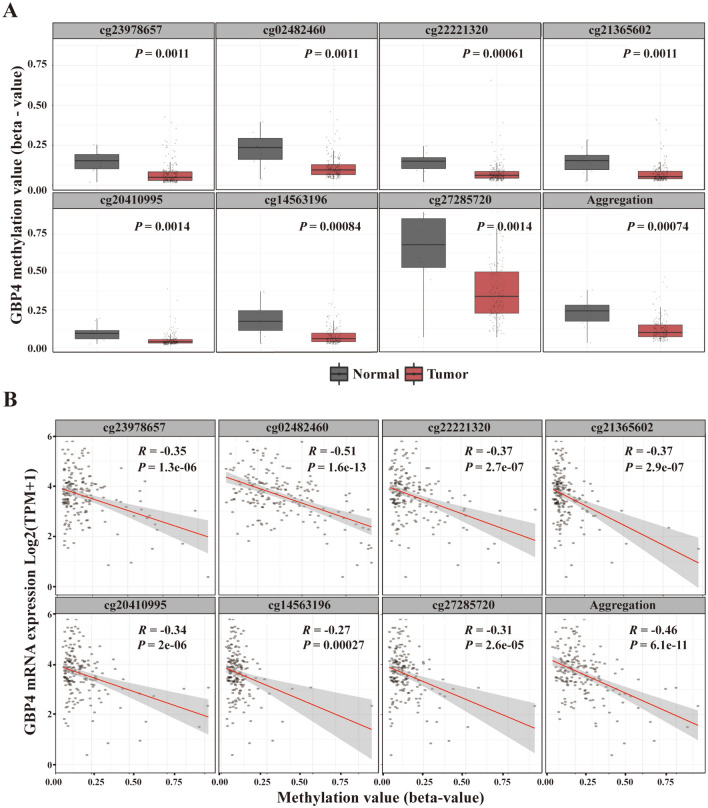
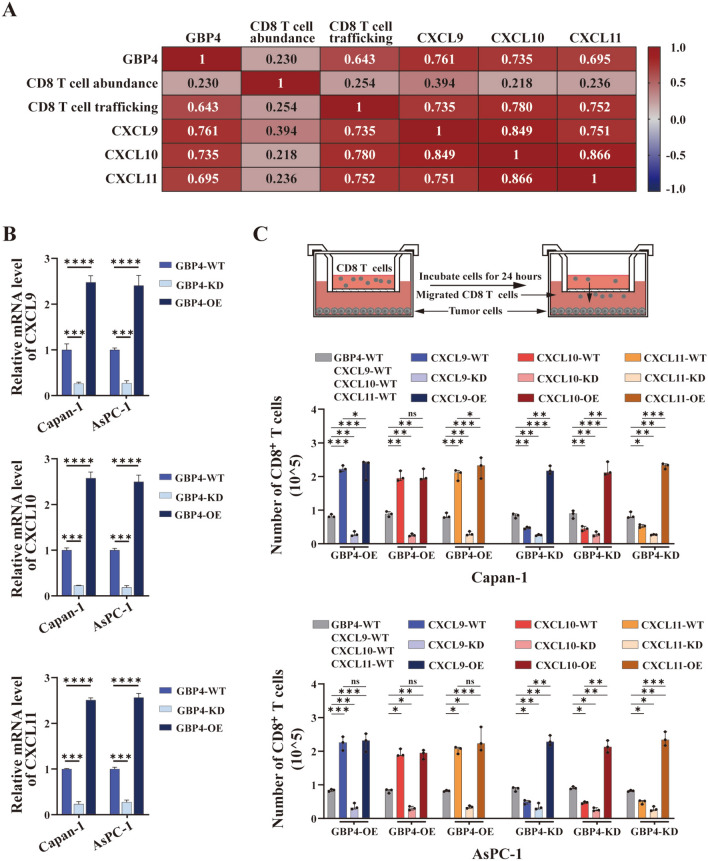
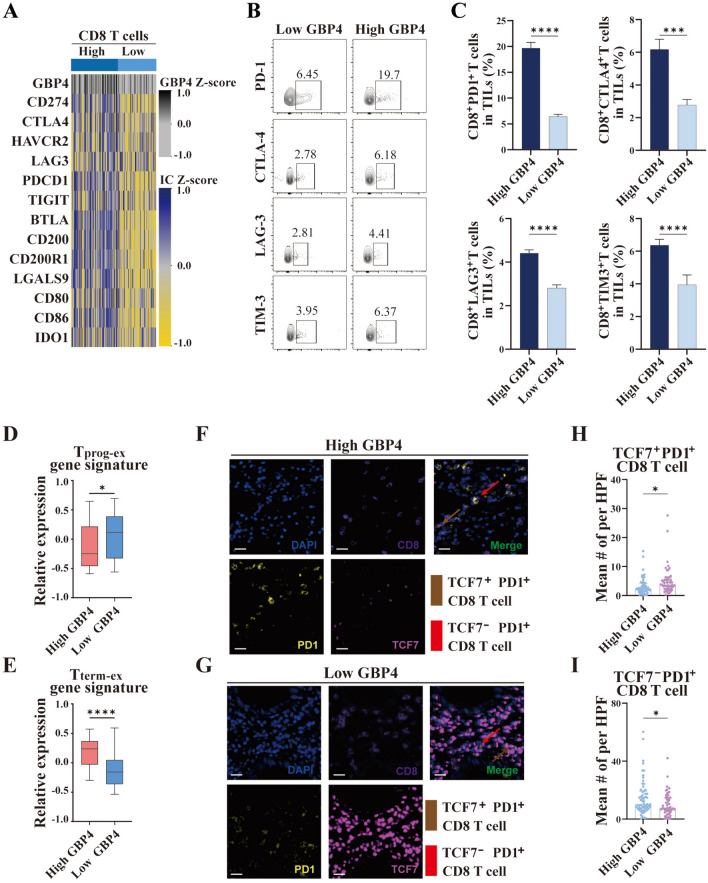
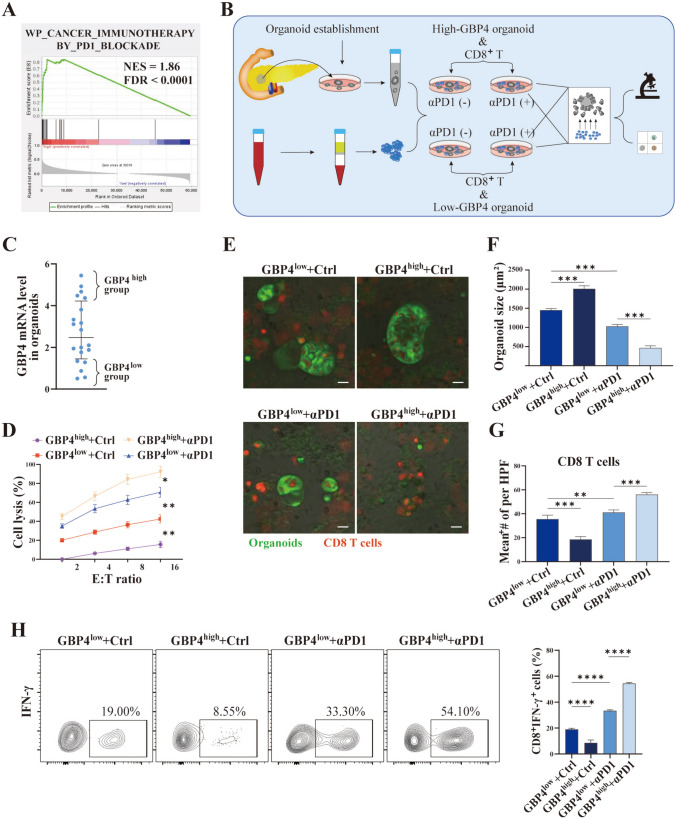
Immunotherapy for pancreatic ductal carcinoma (PDAC) remains disappointing due to the repressive tumor microenvironment and T cell exhaustion, in which the roles of interferon-stimulated genes were largely unknown. Here, we focused on a typical interferon-stimulated gene, GBP4, and investigated its potential diagnostic and therapeutic value in pancreatic cancer. Expression analysis on both local samples and public databases indicated that GBP4 was one of the most dominant GBP family members present in the PDAC microenvironment, and the expression level of GBP4 was negatively associated with patient survival. We then identified DNA hypo-methylation in regulatory regions of GBP4 in PDAC, and validated its regulatory role on GBP4 expression via performing targeted methylation using dCas9-SunTag-DNMAT3A-sgRNA-targeted methylation system on selected DNA locus. After that, we investigated the downstream functions of GBP4, and chemotaxis assays indicated that GBP4 overexpression significantly improved the infiltration of CD8+T cells, but also induced upregulation of immune checkpoint genes and T cell exhaustion. Lastly, in vitro T cell killing assays using primary organoids suggested that the PDAC samples with high level of GBP4 expression displayed significantly higher sensitivity to anti-PD-1 treatment. Taken together, our studies revealed the expression patterns and epigenetic regulatory mechanisms of GBP4 in pancreatic cancer and clarified the effects of GBP4 on T cell exhaustion and antitumor immunology.

Keywords: DNA methylation; GBP4; PD-1 blockade; Pancreatic ductal adenocarcinoma; T cell exhaustion.


Conflict of interest statement

All authors contributed to the article and approved the submitted version, and no conflict of interest exists in the submission of this manuscript.

Figures

Fig. 1
Fig. 1
Overexpression of GBP4 is an independent factor for unfavorable prognosis in PDAC patients. A The expression of GBP4 mRNA in PAAD tissues and normal pancreatic tissues from TCGA database. B The expression of GBP4 protein in PAAD tissues and normal pancreatic tissues from CPTAC database. C Representative immunohistochemical (IHC) staining images of GBP4 expression in tumor tissue and adjacent normal tissue of PDAC patient. D The expression of GBP4 between tumor and adjacent normal tissues from 52 patients by quantitative analysis of IHC score. E The overall survival curves of the high-GBP4 and low-GBP4 expression PDAC patients from TCGA database. F Representative IHC staining images of the high- and low-GBP4 expression in tumor tissues of PDAC patients. G The overall survival curves of the high-GBP4 and low-GBP4 expression PDAC patients from our cohort H Univariate Cox regression for screening the prognostic factors of PDAC. I Multivariate Cox regression for screening the prognostic factors of PDAC. ****P < 0.0001
Fig. 2
Fig. 2
The upregulation of GBP4 in PDAC may be associated with the hypo-methylation of seven CpGs in its regulatory regions. A Comparison of the methylation status of CpG sites between tumor tissues from TCGA database and normal tissues from GTEx database. B Correlation analysis between the methylation status of CpG sites and GBP4 expression in PDAC from TCGA database. The data are shown as mean ± SD
Fig. 3
Fig. 3
GBP4 showed hypo-methylated status in PDAC. A Chromosomal distribution of the CpG sites in the regulatory regions of GBP4, which was visualized by MethPrime, and the primers for bisulfite sequencing. B Representative methylation profiles of CpG sites in the regulatory regions of GBP4 from adjacent normal tissues and PDAC tissues detected using bisulfite genomic sequencing. Open circles indicate unmethylated CpG sites and closed circles indicate methylated CpG sites. C Representative methylation profiles of CpG sites in the regulatory regions of GBP4 from normal pancreatic ductal epithelial cells (HPDE6-C7) and PDAC cells (Capan-1, CFPAC-1, AsPC-1, and Mia Paca-2) detected using bisulfite genomic sequencing. D Differentially methylated CpG sites of GBP4 between normal pancreatic ductal epithelial cells and PDAC cells. The data are shown as mean ± SD
Fig. 4
Fig. 4
The expression of GBP4 in PDAC cells was downregulated by targeted methylation with dCas9-SunTag-DNMAT3A-sgGBP4 system. A Schematic of dCas9-SunTag-DNMT3A1-sgGBP4. Deactivated Cas9 (dCas9) was fused to SunTag epitopes and the single-chain variable fragment (scFv) was fused to green fluorescent protein (GFP) and DNMT3A1. Multiple copies of scFvDNMT3A1 can be guided by single guide RNA (sgRNA) to recognize specific loci and methylate regions of interest. B The recognition sites of sgRNAs used to guide the dCas9-SunTag-DNMT3A1 in the regulatory regions of human GBP4, with arrows (aligned to the magnified regions) indicating 20 bp binding sites of sgRNAs. Arrows point toward the PAM sequence. C, D The methylation status of CpG sites in the regulatory regions of GBP4 gene in Capan-1 cells and AsPC-1 cells were analyzed using bisulfite genomic sequencing after transfection using the dCas9-SunTag-DNMAT3A-sgGBP4 system, respectively. E The mRNA expression of GBP4 in Capan-1 cells and AsPC-1 cells were measured using quantitative real-time PCR after transfection using the dCas9-SunTag-DNMAT3A-sgGBP4 system, respectively. The data are shown as mean ± SD; *P < 0.05, **P < 0.01, ***P < 0.001, ****P < 0.0001
Fig. 5
Fig. 5
The expression of GBP4 on tumor cells improved the infiltration of CD8+ T cells in PDAC tissues. A Correlation analysis between mRNA expression of GBP4, abundance of CD8+T cells, trafficking level of CD8 + T cells, and chemokines (CXCL9, CXCL10, and CXCL11) in the PDAC samples from TCGA cohort (n = 178). B The effects of GBP4 overexpression or GBP4 silencing on the mRNA expression of chemokines (CXCL9, CXCL10, and CXCL11) were detected by qRT-PCR. C Chemotaxis assay analysis of CD8+ T cell migration ability in the supernatants of tumor cells with or without GBP4, CXCL9, CXCL10, or CXCL11 overexpression, and with or without GBP4, CXCL9, CXCL10, or CXCL11 silenced. The data are shown as mean ± SD; ****P < 0.0001; WT, wild type; OE, overexpression; KD, knock down
Fig. 6
Fig. 6
The expression of GBP4 on tumor cells improved the exhaustion of tumor infiltrating CD8 + T cells in PDAC tissues A Heatmap showing the relationship between GBP4, CD8+ T cells, and immune checkpoint inhibitors. B Representative frequencies of immune checkpoint (PD-1, CTLA-4, TIM-3, and LAG-3) positive CD8+ TILs from surgically resected PDAC tissue samples in a flow cytometric dot plot. C Comparison of the frequencies of PD-1+CD8+ TILs, CTLA-4+CD8+ TILs, TIM-3+ CD8+ TILs, and LAG-3+CD8+ TILs between GBP4 high and GBP4 low expressing PDAC tissue samples. D Comparison of the progenitor exhausted CD8+T cell (Tprog-ex) gene signature score between GBP4 high and GBP4 low expressing PDAC samples from TCGA cohort. E Comparison of the terminally exhausted CD8 + T cell (Tterm-ex) gene signature score between GBP4 high and GBP4 low expressing PDAC samples from TCGA cohort. F Representative images of mIHC staining of Tprog-ex (TCF7+PD-1+ CD8+T cells) and Tterm-ex (TCF7PD-1+ CD8+T cells) on GBP4 high and GBP4 low expressing PDAC samples from our cohort. G Comparison of the numbers of TCF7+PD-1+ CD8+T cells and TCF7PD-1+ CD8+T cells between GBP4 high and GBP4 low expressing PDAC samples from our cohort. *P < 0.05, ***P < 0.001, ****P < 0.0001
Fig. 7
Fig. 7
The expression of GBP4 on tumor cells improved the sensitivity of pancreatic cancer to PD-1 blockade therapy A GSEA analysis indicated that the gene set representing the effectiveness of anti-PD-1 therapy was significantly enriched in the PDAC samples with high-GBP4 expression based on data from the TCGA database. B A schematic representing the work flow for evaluating the impact of GBP4 on sensitivity of tumors to PD-1 blockade therapy using patient-derived pancreatic cancer organoid-T cell coculture system. B The mRNA expression of GBP4 in patient-derived pancreatic cancer organoids were measured using quantitative real-time PCR. Organoids were stratified into two groups based on the mRNA level of GBP4: GBP4 low organoids for the first quartile (n = 5) and GBP4 high organoids for the fourth quartile (n = 5). C Cytotoxicity assay using patient-derived pancreatic cancer organoids as targets. CD8 + T cells were cocultured with GBP4 high organoids or GBP4 low organoids in the absence or presence of anti-PD-1 antibody at the indicated effector-to-target (E/T) ratios for 48 h. D The immunofluorescence images showed the cytotoxicity of CD8+ T cells on the GBP4 high organoids or GBP4 low organoids in the absence or presence of anti-PD-1 antibody. Organoids (green) and CD8+ T cells (red) are shown. Scale bars, 50 μm. E The size of GBP4 high organoids or GBP4 low organoids treated with control or anti-PD-1 antibody in the coculture with CD8+ T cells. Optical images were analyzed using ImageJ to determine the organoid size. F The mean number of CD8+ T cells in per HPF in the coculture with GBP4 high organoids or GBP4 low organoids in the absence or presence of anti-PD-1 antibody. G Representative fow cytometry dot plots and statistical analysis of percentages of CD8+IFNγ+T cells in the coculture with GBP4 high organoids or GBP4 low organoids in the absence or presence of anti-PD-1 antibody. The data are shown as mean ± SD. *P < 0.05, **P < 0.01, ***P < 0.001, ****P < 0.0001; αPD-1, anti-PD-1 antibody

Similar articles

Cited by

References

    1. Klein AP (2021) Pancreatic cancer epidemiology: understanding the role of lifestyle and inherited risk factors. Nat Rev Gastroenterol Hepatol 18:493–502 10.1038/s41575-021-00457-x - DOI - PMC - PubMed
    1. Siegel RL, Miller KD, Wagle NS, Jemal A (2023) Cancer statistics, 2023. CA Cancer J Clin 73:17–48 10.3322/caac.21763 - DOI - PubMed
    1. Kolbeinsson HM, Chandana S, Wright GP, Chung M (2023) Pancreatic cancer: a review of current treatment and novel therapies. J Invest Surg 36:2129884 10.1080/08941939.2022.2129884 - DOI - PubMed
    1. Hao W, Zhang Y, Dou J, Cui P, Zhu J (2023) S100P as a potential biomarker for immunosuppressive microenvironment in pancreatic cancer: a bioinformatics analysis and in vitro study. BMC Cancer 23:997 10.1186/s12885-023-11490-1 - DOI - PMC - PubMed
    1. Faraoni EY et al (2023) CD73-Dependent Adenosine Signaling through Adora2b Drives Immunosuppression in Ductal Pancreatic Cancer. Cancer Res 83:1111–1127 10.1158/0008-5472.CAN-22-2553 - DOI - PMC - PubMed

MeSH terms