. 2024 Aug 7;40(1):66.
doi: 10.1007/s10565-024-09897-y.

Antitumorigenic potential of Lactobacillus-derived extracellular vesicles: p53 succinylation and glycolytic reprogramming in intestinal epithelial cells via SIRT5 modulation

Affiliations

Antitumorigenic potential of Lactobacillus-derived extracellular vesicles: p53 succinylation and glycolytic reprogramming in intestinal epithelial cells via SIRT5 modulation

Jingbo Zhang et al. Cell Biol Toxicol. .

Abstract

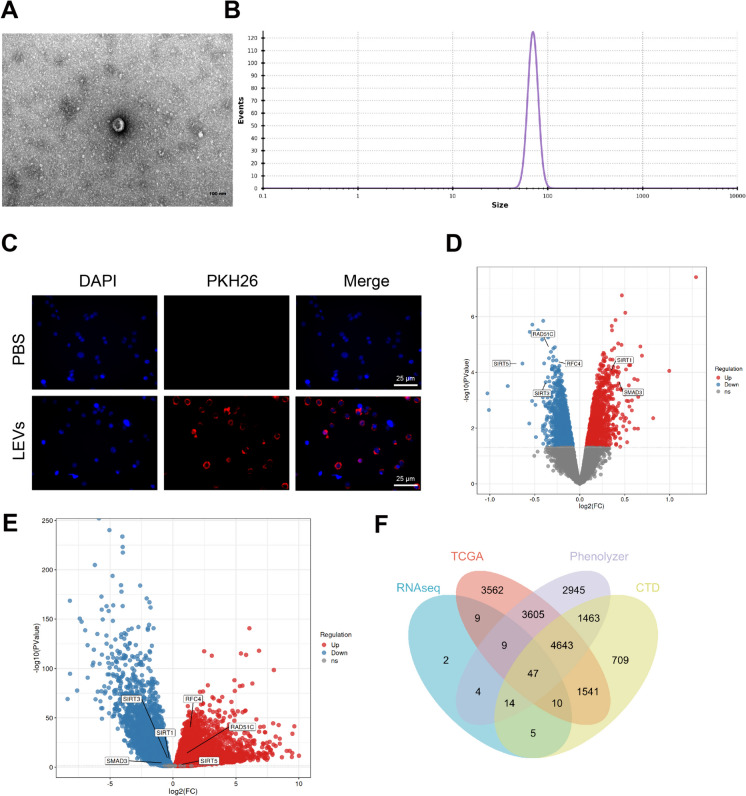
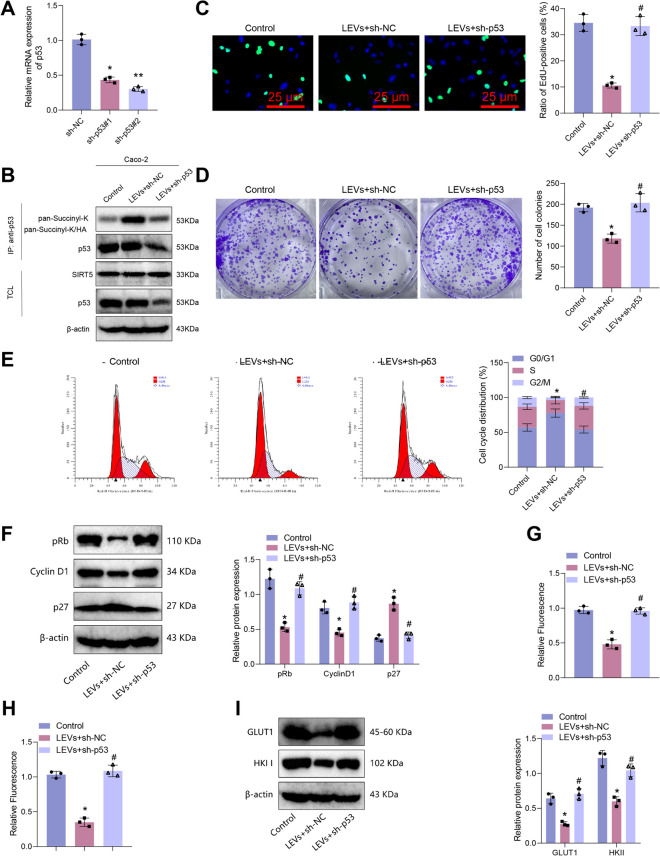
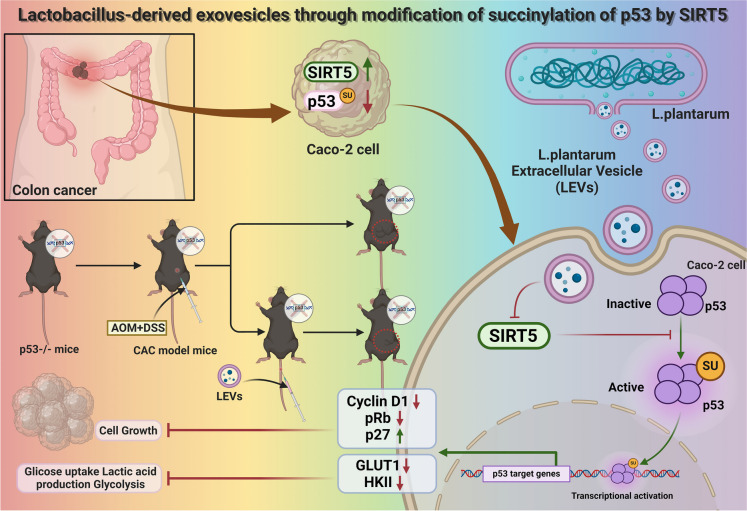
Objective: Colorectal cancer progression involves complex cellular mechanisms. This study examines the effects of Lactobacillus plantarum-derived extracellular vesicles (LEVs) on the SIRT5/p53 axis, focusing on glycolytic metabolic reprogramming and abnormal proliferation in intestinal epithelial cells.

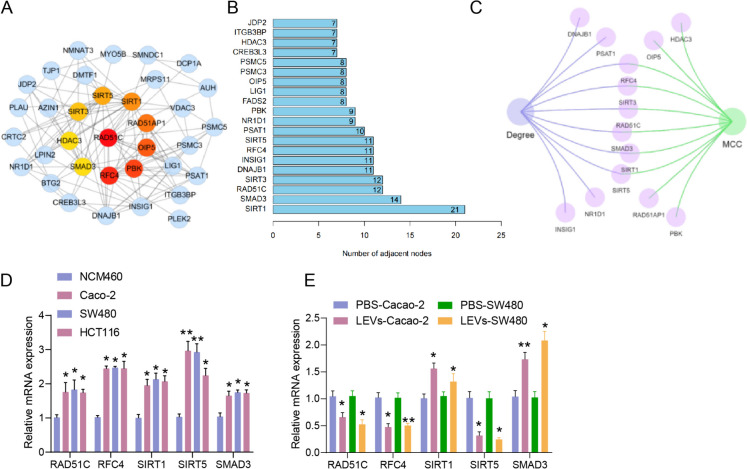
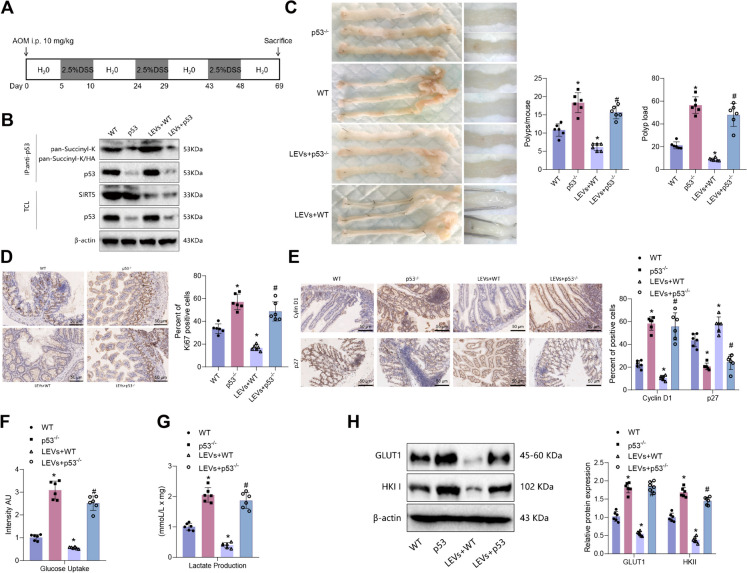
Methods: LEVs were isolated from Lactobacillus plantarum and incubated with Caco-2 cells. Differential gene expression was analyzed through RNA sequencing and compared with TCGA-COAD data. Key target genes and pathways were identified using PPI network and pathway enrichment analysis. Various assays, including RT-qPCR, EdU staining, colony formation, flow cytometry, and Western blotting, were used to assess gene expression, cell proliferation, and metabolic changes. Co-immunoprecipitation confirmed the interaction between SIRT5 and p53, and animal models were employed to validate in vivo effects.

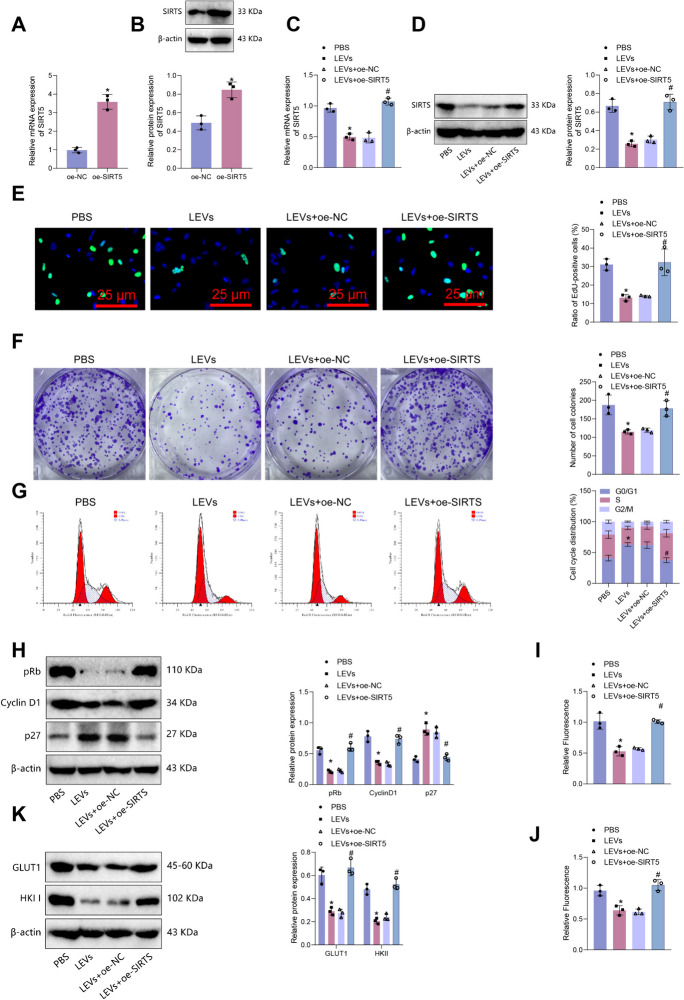
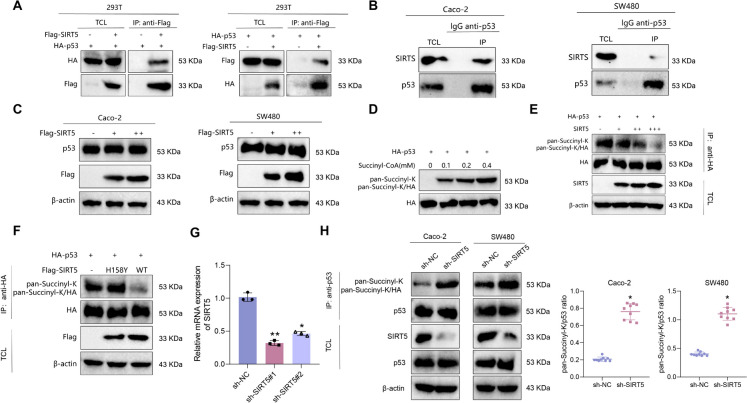
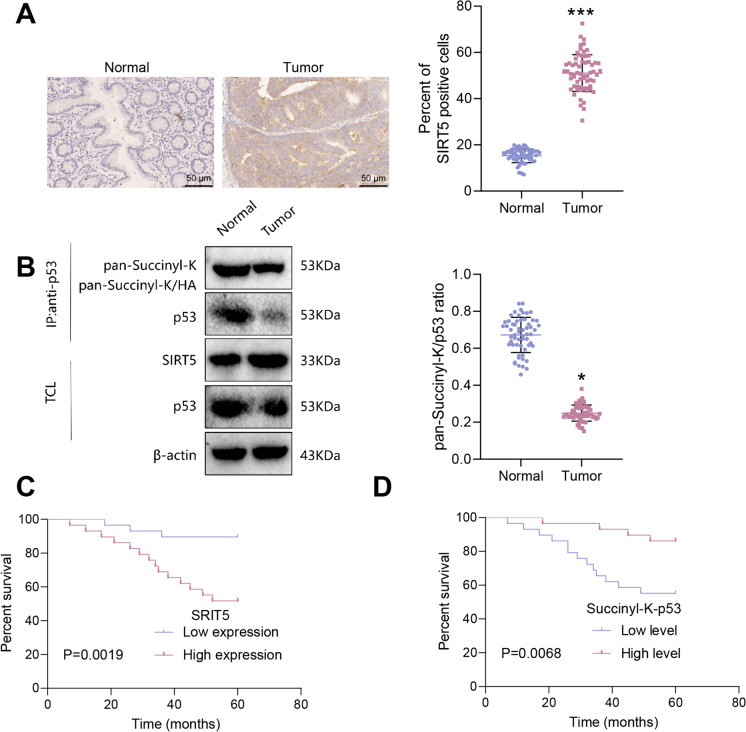
Results: Bioinformatics analysis indicated the SIRT5/p53 axis as a critical pathway in LEVs' modulation of colorectal cancer. LEVs were found to inhibit colorectal cancer cell proliferation and glycolytic metabolism by downregulating SIRT5, influencing p53 desuccinylation. In vivo, LEVs regulated this axis, reducing tumor formation in mice. Clinical sample analysis showed that SIRT5 and p53 succinylation levels correlated with patient prognosis.

Conclusion: Lactobacillus-derived extracellular vesicles play a pivotal role in suppressing colonic tumor formation by modulating the SIRT5/p53 axis. This results in decreased glycolytic metabolic reprogramming and reduced proliferation in intestinal epithelial cells.

Keywords: Lactobacillus; Colorectal cancer; Extracellular vesicles; Palmitoylation modification; SIRT5; p53.


Conflict of interest statement

The authors declare no competing interests.

The author declares no conflict of interest.

Figures

Fig. 1
Fig. 1
Key Genes Regulating Colorectal Cancer Progression Selected through Bioinformatics Analysis of LEVs. Note: (A) Morphological characteristics of LEVs analyzed by transmission electron microscopy (scale bar = 50 nm); (B) Particle size of LEVs measured by NTA; (C) Immunofluorescence detection of LEVs uptake by Caco-2 cells (scale bar = 25 μm), DAPI (blue) staining represents cell nuclei, PKH26 (red) represents LEVs; (D) Volcano plot showing differentially expressed genes in Caco-2 cells treated with and without LEVs, with each group consisting of four samples; (E) Volcano plot showing differentially expressed genes in TCGA-COAD high-throughput sequencing dataset, Normal group, n = 41, Tumor group, n = 483; (F) Venn diagram showing the intersection of differentially expressed genes in RNAseq and TCGA-COAD datasets with colorectal cancer-related genes in Phenolyzer and CTD databases
Fig. 2
Fig. 2
Target Genes Regulating Colorectal Cancer Progression Selected through Bioinformatics Analysis of LEVs—SIRT5. Note: (A) The interactive network of the top 10 core proteins encoded by the 47 intersecting genes following MCC sorting, marked in red in the right panel; (B) Bar graph showing the Degree ranking of proteins encoded by the 47 intersecting genes, with the top 20 proteins displayed; (C) Venn diagram showing the intersection network of Degree and top 10 proteins ranked by MCC; (D) RT-qPCR detection of mRNA expression of RAD51C, RFC4, SIRT1, SIRT5, and SMAD3 in human normal colonic mucosal cells and various colorectal cancer cell lines, * indicates P < 0.05 compared to NCM460 cells, ** indicates P < 0.01 compared to NCM460 cells; (E) RT-qPCR detection of mRNA expression of RAD51C, RFC4, SIRT1, SIRT5, and SMAD3 in Caco-2 and SW480 cells treated with LEVs, * indicates P < 0.05 compared to PBS group, ** indicates P < 0.01 compared to PBS group. Cell experiments were repeated three times
Fig. 3
Fig. 3
The Effect of LEVs-Mediated SIRT5 Expression Regulation on Proliferation and Glycolysis in Caco-2 Colorectal Cancer Cells. Note: (A-B) RT-qPCR and Western blot detection of SIRT5 mRNA and protein expression in Caco-2 cells overexpressing SIRT5; (C-D) RT-qPCR and Western blot detection of SIRT5 mRNA and protein expression in different groups of Caco-2 cells; (E) EdU staining to detect proliferation of different groups of Caco-2 cells (scale bar = 25 μm); (F) Clonogenic assay to detect colony formation of different groups of Caco-2 cells; (G) Flow cytometry analysis to detect cell cycle changes in different groups of Caco-2 cells; (H) Western blot detection of expression changes of cell cycle-related proteins in different groups of Caco-2 cells; (I) Glucose uptake in different groups of Caco-2 cells; (J) Lactate generation in different groups of Caco-2 cells; (K) Western blot detection of expression of glycolysis rate-limiting enzymes in different groups of Caco-2 cells. * indicates P < 0.05 compared to oe-NC or PBS group, # indicates P < 0.05 compared to LEVs + oe-NC group. Cell experiments were repeated three times
Fig. 4
Fig. 4
SIRT5-Mediated Depsuccinylation of p53. Note: (A) Co-IP experiment to detect the interaction between exogenous SIRT5 and p53 in 293 T cells; (B) Co-IP experiment to detect the interaction between endogenous SIRT5 and p53 in Caco-2 and SW480 cells; (C) Western blot detection of SIRT5 and p53 protein expression in Caco-2 and SW480 cells overexpressing SIRT5 (Flag-SIRT5); (D) Western blot detection of succinylation levels of p53 in 293 T cells after succinyl-CoA treatment; (E) Co-IP experiment to detect the desuccinylation effect of overexpressed SIRT5 on p53 in 293 T cells; (F) Co-IP experiment to detect the effect of co-transfection of HA-p53 with Flag-SIRT5 or its enzymatically deficient mutant H158Y on p53 succinylation levels in 293 T cells; (G) RT-qPCR detection of SIRT5 knockdown efficiency, * indicates P < 0.05 compared to sh-NC group, ** indicates P < 0.01 compared to sh-NC group; (H) Co-IP experiment to detect the effect of SIRT5 knockdown on p53 succinylation levels in Caco-2 and SW480 cells. TCL: total cell lysate; IP: immunoprecipitation. Cell experiments were repeated three times
Fig. 5
Fig. 5
The Effect of LEVs-Mediated SIRT5/p53 Axis on Proliferation and Glycolysis in Caco-2 Colorectal Cancer Cells. Note: (A) RT-qPCR detection of p53 knockdown efficiency; (B) Co-IP experiment to detect succinylation levels of p53 in different groups of Caco-2 cells; (C) EdU staining to detect proliferation of different groups of Caco-2 cells (scale bar = 25 μm); (D) Clonogenic assay to detect colony formation of different groups of Caco-2 cells; (E) Flow cytometry analysis to detect cell cycle changes in different groups of Caco-2 cells; (F) Western blot detection of expression changes of cell cycle-related proteins in different groups of Caco-2 cells; (G) Glucose uptake in different groups of Caco-2 cells; (H) Lactate generation in different groups of Caco-2 cells; (I) Western blot detection of expression of glycolysis rate-limiting enzymes in different groups of Caco-2 cells. * indicates P < 0.05 compared to sh-NC or Control group, ** indicates P < 0.01 compared to sh-NC group, # indicates P < 0.05 compared to LEVs + sh-NC group. Cell experiments were repeated three times
Fig. 6
Fig. 6
LEV-mediated regulation of the SIRT5/p53 axis affects proliferation and glycolysis in intestinal epithelial cells, influencing colon tumor formation. Note: (A) Schematic diagram illustrating the construction of a mouse model of colitis-associated tumors; (B) co-immunoprecipitation (co-IP) experiment detecting the acetylation level of p53 in mouse colonic polyp tissues from each group; (C) statistical analysis of the number and burden of colonic polyps in each group of mice; (D) immunohistochemical staining detecting the positive expression of Ki67 protein in mouse colonic polyp tissues from each group (scale bar = 100 μm); (E) immunohistochemical staining detecting the positive expression of cell cycle-related proteins Cyclin D1 and p27 in mouse colonic polyp tissues from each group (scale bar = 100 μm); (F) glucose uptake in mouse colonic polyp tissues from each group; (G) lactate production in mouse colonic mucosal tissues from each group; (H) Western blot detecting the expression of glycolytic rate-limiting enzymes GLUT1 and HKII in mouse colonic mucosal tissues from each group. * represents a difference compared to the WT group (P < 0.05), # represents a difference compared to the LEVs + WT group (P < 0.05), 6 mice per group
Fig. 7
Fig. 7
SIRT5 protein and acetylated p53 protein levels in colorectal cancer tissues and their correlation with prognosis. Note: (A) Immunohistochemical detection of SIRT5 protein expression in colorectal cancer tissues and adjacent normal tissues (scale bar = 50 μm); (B) co-IP experiment detecting the level of acetylated p53 protein in colorectal cancer tissues and adjacent normal tissues; (C) Survival curve analysis of SIRT5 protein expression in colorectal cancer tissues and patient prognosis; (D) Survival curve analysis of the level of acetylated p53 protein in colorectal cancer tissues and patient prognosis. Normal group, n = 58; Tumor group, n = 58. * represents a difference compared to the Normal group (P < 0.05), *** represents a difference compared to the Normal group (P < 0.001)
Fig. 8
Fig. 8
Molecular mechanism diagram illustrating how exosome-like vesicles derived from Lactobacillus regulate glycolysis metabolic reprogramming and abnormal proliferation of intestinal epithelial cells through SIRT5-mediated acetylation modification of p53, affecting colon tumor formation

Similar articles

Cited by

References

    1. Aiello P, Sharghi M, Mansourkhani SM, et al. Medicinal Plants in the Prevention and Treatment of Colon Cancer. Oxid Med Cell Longev. 2075614. 10.1155/2019/2075614. - PMC - PubMed
    1. Antropova EA, Khlebodarova TM, Demenkov PS, et al. Computer analysis of regulation of hepatocarcinoma marker genes hypermethylated by HCV proteins. Vavilovskii Zhurnal Genet Selektsii. 2022;26(8):733–42. 10.18699/VJGB-22-89. - PMC - PubMed
    1. Bajic SS, Cañas MA, Tolinacki M, et al. Proteomic profile of extracellular vesicles released by Lactiplantibacillus plantarum BGAN8 and their internalization by non-polarized HT29 cell line. Sci Rep. 2020;10(1):21829. 10.1038/s41598-020-78920-z. - PMC - PubMed
    1. Bao Y, Zhai J, Chen H, et al. Targeting m6A reader YTHDF1 augments antitumour immunity and boosts anti-PD-1 efficacy in colorectal cancer. Gut. 2023;72(8):1497–509. 10.1136/gutjnl-2022-328845. - PMC - PubMed
    1. Bauer DE, Harris MH, Plas DR, et al. Cytokine stimulation of aerobic glycolysis in hematopoietic cells exceeds proliferative demand. FASEB J. 2004;18(11):1303–5. 10.1096/fj.03-1001fje. - PMC - PubMed

Publication types