

The performance of interrupted time series designs with a limited number of time points: Learning losses due to school closures during the COVID-19 pandemic
- PMID: 39110741
- PMCID: PMC11305537
- DOI: 10.1371/journal.pone.0301301
The performance of interrupted time series designs with a limited number of time points: Learning losses due to school closures during the COVID-19 pandemic
Abstract
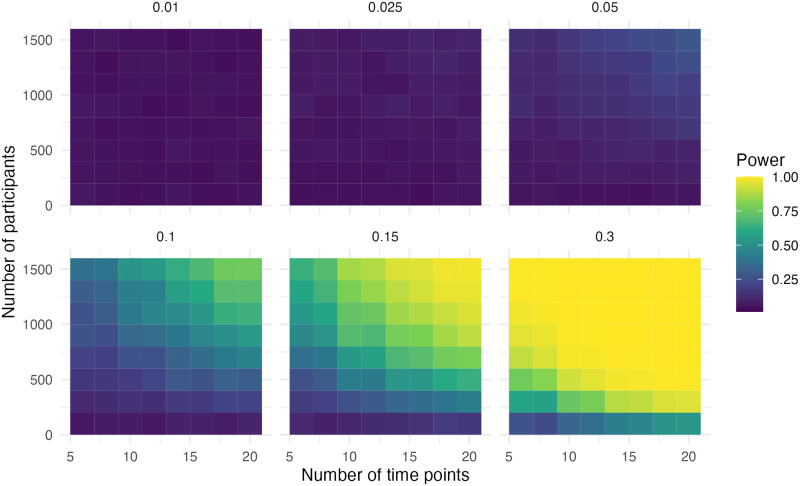
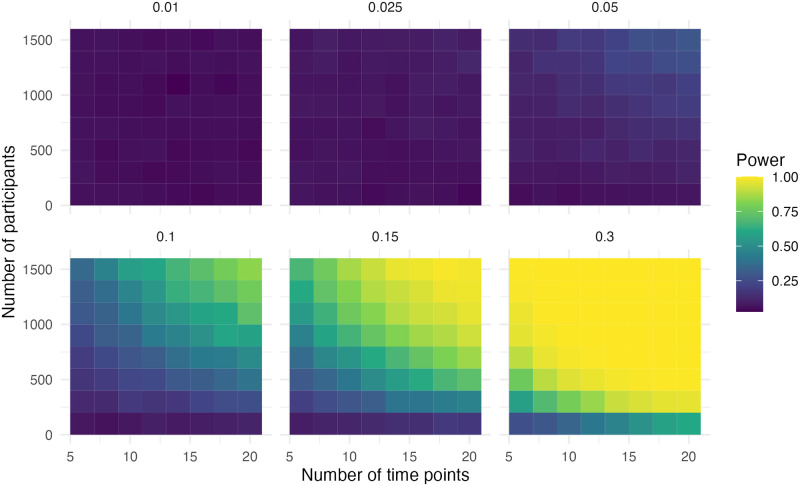
Interrupted time series (ITS) designs are increasingly used for estimating the effect of shocks in natural experiments. Currently, ITS designs are often used in scenarios with many time points and simple data structures. This research investigates the performance of ITS designs when the number of time points is limited and with complex data structures. Using a Monte Carlo simulation study, we empirically derive the performance-in terms of power, bias and precision- of the ITS design. Scenarios are considered with multiple interventions, a low number of time points and different effect sizes based on a motivating example of the learning loss due to COVID school closures. The results of the simulation study show the power of the step change depends mostly on the sample size, while the power of the slope change depends on the number of time points. In the basic scenario, with both a step and a slope change and an effect size of 30% of the pre-intervention slope, the required sample size for detecting a step change is 1,100 with a minimum of twelve time points. For detecting a slope change the required sample size decreases to 500 with eight time points. To decide if there is enough power researchers should inspect their data, hypothesize about effect sizes and consider an appropriate model before applying an ITS design to their research. This paper contributes to the field of methodology in two ways. Firstly, the motivation example showcases the difficulty of employing ITS designs in cases which do not adhere to a single intervention. Secondly, models are proposed for more difficult ITS designs and their performance is tested.
Copyright: © 2024 van Leeuwen et al. This is an open access article distributed under the terms of the Creative Commons Attribution License, which permits unrestricted use, distribution, and reproduction in any medium, provided the original author and source are credited.
Conflict of interest statement
The authors have declared that no competing interests exist.
Figures


References
-
- Porta Miquel. A dictionary of epidemiology. Oxford university press. 2014.
-
- Craig Peter, Cooper Cyrus, Gunnell David, Haw Sally, Lawson Kenny, Macintyre Sally, et al.. Using natural experiments to evaluate population health interventions: new Medical Research Council guidance. J Epidemiol Community Health. 2012;66(12):1182–1186. doi: 10.1136/jech-2011-200375 - DOI - PMC - PubMed
MeSH terms
LinkOut - more resources
Full Text Sources
Medical
