. 2024 Aug 7;20(8):e1012426.
doi: 10.1371/journal.ppat.1012426. eCollection 2024 Aug.

Merkel cell polyomavirus small tumor antigen contributes to immune evasion by interfering with type I interferon signaling

Affiliations

Merkel cell polyomavirus small tumor antigen contributes to immune evasion by interfering with type I interferon signaling

Denise Ohnezeit et al. PLoS Pathog. .

Abstract

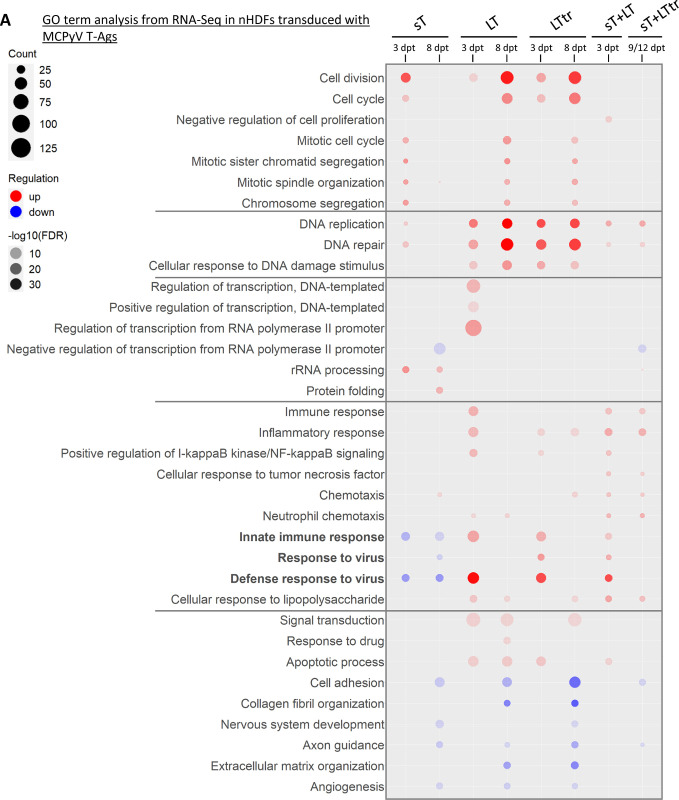
Merkel cell polyomavirus (MCPyV) is the causative agent of the majority of Merkel cell carcinomas (MCC). The virus has limited coding capacity, with its early viral proteins, large T (LT) and small T (sT), being multifunctional and contributing to infection and transformation. A fundamental difference in early viral gene expression between infection and MCPyV-driven tumorigenesis is the expression of a truncated LT (LTtr) in the tumor. In contrast, sT is expressed in both conditions and contributes significantly to oncogenesis. Here, we identified novel functions of early viral proteins by performing genome-wide transcriptome and chromatin studies in primary human fibroblasts. Due to current limitations in infection and tumorigenesis models, we mimic these conditions by ectopically expressing sT, LT or LTtr, individually or in combination, at different time points. In addition to its known function in cell cycle and inflammation modulation, we reveal a fundamentally new function of sT. We show that sT regulates the type I interferon (IFN) response downstream of the type I interferon receptor (IFNAR) by interfering with the interferon-stimulated gene factor 3 (ISGF3)-induced interferon-stimulated gene (ISG) response. Expression of sT leads to a reduction in the expression of interferon regulatory factor 9 (IRF9) which is a central component of the ISGF3 complex. We further show that this function of sT is conserved in BKPyV. We provide a first mechanistic understanding of which early viral proteins trigger and control the type I IFN response, which may influence MCPyV infection, persistence and, during MCC progression, regulation of the tumor microenvironment.


Conflict of interest statement

The authors have declared that no competing interests exist.

Figures

Fig 1
Fig 1. Overexpression of MCPyV T-Ags profoundly alters the host gene expression pattern in primary nHDFs.
(A) Experimental outline to study transcriptional and histone modification changes induced by MCPyV T antigens. nHDFs were transduced with lentiviruses (MOI of 1) harboring MCPyV open reading frames encoding sT, LT or LTtr, in addition to GFP or mCherry. Cells were sorted at 2 dpt, followed by harvesting at 3, 8, 9 or 12 dpt for subsequent RNA-Seq and ChIP-Seq analysis. In addition to individual transductions for expression of sT, LT or LTtr, co-transductions of LT and sT or LTtr and sT were performed. Each experiment was performed once in donor I and once in donor II. Created with BioRender. (B) RT-qPCR analysis summarizing the relative mRNA levels of LT, sT or LTtr normalized to HPRT and GAPDH in the experiments described in Fig 1A. (C) Comparative heat map of DEGs obtained from all RNA-Seq analyses identifying four major clusters across all samples (n = 2, individual donors were used as replicates). The color code refers to the row Z-scores.
Fig 2
Fig 2. MCPyV T-Ags show an intersection of commonly deregulated and distinct host genes.
GO analysis (DAVID Bioinformatics Resources) was performed using significantly (padj. ≤0.05) up- or downregulated (log2FC ≥1/≤-1) genes from the RNA-Seq analysis conducted in T-Ag-expressing nHDFs (donor I and donor II) compared to the vector controls. From all significantly enriched GO terms (FDR ≤0.05) with a minimum gene count of five, the ten terms with the highest gene counts from each condition were derived and grouped according to their biological function. The size of the icons represents the gene counts; the red color code refers to the FDR values of enriched GO terms, including upregulated genes; the blue color code indicates the FDR values of GO terms including downregulated genes. The shading represents the level of significance (FDR).
Fig 3
Fig 3. MCPyV sT suppresses the transcription of type I IFN response genes.
(A) Volcano plots depicting all DEGs in nHDFs expressing sT for 3 or 8 days. RNA-Seq analysis was performed once in donor I and once in donor II, donor I and II results were used as replicates. Genes that are significantly (padj. ≤0.05) up- (log2FC ≥1) or downregulated (log2FC ≤-1) are shown as red or blue circles, respectively. MCPyV sT genes are shown in orange. Genes with the ten highest or lowest log2FCs and the ten most significantly differentially regulated genes are highlighted in the volcano plots. IFN-regulated genes are shown in bold. (B) GO analysis (Biological process) was performed using significantly (padj. ≤0.05) downregulated (log2FC ≤-1) genes in nHDFs expressing sT compared to the vector control. The size of the icons represents the gene counts, and the color code indicates the level of significance (FDR values). (C) Heat maps showing the changes in gene expression for a selection of genes involved in innate immunity, derived from the GO terms marked in bold in (B). A complete list of genes included in (B) is provided in the S5 Table. The left heat map shows the log2FCs of nHDFs at 3 and 8 dpt with lentiviruses expressing empty vector (ctrl), compared to non-transduced cells. The right heat map shows the log2FCs of nHDFs after 3 and 8 dpt with lentiviruses expressing sT compared to ctrl.
Fig 4
Fig 4. MCPyV sT affects ISGF3-dependent gene expression.
(A) Comparison of genes that were downregulated or upregulated after sT expression at 3 or 8 dpt with the interferome database [40,80]. (B) Comparison of DEGs from sT-expressing nHDFs to DEGs in WT and IRF9-KO macrophages upon IFN-β treatment [41] (NCBI GEO DataSet GSE128113). IRF9-independent (indep.) genes refer to DEGs that are regulated in the same direction in both WT and IRF9-KO cells, while IRF9-dependent (dep.) genes are DEGs in WT that are not significantly differentially expressed in the same direction in IRF9-KO cells. Statistical significance (p-values and ORs) of the overlap between DEGs from sT-expressing nHDFs and IRF9-dep. and indep. regulated genes was determined using Fisher’s exact test. Volcano plots depict all DEGs in nHDFs expressing sT for 3 or 8 days. Genes that were IRF9-dependently upregulated by IFN-β are marked in green in the volcano plot. (C) Bar plots indicating IFN-β-upregulated genes that were IRF9-dep. or IRF9-indep. are indicated on the x-axis. Genes differentially expressed in nHDFs expressing sT for 3 and 8 dpt (merged) are colored in green.
Fig 5
Fig 5. Transcriptional changes induced by MCPyV sT correlate with activating histone marks.
(A) Distribution of genomic features obtained by diffReps analysis from the ChIP-Seq experiments for H3K4me3, H3K27me3, H3K27ac and H3K9me3 in primary nHDF cells overexpressing sT vs vector control at 8 dpt. Each ChIP-Seq experiment was performed once in donor I and once in donor II. All significant hits with a log2FC ≥0.5/ ≤-0.5 were classified according to their annotations to genomic regions. (B) Histone modification signals of activating marks, i.e., H3K4me3 and H3K27ac, were correlated with changes in gene expression, comparing sT vs ctrl. The color code refers to the log2FC of each gene that is plotted by its level of histone modification signal. The x and y-axes were segmented into 100 bins and regions within these bins are depicted by the counts (RPKM, reads per kb million). (C) Correlation of H3K4me3 and H3K27ac signals with gene expression data for selected genes that were downregulated in the presence of sT by RNA-Seq analysis (see Fig 3C). Average plots represent the signal (RPKM) of each histone modification within a region of 5 kb upstream and downstream of the TSS of the respective gene. Black tracks represent signals from the vector control, while tracks from sT-expressing nHDFs are shown in red for H3K4me3 and in orange for H3K27ac.
Fig 6
Fig 6. sT interferes with the signaling cascade downstream of IFNAR1/2 by targeting IRF9.
(A) Confirmation of sT-induced transcriptional repression of selected ISGs: STAT1, IRF9, IRF7 and OAS2. mRNA levels were measured by RT-qPCR in sT-expressing nHDFs at 3 and 8 dpt (n = 3) and normalized to the mRNA levels in control cells. (B) IF staining of IRF9 in nHDFs expressing sT or ctrl vector at 3 dpt. Exemplary images are shown from non-transduced nHDFs and nHDFs expressing ctrl or sT at 3 dpt (donor II), showing DAPI-, IRF9-staining and mCherry expression, as a marker for transduction. Scale bar: 30 μm. (C) Immunoblot analysis of pSTAT1, STAT1 and IRF9 at 2 dpt (non-sorted cells) and 8 dpt (sorted cells). Representative blots are shown on the left. Quantification was performed using actin as a loading control (n = 3), with normalization to ctrl cells. (A-C) Significance levels were calculated using two-tailed, unpaired t-test (ns = not significant, * p<0.05, ** p<0.01, *** p<0.001).
Fig 7
Fig 7. MCPyV sT downregulates transcription of IFNB1 promoter-driven luciferase expression.
(A-D) HEK293 cells were co-transfected with pRL-TK, a reporter featuring the human IFNB1 promoter upstream of the firefly luciferase gene (IFNB1-FLuc), and expression plasmids for Influenza A virus (IAV) NS1, MCPyV sT, MCPyV sT-R102A or the corresponding vector control. To induce IFNB1 promoter activity, cGAS-STING (A) RIG-I-N (B), TBK1 (C), IRF3-5D (D) or the respective controls were co-transfected and cells were lysed 20 hpt. (C-D) Expression plasmids for human cytomegalovirus (HCMV) UL35 and IAV NS1 were included as controls. Similar expression levels of viral proteins, MCPyV sT, HCMV UL35, and promoter stimuli (cGAS, STING, RIG-I, IRF3 and TBK1) was ensured by immunoblotting with protein levels of MCPyV sT analyzed using 2T2 antibody and HA antibody in the case of HCMV UL35-HA expression. Actin was used as a loading control. Representative immunoblots from one of the three independent experiments are shown below each graph. Luciferase fold induction was analyzed by normalization to Renilla luciferase activity, comparing stimulated vs unstimulated conditions. Data are shown from three independent experiments and significance levels were calculated using two-tailed, unpaired t-test (ns = not significant, * p<0.05, ** p<0.01, *** p<0.001).
Fig 8
Fig 8. MCPyV sT downregulates transcription of ISG promoter-driven luciferase expression by interfering with IRF9.
(A-C) HEK293 cells were co-transfected with a reporter plasmid expressing firefly luciferase under the control of the human IFIT1 (A) or IFIT2 (B) promoter, or the murine MX1 promoter (C), together with pRL-TK control plasmid and expression constructs for murine CMV (MCMV) M27-V5, MCPyV sT, MCPyV sT-R102A, or the corresponding empty vector control (ctrl). 24 h post transfection (hpt), 1 ng/ml human IFN-β were added. Cells were lysed 16 h later to measure luciferase activity, comparing IFN-β-treated to unstimulated cells. Protein levels of MCPyV sT or MCMV M27-V5, pSTAT1, pSTAT2, STAT1, STAT2 and IRF9 were analyzed by immunoblotting, including actin as a loading control. Representative immunoblots of one of the three independent experiments are shown below each graph. Luciferase fold induction was analyzed by normalizing firefly to Renilla luciferase activity, comparing stimulated (+IFN-β) vs unstimulated conditions. Data are shown from three independent experiments and significance levels were calculated using two-tailed, unpaired t-test (ns = not significant, * p<0.05, ** p<0.01, *** p<0.001).
Fig 9
Fig 9. MCPyV T antigens have opposing effects on the transcription of type I IFN response genes.
Heat map of selected genes involved in type I IFN signaling differentially regulated in nHDFs overexpressing MCPyV T-Ags (LT, sT, LTtr), either individually or in combination, compared to the respective lentiviral vector controls. Values are derived from the RNA-Seq analysis that was performed once in donor I and once in donor II. The color code refers to the log2FCs and n.s. is denoted for genes with a padj. value >0.05.
Fig 10
Fig 10. Interference of MCPyV T-Ags with PRR-mediated IFN signaling.
Schematic representation of the results of this study. MCPyV sT interferes with PRR signaling by impairing NF-κB- and IRF3-mediated IFNB1 promoter activation, but additionally regulates IRF9 to repress IFNAR-mediated signaling, resulting in transcriptional silencing of a large number of ISGs. By counterbalancing the type I IFN responses elicited by LT or LTtr, sT contributes to immune evasion during infection and MCC progression. Created with BioRender.

References

    1. DeCaprio JA. Molecular Pathogenesis of Merkel Cell Carcinoma. Annu Rev Pathol. 2021;16:69–91. doi: 10.1146/annurev-pathmechdis-012419-032817 . - DOI - PubMed
    1. Feng H, Kwun HJ, Liu X, Gjoerup O, Stolz DB, Chang Y, et al.. Cellular and viral factors regulating Merkel cell polyomavirus replication. PLoS One. 2011;6(7):e22468. doi: 10.1371/journal.pone.0022468 ; PubMed Central PMCID: PMC3142164. - DOI - PMC - PubMed
    1. Kwun HJ, Chang Y, Moore PS. Protein-mediated viral latency is a novel mechanism for Merkel cell polyomavirus persistence. Proc Natl Acad Sci U S A. 2017;114(20):E4040–E7. doi: 10.1073/pnas.1703879114 ; PubMed Central PMCID: PMC5441811. - DOI - PMC - PubMed
    1. Neumann F, Borchert S, Schmidt C, Reimer R, Hohenberg H, Fischer N, et al.. Replication, gene expression and particle production by a consensus Merkel Cell Polyomavirus (MCPyV) genome. PLoS One. 2011;6(12):e29112. doi: 10.1371/journal.pone.0029112 ; PubMed Central PMCID: PMC3246459. - DOI - PMC - PubMed
    1. Theiss JM, Gunther T, Alawi M, Neumann F, Tessmer U, Fischer N, et al.. A Comprehensive Analysis of Replicating Merkel Cell Polyomavirus Genomes Delineates the Viral Transcription Program and Suggests a Role for mcv-miR-M1 in Episomal Persistence. PLoS Pathog. 2015;11(7):e1004974. doi: 10.1371/journal.ppat.1004974 ; PubMed Central PMCID: PMC4517807. - DOI - PMC - PubMed

MeSH terms

LinkOut - more resources