. 2024 Aug 9;10(32):eadj8862.
doi: 10.1126/sciadv.adj8862. Epub 2024 Aug 7.

The interferon γ pathway enhances pluripotency and X-chromosome reactivation in iPSC reprogramming

Affiliations

The interferon γ pathway enhances pluripotency and X-chromosome reactivation in iPSC reprogramming

Mercedes Barrero et al. Sci Adv. .

Abstract

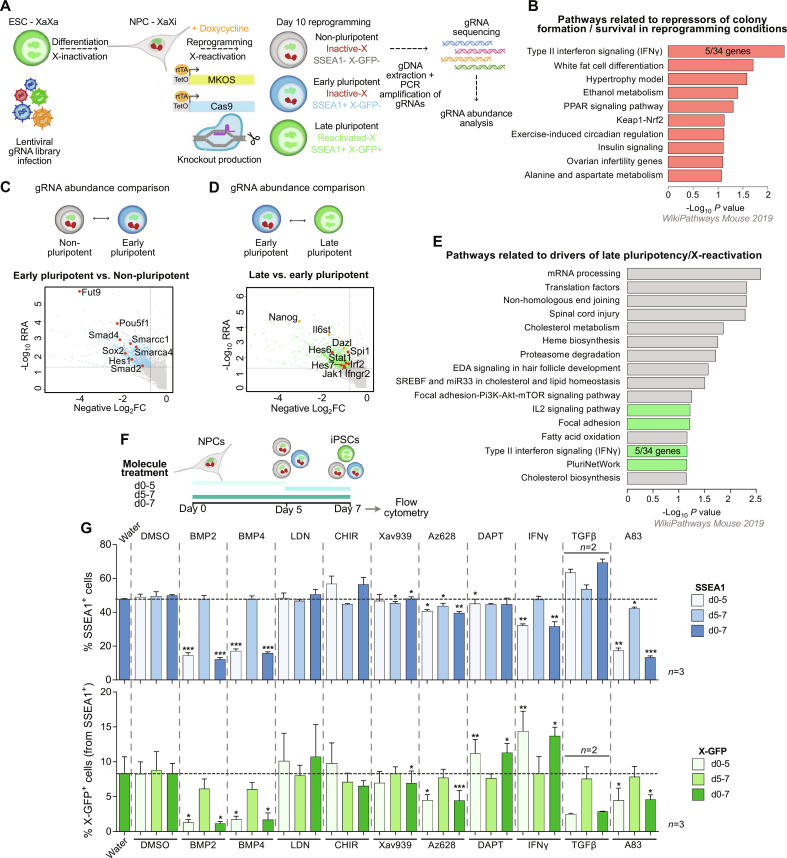
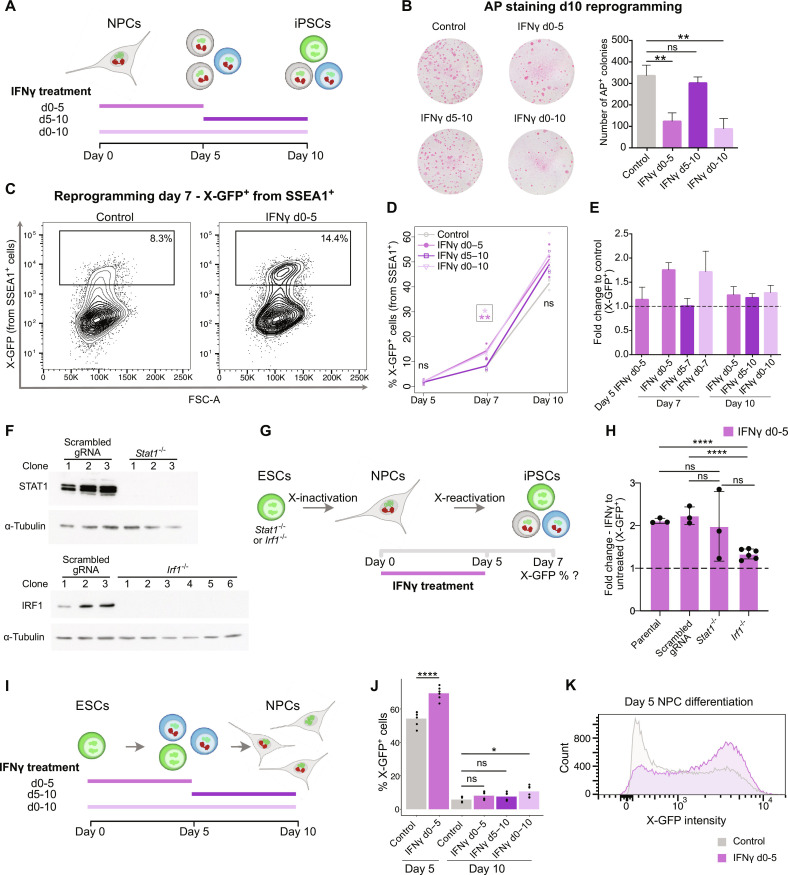
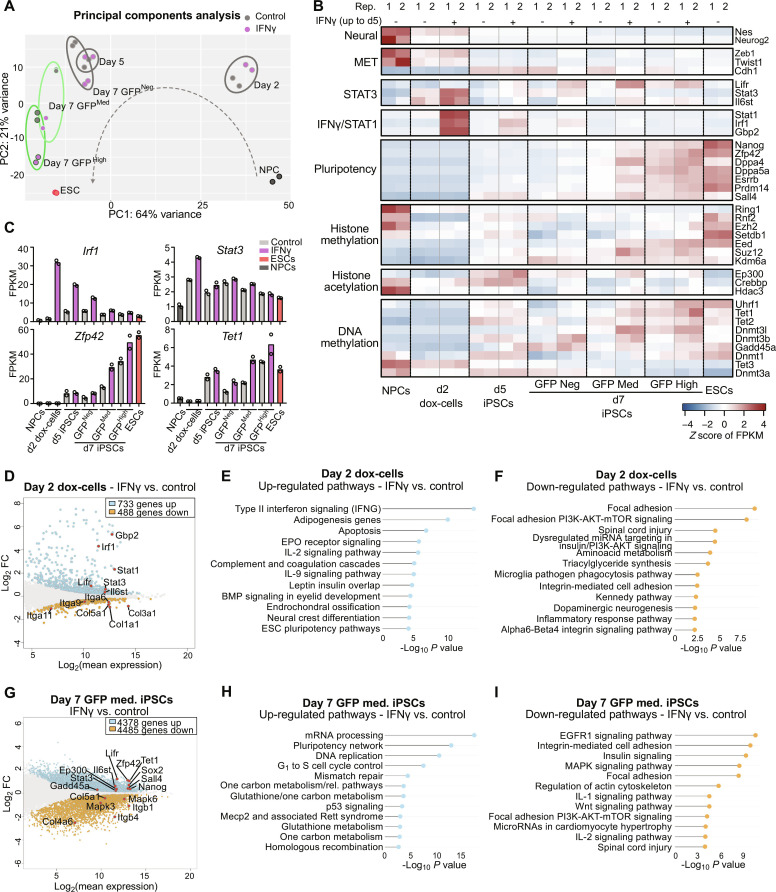
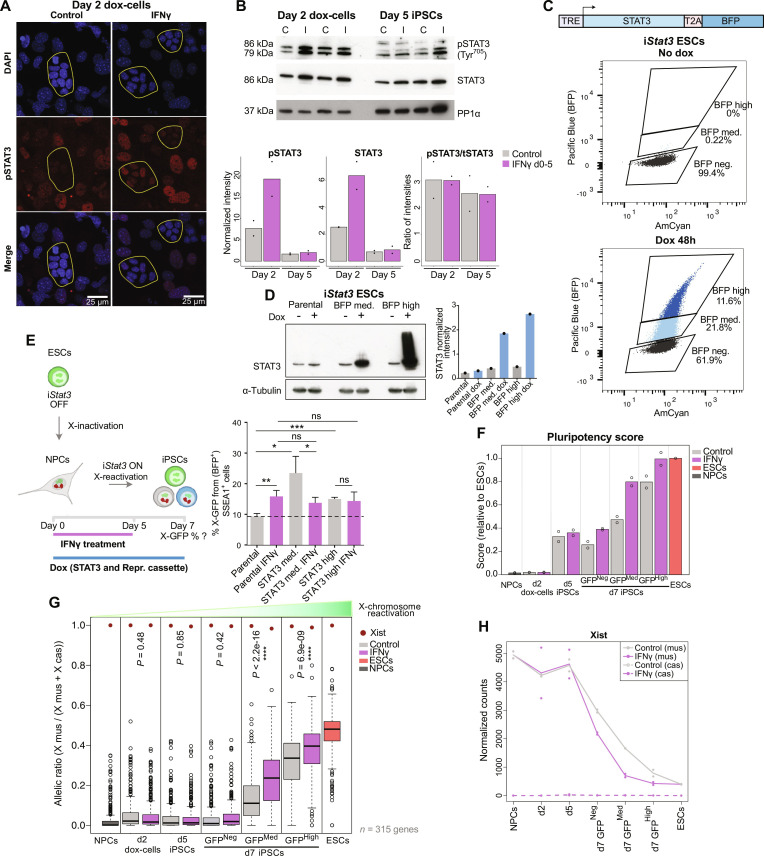
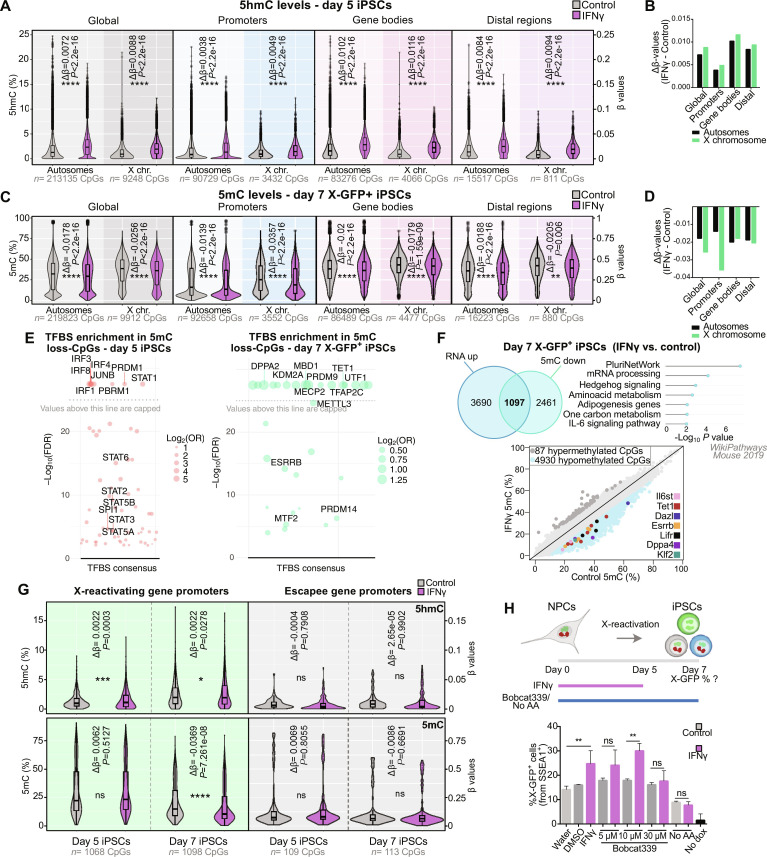
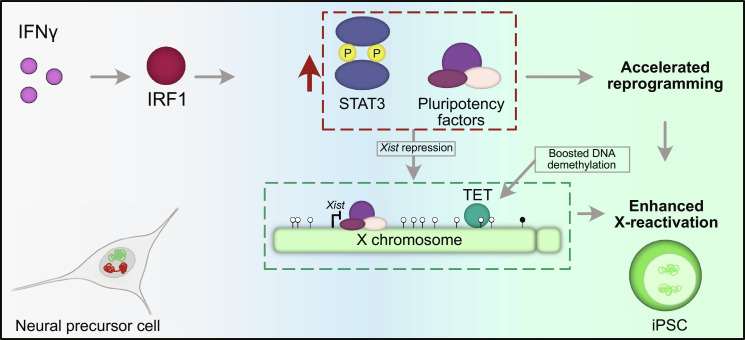
Reprogramming somatic cells into induced pluripotent stem cells (iPSCs) requires activation of the pluripotency network and resetting of the epigenome by erasing the epigenetic memory of the somatic state. In female mouse cells, a critical epigenetic reprogramming step is the reactivation of the inactive X chromosome. Despite its importance, a systematic understanding of the regulatory networks linking pluripotency and X-reactivation is missing. Here, we reveal important pathways for pluripotency acquisition and X-reactivation using a genome-wide CRISPR screen during neural precursor to iPSC reprogramming. In particular, we discover that activation of the interferon γ (IFNγ) pathway early during reprogramming accelerates pluripotency acquisition and X-reactivation. IFNγ stimulates STAT3 signaling and the pluripotency network and leads to enhanced TET-mediated DNA demethylation, which consequently boosts X-reactivation. We therefore gain a mechanistic understanding of the role of IFNγ in reprogramming and X-reactivation and provide a comprehensive resource of the molecular networks involved in these processes.


Figures

Fig. 1.
Fig. 1.. CRISPR screen reveals molecular networks involved in reprogramming and X-reactivation.
(A) PaX-iCas9 ESCs infected with a genome-wide lentiviral gRNA library were differentiated into NPCs, doxycycline-treated to activate reprogramming cassette and iCas9 expression, producing KOs during reprogramming. At day 10, three populations were sorted: non-, early, and late pluripotent/X-reactivated. For these populations and NPCs, gDNA extraction, PCR amplification of gRNAs, sequencing, and gRNA abundance analysis were performed (n = 2 independent reprogramming rounds). (B) Pathways related to overrepresented genes in non-, early, and late pluripotent populations compared to NPCs. The top 250 genes from each individual comparison to NPCs ranked by RRA score with MAGeCK were used. For the IFNγ pathway, the number of genes (5 of 34) found for this GO term is indicated. (C and D) gRNA abundance comparisons of early versus nonpluripotent (C) or late versus early pluripotent populations (D) and representation of negative log2FC versus −log10 RRA (RRA cutoff = 0.05, log2FC cutoff = −0.75) [activators of early pluripotency in (C), where genes are highlighted in red; activators of late pluripotency/X-reactivation in (D), where pluripotency genes are shown in yellow; Notch or IFNγ signaling genes are shown in red]. (E) Pathways related to underrepresented genes in “late pluripotent versus early pluripotent” comparison (n = 1313 genes, RRA score < 0.05, log2FC < −0.8). Proliferation, differentiation, and metabolism pathways shown in gray; the rest of the pathways in green. (F) Experimental design for (G). Molecule treatments were done from day 0 to 5, day 5 to 7 or day 0 to 7; flow cytometry analysis was done at day 7. (G) Pathway validation: Flow cytometry analysis at day 7 of SSEA1 and X-GFP percentages (n = 3 reprogramming rounds; for TGFβ, n = 2). Data represented as mean ± SD. Statistics (paired t tests): where not specified = nonsignificant; *P < 0.05; **P < 0.01; ***P < 0.001.
Fig. 2.
Fig. 2.. IFNγ modulates colony formation and X-reactivation during reprogramming.
(A) For (B) to (E), IFNγ was added from day 0 to 5, day 5 to 10, day 0 to 10 (n = 3 reprogramming rounds). (B) AP stainings on day 10 of reprogramming (n = 3 for control, n = 4 for IFNγ treatments). Statistics (unpaired t tests): ns = nonsignificant; **P < 0.01. Error bars represent SD. (C) Flow cytometry plots of X-GFP+ (from SSEA1+) cells (gate) in control and IFNγ treatment (day 0 to 5) at day 7. (D) Flow cytometry analysis of X-GFP+ cells on reprogramming days 5, 7, and 10. Statistics (paired t tests): *P < 0.05; **P < 0.01. (E) Fold change of X-GFP percentages compared to each control. Error bars represent SD [calculations based on percentages in (D)]. (F) Western blot of STAT1 and IRF1 for three scrambled gRNA and three Stat1−/− clones (top) or six Irf1−/− clones (bottom). Loading control: ɑ-tubulin. (G) For (H), NPCs derived from three Stat1−/−, six Irf1−/−, three parental, and three scrambled gRNA ESC clones were reprogrammed into iPSCs ± IFNγ (day 0 to 5). X-GFP percentages measured by flow cytometry at day 7. (H) Fold change of X-GFP+ percentage (IFNγ versus untreated controls) on day 7 measured by flow cytometry. Clones with the same genotype listed in (G) are grouped; dots represent the mean of three technical replicates for each clone. Statistics (unpaired t tests): ****P < 0.0001. Error bars represent SD. (I) For (J) and (K), IFNγ treatment was done during NPC differentiation (day 0 to 5, day 5 to 10, and day 0 to 10) (n = 6 independent replicates). (J) X-GFP percentage on days 5 and 10 of NPC differentiation measured by flow cytometry. Statistics (paired t tests): *P < 0.05; ****P < 0.0001. (K) Flow cytometry histogram of X-GFP intensity in representative samples of control and IFNγ-treated day 5 NPCs.
Fig. 3.
Fig. 3.. IFNγ pathway activation accelerates the reprogramming process.
(A) PCA of RNA-seq of NPCs, day 2, day 5, and day 7 reprogramming populations, and ESCs, in control and IFNγ treatment (day 0 to 5), representing the top 500 most variable genes. (B) Heatmap representing expression (z score of FPKM) of neural genes, mesenchymal-to-epithelial transition (MET) genes, pluripotency genes, STAT3- and IFNγ/STAT1-related genes, histone methylation genes, histone acetylation genes, and DNA methylation genes. (C) Expression (FPKM) of selected genes (Irf1, Stat3, Zfp42/Rex1, and Tet1) in NPCs, ESCs, and day 2, day 5, and day 7 reprogramming populations ± IFNγ treatment (two RNA-seq replicates shown). (D) MA plot (log2FC vs log2 mean expression) displaying transcriptomic changes of IFNγ versus control day 2 reprogramming cells (adjusted P = 0.1). Up-regulated genes are highlighted in light blue; down-regulated genes are highlighted in orange. Selected genes are shown with points in red. (E and F) Up-regulated (E) and down-regulated (F) pathways in IFNγ versus control day 2 reprogramming cells (WikiPathways Mouse 2019) (adjusted P = 0.1). (G) MA plot displaying transcriptomic changes of IFNγ versus control day 7 X-GFP medium iPSCs (adjusted P = 0.1). Up-regulated genes are highlighted in light blue; down-regulated genes are highlighted in orange. Selected genes are shown with points in red. (H and I) Up-regulated (H) and down-regulated (I) pathways in IFNγ versus control day 7 X-GFP medium iPSCs (WikiPathways Mouse 2019) (adjusted P = 0.1).
Fig. 4.
Fig. 4.. IFNγ treatment during reprogramming enhances JAK-STAT3 signaling, pluripotency gene expression, and X-reactivation.
(A) Immunofluorescence of pSTAT3 (Tyr705) on day 2 doxycycline (dox)–treated cells ± IFNγ. Scale bar, 25 μm. Z projections of maximum intensity from six stacks are shown for all channels. Outlines highlight colonies of cells undergoing reprogramming (smaller nuclei, tight aggregation). (B) Western blotting of STAT3 and pSTAT3 (Tyr705) on days 2 and 5 of reprogramming ± IFNγ (C, control; I, IFNγ; loading control: PP1α). Normalized intensities to loading control for pSTAT3 and total STAT3, and pSTAT3/total STAT3 intensity ratios are shown. (C) STAT3 overexpression construct design and flow cytometry plots showing STAT3-BFP activation in untreated and 48-hour doxycycline–treated ESCs. (D) Western blotting of STAT3 in parental and STAT3-BFP–medium/high ESC sorted populations after 48 hours of doxycycline treatment, and intensities normalized to loading control (α-tubulin). (E) NPCs derived from parental, BFP-medium, and BFP-high ESCs (7 days of doxycycline withdrawal) were reprogrammed (± IFNγ day 0 to 5). Flow cytometry analysis of X-GFP expression [from (BFP+) SSEA1+ cells] was performed on day 7 of reprogramming (n = 3 technical replicates). Statistics (unpaired t tests): *P < 0.05; **P < 0.01; ***P < 0.001. Error bars represent SD. (F) Pluripotency score (relative to ESCs) in the two RNA-seq replicates during reprogramming, calculated from the expression levels of Nanog, Zfp42/Rex1, Dppa4, Dppa5a, Esrrb, Prdm14, and Sall4. (G) Allelic ratio of 315 genes expressed from X cas on NPCs, ESCs, and day 2, day 5, and day 7 reprogramming populations ± IFNγ treatment. Statistics (unpaired t tests): not specified = nonsignificant; ****P < 0.0001. (H) Expression (normalized counts) of Xist from X mus and X cas in NPCs, ESCs, and day 2, day 5, and day 7 reprogramming populations ± IFNγ treatment (two RNA-seq replicates shown).
Fig. 5.
Fig. 5.. IFNγ promotes TET-mediated DNA demethylation during reprogramming.
(A and C) Analysis of 5hmC in day 5 (A) or 5mC in day 7 X-GFP+ cells (C) (β values) of CpGs in autosomes and X chromosome for control and IFNγ (day 0 to 5) conditions, globally, in promoters (≤1 kb from transcription start site), gene bodies, and distal regions. Δβ-values (mean β-value IFNγ − mean β-value control) and P values (IFNγ versus control) are shown in the graphs. Statistics (unpaired t tests): **P < 0.01; ****P < 0.0001. (B and D) Δβ-values for 5hmC in day 5 [(B), corresponding to analysis in (A)] and 5mC in day 7 X-GFP+ [(D), corresponding to analysis in (C)] iPSCs. (E) TFBS enrichment analysis on IFNγ-5mC–hypomethylated CpGs [DMPs, logFC < (−0.1), P < 0.01] in day 5 (n = 360 CpGs) and day 7 X-GFP+ (n = 10,023 CpGs) iPSCs. −Log10(false discovery rate) capped values are above 25. (F) Venn diagram for up-regulated genes in the RNA-seq on IFNγ X-GFP+ day 7 iPSCs (n = 4787 genes) and genes associated with IFNγ-5mC–hypomethylated promoter CpGs [logFC < (−0.1), P < 0.01] (n = 3558 genes, 4930 CpGs), and pathway enrichment of common genes. Scatterplot representing 5mC levels from promoter CpGs in day 7 IFNγ versus control iPSCs [hypermethylated (dark gray) and hypomethylated (light blue) CpGs are shown, highlighting pluripotency genes with hypomethylated CpGs]. (G) Analysis of 5mC and 5hmC in X-reactivating (X-allelic ratio ≤ 0.135 in NPCs, n = 216 genes, 1068 to 1098 CpGs) and escapee (X-allelic ratio > 0.135 in NPCs, n = 20 genes, 109 to 113 CpGs) gene promoters in day 5 and 7 X-GFP+ iPSCs. Statistics (unpaired t tests): *P < 0.05; ***P < 0.001; ****P < 0.0001. (H) Treatment with IFNγ (day 0 to 5) was combined with addition of Bobcat339 or absence of ascorbic acid (AA) (day 0 to 7) during reprogramming. X-GFP expression was measured by flow cytometry at day 7 [n = 5 (control and IFNγ) and n = 3 (rest of conditions) technical replicates]. Statistics (unpaired t tests): **P < 0.01. Error bars represent SD.
Fig. 6.
Fig. 6.. Model: Activation of the IFNγ pathway affects pluripotency acquisition and X-chromosome reactivation.
The exposure to IFNγ in the early stages of NPC reprogramming into iPSCs induces the activation of IRF1 and a subsequent up-regulation and activation of STAT3 and the expression of pluripotency genes. This would lead to an accelerated reprogramming kinetics. Moreover, the higher expression of pluripotency factors would lead to Xist repression, and TET-mediated oxidation of methylated CpGs would enhance DNA demethylation globally and at X-chromosomal promoters of cells undergoing X-reactivation. This, together with the accelerated reprogramming, would explain the enhanced X-reactivation efficiency upon early IFNγ treatment during NPC reprogramming into iPSCs.

References

    1. Hochedlinger K., Jaenisch R., Induced pluripotency and epigenetic reprogramming. Cold Spring Harb. Perspect. Biol. 7, a019448 (2015). - PMC - PubMed
    1. Reik W., Surani M. A., Germline and pluripotent stem cells. Cold Spring Harb. Perspect. Biol. 7, a019422 (2015). - PMC - PubMed
    1. Panda A., Zylicz J. J., Pasque V., New insights into x-chromosome reactivation during reprogramming to pluripotency. Cells 9, 2706 (2020). - PMC - PubMed
    1. Mattimoe T., Payer B., The compleX balancing act of controlling X-chromosome dosage and how it impacts mammalian germline development. Biochem. J. 480, 521–537 (2023). - PMC - PubMed
    1. Mak W., Nesterova T. B., de Napoles M., Appanah R., Yamanaka S., Otte A. P., Brockdorff N., Reactivation of the paternal X chromosome in early mouse embryos. Science 303, 666–669 (2004). - PubMed

Publication types

Substances