. 2024 Aug 9;10(32):eadl5722.
doi: 10.1126/sciadv.adl5722. Epub 2024 Aug 7.

Insulin restores retinal ganglion cell functional connectivity and promotes visual recovery in glaucoma

Affiliations

Insulin restores retinal ganglion cell functional connectivity and promotes visual recovery in glaucoma

Sana El Hajji et al. Sci Adv. .

Abstract

Dendrite pathology and synaptic loss result in neural circuit dysfunction, a common feature of neurodegenerative diseases. There is a lack of strategies that target dendritic and synaptic regeneration to promote neurorecovery. We show that daily human recombinant insulin eye drops stimulate retinal ganglion cell (RGC) dendrite and synapse regeneration during ocular hypertension, a risk factor to develop glaucoma. We demonstrate that the ribosomal protein p70S6 kinase (S6K) is essential for insulin-dependent dendritic regrowth. Furthermore, S6K phosphorylation of the stress-activated protein kinase-interacting protein 1 (SIN1), a link between the mammalian target of rapamycin complexes 1 and 2 (mTORC1/2), is required for insulin-induced dendritic regeneration. Using two-photon microscopy live retinal imaging, we show that insulin rescues single-RGC light-evoked calcium (Ca2+) dynamics. We further demonstrate that insulin enhances neuronal survival and retina-brain connectivity leading to improved optomotor reflex-elicited behaviors. Our data support that insulin is a compelling pro-regenerative strategy with potential clinical implications for the treatment and management of glaucoma.


Figures

Fig. 1.
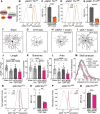
Fig. 1.. Insulin promotes RGC dendrite regeneration during ocular hypertensive stress.
(A) Schematic of the mouse glaucoma model induced by intracameral injection of magnetic microbeads, which block aqueous humor outflow leading to ocular hypertension (OHT). (B) Intraocular pressure (IOP) increases after microbead injection and remains elevated thereafter [N = 5 to 6 mice per group; two-way analysis of variance (ANOVA) with Sidak’s multiple comparisons post hoc test, ****P < 0.0001]. (C to E) Representative image of an αRGC co-expressing yellow fluorescent protein (YFP) and neurofilament heavy chain protein (NF-H) selected for dendritic arbor imaging and three-dimensional (3D) reconstruction. (F) Human recombinant insulin or vehicle (saline) eye drops were administered daily for 1 week starting at 2 weeks after OHT induction, a time when there is already substantial dendrite retraction. Eyes were collected and retinas analyzed 1 week from the onset of insulin treatment (3 weeks of OHT). (G and H) Representative examples of RGC dendritic arbor skeletons showing dendritic retraction at 2 weeks after OHT induction. (I and J) Human recombinant insulin, instilled as daily eye drops, promotes robust dendrite regeneration compared to saline-treated eyes quantified at 3 weeks after OHT induction. (K to N) Quantitative analysis confirmed that insulin restores the process length, arbor area, branch numbers, and complexity (Sholl analysis) (N = 5 to 6 mice per group, n = 37 to 74 RGCs per group; ANOVA with Tukey’s post hoc test, *P < 0.05, **P < 0.01, and ****P < 0.0001). (O and P) Representative examples of RGCs from brinzolamide (Brinzo)–treated eyes show marked dendritic retraction. (Q to T) Quantitative analysis confirmed that lowering IOP alone, in the absence of insulin, is not sufficient to stimulate regenerative growth (n = 15 to 41 RGCs per group, N = 5 to 6 mice per group; Student’s t test). Values are expressed as the means ± SEM. n.s., not significant.
Fig. 2.
Fig. 2.. Insulin restores excitatory synaptic inputs to vulnerable neurons.
(A to H) Retinal immunohistochemistry staining of endogenous PSD95 and VGLUT1 shows loss of synaptic components at 2 weeks after OHT induction. (I to P) Insulin administered after synapse disassembly rescues PSD95 and VGLUT1 expression in the inner plexiform layer (IPL) relative to saline-treated controls. [(D), (H), (L), (P), and (Q)] Quantification of pre- and postsynaptic voxels confirmed that insulin promotes robust regeneration of partnered synaptic components compared to vehicle-treated retinas at 3 weeks after OHT induction (N = 5 to 6 mice per group; ANOVA with Tukey’s post hoc test, **P < 0.01 and ****P < 0.0001). (R) Adeno-associated virus (AAV)–mediated expression of PSD95 in RGCs allows visualization of excitatory synaptic complexes on individual dendritic branches. A significant decrease in the density of excitatory postsynaptic sites was observed in both ON (S and T) and OFF (X and Y) RGCs. (U, V, Z, and AA) Daily insulin eye drops fully restored the density of PSD95 puncta in both ON and OFF RGC dendrites. (S′, T′, U′, V′, X′, Y′, Z′, and AA′) High-magnification PSD95 puncta show synaptic density reduction with OHT and regeneration with insulin in both ON and OFF RGCs. (W and AB) Quantitative analysis confirmed that insulin mediates robust synaptic regeneration to levels similar to sham-operated controls (ON: N = 5 to 6 mice per group, n = 9 to 13 RGCs per group; ANOVA, *P < 0.05, **P < 0.01, and ***P < 0.001; OFF: N = 5 to 6 mice per group, n = 7 to 16 RGCs per group; ANOVA, **P < 0.01 and ***P < 0.001). (AC to AJ) Sholl analysis of synaptic density shows the distribution of PSD95-labeled synapses on dendritic processes, from the soma to the terminal, during glaucoma and after insulin treatment. OHT promoted loss of excitatory synapses along the entire length of the dendrite, both proximal and distal to the cell body and insulin restored synaptic contacts across the full field in both ON and OFF αRGCs. Values are expressed as the means ± SEM.
Fig. 3.
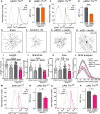
Fig. 3.. S6K, but not 4EBP1, is essential for insulin-mediated RGC dendrite regeneration.
(A) Schematic of insulin signaling components with a focus on the mTORC1 downstream signaling molecules S6K and 4EBP1. (B and C) Flow cytometry contour plot showing the gating strategy based on the fluorescence-minus-one (FMO) controls (RBPMSS6K-, RBPMS+S6K-, and RBPMSS6K+-stained retinas) to select the RBPMS+S6K+ cells for analysis of the mean fluorescence intensity (MFI) (B). A similar approach was used to select 4EBP1+ RGCs (C). (D) Flow cytometry histogram showing the level of S6K protein in RGCs (RBPMS+S6K+ cells) treated with siS6K or control siCtl. RGCs from retinas that received siS6K show reduced expression of S6K protein relative to siCtl-treated controls. An isotype (Iso) non-targeting antibody is included as control. (E) Quantitative analysis of the MFI confirms that siS6K reduces the expression of S6K in RGCs compared to siCtl (N = 3 to 4 mice per group, n = 30,000 to 50,000 RGCs per retina; Student’s t test, **P < 0.01). (F) Representative flow cytometry histogram showing the level of 4EBP1 protein in RGCs exposed to si4EBP1 or siCtl. An Iso non-targeting antibody is included as control. (G) Quantitative analysis of MFI shows that si4EBP1 significantly reduces the expression of 4EBP1 in RGCs compared to siCtl (N = 3 to 4 mice per group, n = 30,000 to 50,000 RGCs per retina; Student’s t test, ****P < 0.0001). A.U., arbitrary units. (H to K) Representative examples of RGC dendrites showing process retraction at 2 weeks of OHT [(H) and (I)]. S6K knockdown abrogates insulin-mediated dendrite regeneration [(J) and (K)]. (L to O) Quantitative analysis confirmed that siS6K leads to a marked reduction in the total dendritic length, arbor area, and number of branches indicative of impaired neuronal complexity (N = 5 to 6 mice per group, n = 32 to 63 RGCs per group; ANOVA, *P < 0.05, **P < 0.01, ***P < 0.001, and ****P < 0.0001). (P to W) 4EBP1 knockdown did not alter the pro-regenerative effect of insulin (N = 5 to 6 mice per group, n = 29 to 74 RGCs per group; ANOVA, *P < 0.05, **P < 0.01, ***P < 0.001, and ****P < 0.0001). Values are expressed as the means ± SEM.
Fig. 4.
Fig. 4.. S6K is required for RGC dendrite regeneration after optic nerve axotomy.
(A to D) Representative examples of RGC dendrites showing dendritic shrinkage at 3 days of optic nerve axotomy [(A) and (B)]. Insulin daily eye drops in the presence of siS6K inhibited the pro-regenerative effect of insulin (C) relative to a control siRNA (siCtl) (D). (E to H) Quantitative analysis shows that siS6K administration blocks insulin-mediated regeneration during axotomy-induced damage (N = 5 to 6 mice per group, n = 63 to 75 RGCs per group; ANOVA, *P < 0.05, **P < 0.01, ***P < 0.001, and ****P < 0.0001). Values are expressed as the means ± SEM. (I to L) Representative examples of RGC dendrites showing that 4EBP1 knockdown had no effect on insulin-induced regeneration after optic nerve axotomy relative to a siCtl [(K) and (L)]. (M to P) Quantitative analysis confirmed that si4EBP1 administration does not block the regenerative effect of insulin after axotomy (N = 5 to 6 mice per group, n = 54 to 63 RGCs per group; ANOVA, *P < 0.05, **P < 0.01, ***P < 0.001, and ****P < 0.0001). Values are expressed as the means ± SEM.
Fig. 5.
Fig. 5.. SIN1-dependent cross-talk between mTORC1 and mTORC2 is required for insulin-driven regeneration.
(A) Schematic diagram of a cross-talk model between mTORC1 and mTORC2. (B) Flow cytometry histogram showing the level of phosphorylated SIN1 (pSIN1) at Thr86 in RGCs (RBPMS+S6K+ cells) following siS6K or siCtl administration combined with insulin eye drops during OHT. siS6K effectively reduces the levels of pSIN1 Thr86 in RGCs. An Iso non-targeting antibody is included as control. (C) Quantitative analysis confirms reduced pSIN1 phosphorylation at Thr86 after siS6K treatments relative to siCtl (N = 6 mice per group, n = 30,000 to 50,000 RGCs per retina; Student’s t test, ****P < 0.0001). (D) Flow cytometry histogram shows that pSIN1 phosphorylation at Thr398 is also reduced in RGCs after S6K knockdown. An Iso non-targeting antibody is included as control. (E) Quantitative analysis confirms reduced pSIN1 Thr398 phosphorylation with siS6K (N = 5 to 6 mice per group, n = 30,000 to 50,000 RGCs per retina; Student’s t test, ****P < 0.0001). (F and G) Representative examples of RGC dendrites from eyes subjected to OHT (2 weeks) and sham controls. (H and I) Eyes with OHT that received siSIN1 or siCtl after insulin treatment show that SIN1 inhibition (H) obliterated the pro-regenerative effect of insulin compared to a siCtl (I). (J to M) Quantitative analysis confirmed that SIN1 knockdown inhibits the ability of insulin to restore the length, number of branches, field area, and complexity (Sholl analysis) of RGC dendrites (N = 5 to 6 mice per group, n = 26 to 63 RGCs per group; ANOVA, *P < 0.05, **P < 0.01, ***P < 0.001, and ****P < 0.0001). (N to Q) Quantitative analysis of flow cytometry showed that siSIN1 administration combined with insulin treatment during OHT significantly reduces the phosphorylation of Akt at Ser473 and Thr308 (N = 5 mice per group, n = 30,000 to 50,000 RGCs per retina, Student’s t test, **P < 0.01, ***P < 0.001). Values are expressed as the means ± SEM.
Fig. 6.
Fig. 6.. SIN1 mediates insulin-induced RGC dendrite regeneration after optic nerve axotomy.
(A and B) Flow cytometry histogram (A) and quantitative analysis (B) show that siS6K treatment does not reduce RGC-specific SIN1 phosphorylation (pSIN1) at Thr86 after axotomy (N = 3 to 4 mice per group, n = 30,000 to 50,000 RGCs per retina; Student’s t test, n.s.). An Iso non-targeting antibody is included as control. (C and D) In contrast, siS6K substantially reduces the level of pSIN1 Thr398 in RGCs compared to siCtl treated retinas (N = 3 to 4 mice per group, n = 30,000 to 50,000 RGCs per retina; Student’s t test, ***P < 0.001). An Iso non-targeting antibody is included as control. (E to H) Representative examples of RGC dendrites from eyes treated as follows: (i) sham-operated (E), (ii) optic nerve axotomy (3 days after lesion) (F), (iii) axotomy treated with siSIN1 and insulin (7 days after lesion) (G), and (iv) axotomy treated with siCtl and insulin (7 days after lesion) (H). These data show that siSIN1 inhibits the regenerative effect of insulin in axotomized retinas. (I to L) Quantitative analysis confirmed that SIN1 knockdown inhibits the ability of insulin to regenerate the dendritic length, number of branches, field area, and complexity (Sholl analysis) (N = 5 to 6 mice per group, n = 26 to 63 RGCs per group; ANOVA, *P < 0.05, **P < 0.01, ***P < 0.001, and ****P < 0.0001). (M to P) Quantitative analysis of flow cytometry data showed that siSIN1 administration combined with insulin treatment after axotomy significantly reduces the phosphorylation of Akt at Ser473 and Thr308 (N = 4 mice per group, n = 30,000 to 50,000 RGCs per retina; Student’s t test, *P < 0.05). Values are expressed as the means ± SEM.
Fig. 7.
Fig. 7.. Insulin stimulates neuronal survival and restores visual function.
(A and B) Retinas from glaucomatous eyes treated with insulin or saline labeled with RBPMS at 3 weeks after OHT induction. (C) Quantitative analysis shows that insulin promotes RGC survival to levels found in uninjured sham-operated control eyes at 3 and 4 weeks after OHT induction relative to saline controls (N = 3 to 6 mice per group; ANOVA, ***P < 0.001). (D) Two-photon laser scanning microscopy (TPLSM) setup for live imaging of Ca2+ dynamics. LED, light-emitting diode. (E) Thy1-GCaMP6f mouse retina showing GCaMP6f-positive RGCs. (F) GCaMP6f expression in RGCs is confirmed using RBPMS and 4′,6-diamidino-2-phenylindole (DAPI). (G and H) Time-lapse images from longitudinal TPLSM recordings of αON-RGC soma, before (Pre) and after light stimulation in sham retinas (G). Light stimulation elicits a brief Ca2+ transient with fast signal decay (H). (I and J) αON-RGCs from OHT eyes treated with saline display increased Ca2+signal decay time (J). Exponential fits show the decay time constant (τ). (K and L) Insulin treatment restores light-evoked Ca2+ transient dynamics. (M to O) Quantitative analysis shows that Ca2+ decay time is substantially delayed in glaucoma [(M) longer decay time, gray bar], and insulin improves this response [(M) purple bar]. Ca2+ rise rate and peak amplitude do not change across conditions [(N) and (O)] (N = 5 to 6 mice per group, n = 34 to 61 RGCs per group; one-way ANOVA with Tukey’s multiple comparisons post hoc test, *P < 0.05 and n.s.). (P) Optomotor reflex assay setup. (Q to S) Longitudinal optomotor reflexes before (Pre) and after microbead injection shows progressive visual acuity decay with OHT exposure resulting in significant vision loss by 3 weeks of OHT exposure (N = 11 to 14 mice per group; ANOVA, **P < 0.01, ***P < 0.001, and ****P < 0.0001) (Q). Quantitative analysis of the optomotor response at 3 weeks after OHT induction shows a significant improvement in visual acuity in mice treated with insulin relative to saline (N = 11 to 14 mice per group; ANOVA, **P < 0.01, ***P < 0.001, and ****P < 0.0001) [(R) and (S)]. Values are expressed as the means ± SEM. c/d, cycles/degree.

References

    1. Luo L., Architectures of neuronal circuits. Science 373, eabg7285 (2021). - PMC - PubMed
    1. Saxena S., Liebscher S., Editorial: Circuit mechanisms of neurodegenerative diseases. Front. Neurosci. 14, 593329 (2020). - PMC - PubMed
    1. Vyas Y., Montgomery J. M., Cheyne J. E., Hippocampal deficits in amyloid-β-related rodent models of Alzheimer’s disease. Front. Neurosci. 14, 266 (2020). - PMC - PubMed
    1. Brunet A., Stuart-Lopez G., Burg T., Scekic-Zahirovic J., Rouaux C., Cortical circuit dysfunction as a potential driver of amyotrophic lateral sclerosis. Front. Neurosci. 14, 363 (2020). - PMC - PubMed
    1. Blumenstock S., Dudanova I., Cortical and striatal circuits in Huntington’s disease. Front. Neurosci. 14, 82 (2020). - PMC - PubMed

Publication types