. 2024 Aug 9;10(32):eadn7187.
doi: 10.1126/sciadv.adn7187. Epub 2024 Aug 7.

Saponin nanoparticle adjuvants incorporating Toll-like receptor agonists drive distinct immune signatures and potent vaccine responses

Affiliations

Saponin nanoparticle adjuvants incorporating Toll-like receptor agonists drive distinct immune signatures and potent vaccine responses

Ben S Ou et al. Sci Adv. .

Abstract

Over the past few decades, the development of potent and safe immune-activating adjuvant technologies has become the heart of intensive research in the constant fight against highly mutative and immune evasive viruses such as influenza, severe acute respiratory syndrome coronavirus 2 (SARS-CoV-2), and human immunodeficiency virus (HIV). Herein, we developed a highly modular saponin-based nanoparticle platform incorporating Toll-like receptor agonists (TLRas) including TLR1/2a, TLR4a, and TLR7/8a adjuvants and their mixtures. These various TLRa-saponin nanoparticle adjuvant constructs induce unique acute cytokine and immune-signaling profiles, leading to specific T helper responses that could be of interest depending on the target disease for prevention. In a murine vaccine study, the adjuvants greatly improved the potency, durability, breadth, and neutralization of both COVID-19 and HIV vaccine candidates, suggesting the potential broad application of these adjuvant constructs to a range of different antigens. Overall, this work demonstrates a modular TLRa-SNP adjuvant platform that could improve the design of vaccines and affect modern vaccine development.


Figures
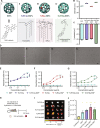
Fig. 1.
Fig. 1.. Design and characterization of TLRa-SNPs.
(A) Schematic representation of SNPs and different formulation of TLRa-SNPs: TLR1/2a-SNP incorporating Pam3CSK4, TLR4a-SNP incorporating MPLA, and TLR7/8a-SNP incorporating imidazoquinoline derivative. Hydrodynamic diameter (B) and surface charge (C) of SNPs and TLRa-SNPs measured by dynamic light scattering and Zetasizer. (D) Cryo-EM of (i) SNP, (ii) TLR1/2a-SNP, (iii) TLR4a-SNP, and (iv) TLR7/8a-SNP, demonstrating the maintenance of the SNP structure after introduction of the TLRas. Scale bars, 50 nm. RAW-Blue macrophage cells incubated with SNPs or TLRa-incorporated SNPs (TLRa-SNPs). Activation curves of (E) soluble TLR1/2a and TLR1/2a-SNP, (F) soluble TLR4a and TLR4a-SNP, and (G) soluble cholesteryl-modified TLR7/8a and TLR7/8a-SNP across a range of TLRa concentrations (0.0091 to 2.22 μg/ml) with 100,000 RAW-Blue cells (n = 3). (H) Schematic of in vivo evaluation of antigen (AF647-NP) accumulation with different TLRa-SNPs and CpG/Alum control. (I) Fluorescence IVIS imaging of the inguinal dLNs 48 hours after subcutaneous injection at the tail base. (J) Quantification of the LN accumulations at 48 hours. Data are shown as means ± SEM. P values were determined with one-way analysis of variance (ANOVA) with Tukey’s test of the absorbance values at the highest TLRa concentration or logged radiant efficiency values. Complete P values for comparisons are shown in tables S3 and S4. *P < 0.05, **P < 0.01, ***P < 0.001, and ****P < 0.0001.
Fig. 2.
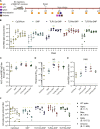
Fig. 2.. In vivo humoral response to RBD-NP vaccines adjuvanted with TLRa-SNPs.
(A) Timeline of immunization and blood collection to determine IgG titers. Mice were immunized on week 0 and boosted on week 3 with RBD-NP vaccines adjuvanted with CpG/Alum, SNP, or TLRa-SNPs. IgG1, IgG2c, neutralization, and variants titers were determined on week 5. (B) Anti-RBD IgG binding endpoint titers of RBD-NP vaccines adjuvanted with CpG/Alum, SNP, or TLRa-SNPs. (C) AUCs of anti-RBD IgG endpoint antibody titers from week 0 to week 11 of the different RBD-NP vaccines. (D) EC50 of anti-RBD IgG endpoint titers on week 5 of the different RBD-NP vaccines. (E) Anti-RBD IgG binding endpoint titers a year (D365) after immunization. (F) Anti-spike IgG binding endpoint titers from sera collected on week 5 after the initial immunization. Titers were determined for wild-type (WT) spike as well as Alpha (B.1.1.7), Beta (B.1.351), Delta (B.1.617.2), and Omicron (B.1.1.529) variants of the spike protein. Data (n = 4 to 5) are shown as means ± SEM. P values were determined using the GLM followed by Tukey’s post hoc comparison procedure on the logged titer values for IgG titer comparisons. Complete P values for comparisons are shown in tables S5 to S9. ns, not significant; *P < 0.05, **P < 0.01, ***P < 0.001, and ****P < 0.0001.
Fig. 3.
Fig. 3.. Neutralizing antibodies in mice after RBD-NP vaccines adjuvanted with TLRa-SNPs.
(A to E) Percent infectivity for all vaccine treatments at a range of week 5 serum dilutions as determined by a SARS-CoV-2 spike-pseudotyped viral neutralization assay. (F) Comparison of ID50 values determined from neutralization curves. Dotted line denotes the threshold for which the FDA considers as high titer (35). (G) Relative percent infectivity of all vaccine formulations compared to convalescent human serum at 1:100 dilution. Data (n = 4 to 5) are shown as means ± SEM. P values were determined using the GLM followed by Tukey’s post hoc multiple comparisons procedure on the logged neutralization ID50 values or relative infectivity comparisons. Complete P values for comparisons are shown in table S10 and S11. **P < 0.01 and ***P < 0.001.
Fig. 4.
Fig. 4.. Antibody subtype response to RBD-NP vaccines adjuvanted with TLRa-SNPs.
(A) Anti-RBD IgG1 and (B) IgG2c titers from sera collected on week 5, 2 weeks after boost. (C) Ratio of anti-RBD IgG2c to IgG1 titers. Lower values (below 1) suggest a TH2 response or humoral response, and higher values (above 1) imply a TH1 response or cellular response. Data (n = 4 to 5) are shown as means ± SEM. P values listed were using the GLM followed by Tukey’s post hoc multiple comparison procedure on the logged titer values. Complete P values for comparisons are shown in tables S12 and S13. *P < 0.05 and **P < 0.01.
Fig. 5.
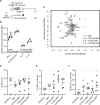
Fig. 5.. dLN analysis postimmunization with RBD-NP vaccines adjuvanted with SNP or TLRa-SNPs.
(A) Timeline of immunization and dLN analysis. Luminex analysis was performed 1 day (24 hours) after vaccination, and flow cytometry was performed to measure GCBC and TFH population 12 days after vaccination. (B) All three TLRa-SNPs induced significantly higher beneficial proinflammatory cytokine levels of IFN-γ, IP10, IL-3, and IL-15 in the dLNs compared to SNPs, reported in MFI. (C) Dimensional reduction analysis of the full murine Luminex 48-plexed cytokine assay (fig. S8) by performing a PSS plot of the RBD-NP vaccines. The result shows a clear separation of vaccines containing different adjuvants, with each number signifying an individual sample from the treatment groups. Vectors are the projection coefficients for each individual cytokine. (D) Total GCBC count and (E) frequency of GCBC from all B cells from RBD-NP vaccines. (F) GCBC-to-TFH cell ratio. Data (n = 4 to 5) are shown as means ± SEM. P values for the Luminex assay were from a generalized maximum entropy estimation regression adjusted to control the false discovery rate, and P values for flow cytometry were determined using the GLM followed by Tukey’s post hoc comparison procedure on the logged values. Complete P values for comparisons are shown in tables S14 to S16 and S18.**P < 0.01, ***P < 0.001, and ****P < 0.0001.
Fig. 6.
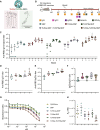
Fig. 6.. TLRa-SNP incorporating both TLR4a and TLR7/8a generated synergistic effect.
(A) Schematic representation of TLR4a-TLR7/8a-SNP for which SNPs coincorporate TLR4a MPLA and TLR7/8a imidazoquinoline derivative. (B) Timeline of RBD-NP vaccines immunization and blood collection to determine IgG titers. Mice were immunized on week 0 and boosted on week 3 with RBD-NP vaccines adjuvanted with a 1:1 mixture of TLR4a-SNP and TLR7/8a-SNP or TLR4a-TLR7/8a-SNP. IgG1, IgG2c, and variants titers were measured on week 5. (C) Anti-RBD IgG binding endpoint titers of RBD-NP vaccines. (D) IgG1 titers and (E) IgG2c titers. (F) Ratio of anti-RBD IgG2c to IgG1 titers. Lower values (below 1) suggest a TH2 response or humoral response, and higher values (above 1) imply a TH1 response or cellular response. (G) Week 7 competitive binding curves for different RBD-NP vaccines compared to an mAb reference competing with the same mAb. OD, optical density. (H) Calculated KD values from fitted binding curves. Data (n = 4 to 5) are shown as means ± SEM. P values were determined using the GLM followed by Tukey’s post hoc comparison procedure on the logged titer values for IgG titer comparisons. Complete P values for comparisons are shown in tables S19 to S22. *P < 0.05, **P < 0.01, ***P < 0.001, and ****P < 0.0001.
Fig. 7.
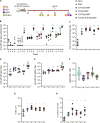
Fig. 7.. In vivo humoral response to HIV gp120 vaccines adjuvanted with TLRa-SNPs.
(A) Timeline of immunization and blood collection to measure IgG titers. Mice were immunized on week 0 and boosted on week 4 with gp120 vaccines adjuvanted with Alum, SNP, or TLRa-SNPs. IgG1 and IgG2c titers were determined on week 6. (B) Anti-gp120 IgG binding endpoint titers of gp120 vaccines adjuvanted with Alum, SNP, or TLRa-SNPs. (C) AUCs of anti-gp120 IgG endpoint antibody titers from week 0 to week 6 of different gp120 vaccines. (D) Anti-gp120 IgG1 and (E) IgG2c titers from sera collected on week 6, 2 weeks after boost. (F) Ratio of anti-gp120 IgG2c to IgG1 titers. Lower values (below 1) suggest a TH2 response or humoral response, and higher values (above 1) imply a TH1 response or cellular response. (G) Total GCBC count from gp120 vaccines and (H) frequency of GCBC from all B cells. Data (n = 5 to 6) are shown as means ± SEM. P values were determined using the GLM followed by Tukey’s post hoc comparison procedure. Complete P values for comparisons are shown in tables S23 to S28. *P < 0.05, **P < 0.01, ***P < 0.001, and ****P < 0.0001.

Update of

Similar articles

Cited by

References

    1. Mascola J. R., Fauci A. S., Novel vaccine technologies for the 21st century. Nat. Rev. Immunol. 20, 87–88 (2020). - PMC - PubMed
    1. Moyle P. M., Toth I., Modern subunit vaccines: Development, components, and research opportunities. ChemMedChem 8, 360–376 (2013). - PubMed
    1. Pulendran B., Arunachalam P. S., O’Hagan D. T., Emerging concepts in the science of vaccine adjuvants. Nat. Rev. Drug Discov. 20, 454–475 (2021). - PMC - PubMed
    1. Maisonneuve C., Bertholet S., Philpott D. J., De Gregorio E., Unleashing the potential of NOD- and Toll-like agonists as vaccine adjuvants. Proc. Natl. Acad. Sci. U.S.A. 111, 12294–12299 (2014). - PMC - PubMed
    1. Duthie M. S., Windish H. P., Fox C. B., Reed S. G., Use of defined TLR ligands as adjuvants within human vaccines. Immunol. Rev. 239, 178–196 (2011). - PMC - PubMed

Publication types