. 2024 Aug 9;10(32):eadn1524.
doi: 10.1126/sciadv.adn1524. Epub 2024 Aug 7.

AlphaFold accelerated discovery of psychotropic agonists targeting the trace amine-associated receptor 1

Affiliations

AlphaFold accelerated discovery of psychotropic agonists targeting the trace amine-associated receptor 1

Alejandro Díaz-Holguín et al. Sci Adv. .

Abstract

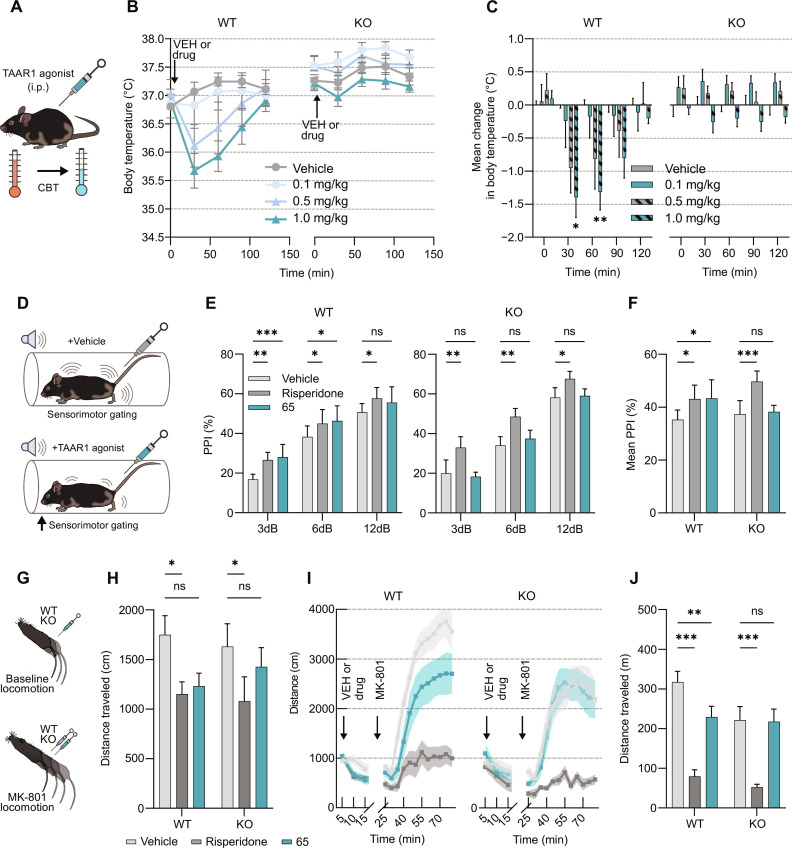
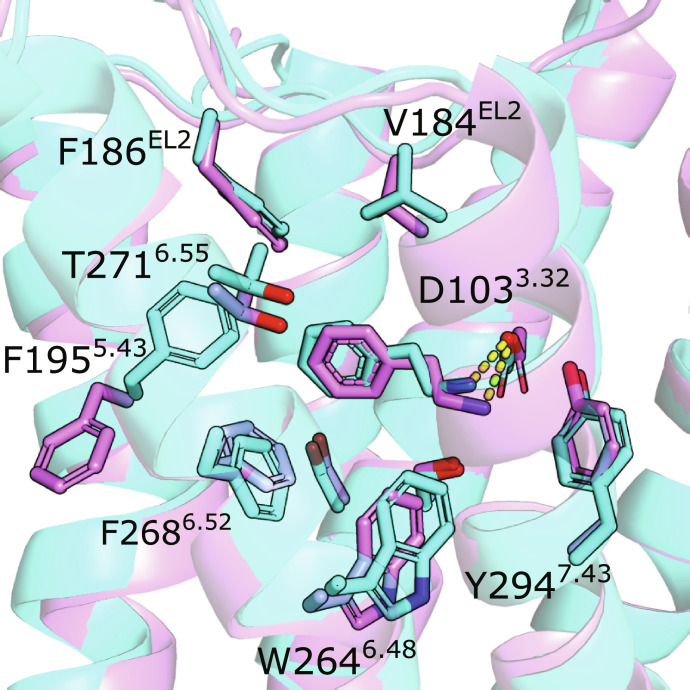
Artificial intelligence is revolutionizing protein structure prediction, providing unprecedented opportunities for drug design. To assess the potential impact on ligand discovery, we compared virtual screens using protein structures generated by the AlphaFold machine learning method and traditional homology modeling. More than 16 million compounds were docked to models of the trace amine-associated receptor 1 (TAAR1), a G protein-coupled receptor of unknown structure and target for treating neuropsychiatric disorders. Sets of 30 and 32 highly ranked compounds from the AlphaFold and homology model screens, respectively, were experimentally evaluated. Of these, 25 were TAAR1 agonists with potencies ranging from 12 to 0.03 μM. The AlphaFold screen yielded a more than twofold higher hit rate (60%) than the homology model and discovered the most potent agonists. A TAAR1 agonist with a promising selectivity profile and drug-like properties showed physiological and antipsychotic-like effects in wild-type but not in TAAR1 knockout mice. These results demonstrate that AlphaFold structures can accelerate drug discovery.


Figures

Fig. 1.
Fig. 1.. Virtual screening performance of homology and AlphaFold models.
(A) TAAR1 models were generated using the homology modeling and AlphaFold methods. (B) Ligand enrichment based on docking calculations of known TAAR1 ligands and decoys for 1000 models generated by homology modeling (HM) and AlphaFold (AF). Distributions of LogAUC and EF1% values are represented as violin plots with the median shown as a dashed line. (C) A library of 16 million compounds was docked to ensembles of five homology and AlphaFold models. Binding modes of top-ranked compounds from the two screens illustrate differences between the AlphaFold and homology models, which are shown as cyan and orange ribbons, respectively. Docked compounds are shown as lines and occupy a larger number of subpockets in the homology model, which are marked with green circles. (D) Experimental evaluation of 62 compounds predicted by docking screens using the homology (right) and AlphaFold (left) models. Compound activity (20 μM) was evaluated by measuring recruitment of Gαs, which was normalized as a percentage of the response elicited by a saturating concentration of β-PEA. Compounds inducing more than 50% response are shown as orange/teal circles (homology modeling/AlphaFold), significant but less than 50% response as light gray circles, and insignificant response as dark gray circles. Data represent means ± SD of two to four technical replicates.
Fig. 2.
Fig. 2.. Binding modes and concentration-response curves of discovered agonists.
(A to C) Predicted binding modes of the three most potent agonists (30, 29, and 27, respectively) identified by docking to the AlphaFold model (magenta cartoons). (D) Predicted binding mode of most potent agonist (compound 62) identified by docking to the homology model (orange cartoons). Ligands and key binding site residues are shown as sticks. The corresponding concentration-response curve from the G protein recruitment assay is shown below each receptor-ligand complex. Data represent means ± SEM of three independent experiments.
Fig. 3.
Fig. 3.. Structure-activity relationships and selectivity profile of TAAR1 agonists.
(A) Exploration of the structure-activity relationships of the scaffold represented by compound 30. (B and C) Concentration-response curves for analogs of compound 30 from the G protein recruitment assay. (D) Heatmap of PRESTO-TANGO screening results for 27 aminergic GPCRs using Ulotaront, 65, and 30. Data represent three to six technical replicates per receptor. β-Arrestin recruitment was normalized as a percentage of the signal emitted by the positive controls [5-hydroxytryptamine (5-HT), quinpirole, epinephrine, and acetylcholine (Ach)] for each receptor (table S5). (E) Concentration-response curves from PRESTO-TANGO assay for compounds 30 and 65 and controls at the 5-HT1D, D2, α2A, and M2 receptors. Data represent means ± SEM of three independent experiments.
Fig. 4.
Fig. 4.. In vivo efficacy and antipsychotic-like activity of compound 65.
(A) Evaluation of CBT change was performed in WT and TAAR1-KO mice after intraperitoneal injection of increasing doses of compound 65 (0.1 to 1 mg/kg, n = 6 to 7 mice per group). i.p., intraperitoneal. (B) CBT was recorded at 30-min intervals over a 120-min period following injection of different doses of compound 65 or vehicle (VEH) in both genotypes. (C) Average CBT shift [from (B)]. *P < 0.05 and **P < 0.005 (65 versus vehicle) based on a two-way analysis of variance (ANOVA), Bonferroni’s multiple comparisons test. (D) PPI was examined in WT (n = 7) and TAAR1-KO (n = 8) mice after intraperitoneal injection of compound 65 (1 mg/kg), Risperidone (0.2 mg/kg), or vehicle. (E) PPI% at each pre-pulse in WT (left) or TAAR1-KO (right). *P < 0.05, **P < 0.005, and ***P < 0.001 (65 or risperidone versus vehicle) based on a two-way ANOVA, Bonferroni’s multiple comparisons test. (F) Average change in PPI (%) across all pre-pulses in WT and TAAR1-KO mice. *P < 0.05 and ***P < 0.001 (65 or risperidone versus vehicle) based on a two-way ANOVA, Bonferroni’s multiple comparisons test. (G) Locomotion experiments were performed in both WT (n = 10) and TAAR1-KO mice (n = 10). (H) Effect of compound 65 (1 mg/kg) or risperidone (0.03 mg/kg) on WT and TAAR1-KO baseline locomotion in the open-field test [*P < 0.05 (65 or risperidone versus vehicle) based on a two-way ANOVA, Bonferroni’s multiple comparisons test] assessed for 10 min before MK-801 injections (0.35 mg/kg) as shown in (I) where time bins indicate 5-min intervals. ns, not significant. (J) Effects of compound 65 or vehicle on suppression of MK-801–induced hyperlocomotion. **P < 0.005 and ***P < 0.001 (65 or risperidone versus vehicle) based on a two-way ANOVA, Bonferroni’s multiple comparisons test. See table S6 for more details on statistical analysis. All error bars represent means ± SEM.
Fig. 5.
Fig. 5.. Predicted and experimental structure of TAAR1 in complex with β-PEA.
Comparison of an AlphaFold model of TAAR1 (cyan) to the cryo-EM structure with PDB accession code 8W89 (violet). The structures have been aligned based on the binding site residues. The receptor is shown as a cartoon. Binding site side chains and the ligand are shown as sticks. Polar interactions are shown as yellow dashed lines.

References

    1. Jumper J., Evans R., Pritzel A., Green T., Figurnov M., Ronneberger O., Tunyasuvunakool K., Bates R., Žídek A., Potapenko A., Bridgland A., Meyer C., Kohl S. A. A., Ballard A. J., Cowie A., Romera-Paredes B., Nikolov S., Jain R., Adler J., Back T., Petersen S., Reiman D., Clancy E., Zielinski M., Steinegger M., Pacholska M., Berghammer T., Bodenstein S., Silver D., Vinyals O., Senior A. W., Kavukcuoglu K., Kohli P., Hassabis D., Highly accurate protein structure prediction with AlphaFold. Nature 596, 583–589 (2021). - PMC - PubMed
    1. Kryshtafovych A., Schwede T., Topf M., Fidelis K., Moult J., Critical assessment of methods of protein structure prediction (CASP)—Round XIV. Protein. Struct. Funct. Bioinform. 89, 1607–1617 (2021). - PMC - PubMed
    1. Tunyasuvunakool K., Adler J., Wu Z., Green T., Zielinski M., Žídek A., Bridgland A., Cowie A., Meyer C., Laydon A., Velankar S., Kleywegt G. J., Bateman A., Evans R., Pritzel A., Figurnov M., Ronneberger O., Bates R., Kohl S. A. A., Potapenko A., Ballard A. J., Romera-Paredes B., Nikolov S., Jain R., Clancy E., Reiman D., Petersen S., Senior A. W., Kavukcuoglu K., Birney E., Kohli P., Jumper J., Hassabis D., Highly accurate protein structure prediction for the human proteome. Nature 596, 590–596 (2021). - PMC - PubMed
    1. Sadybekov A. V., Katritch V., Computational approaches streamlining drug discovery. Nature 616, 673–685 (2023). - PubMed
    1. Irwin J. J., Shoichet B. K., Docking screens for novel ligands conferring new biology. J. Med. Chem. 59, 4103–4120 (2016). - PMC - PubMed

Publication types

LinkOut - more resources