. 2024 Aug 9;10(32):eadn1607.
doi: 10.1126/sciadv.adn1607. Epub 2024 Aug 7.

Cell-specific cross-talk proteomics reveals cathepsin B signaling as a driver of glioblastoma malignancy near the subventricular zone

Affiliations

Cell-specific cross-talk proteomics reveals cathepsin B signaling as a driver of glioblastoma malignancy near the subventricular zone

Emily S Norton et al. Sci Adv. .

Abstract

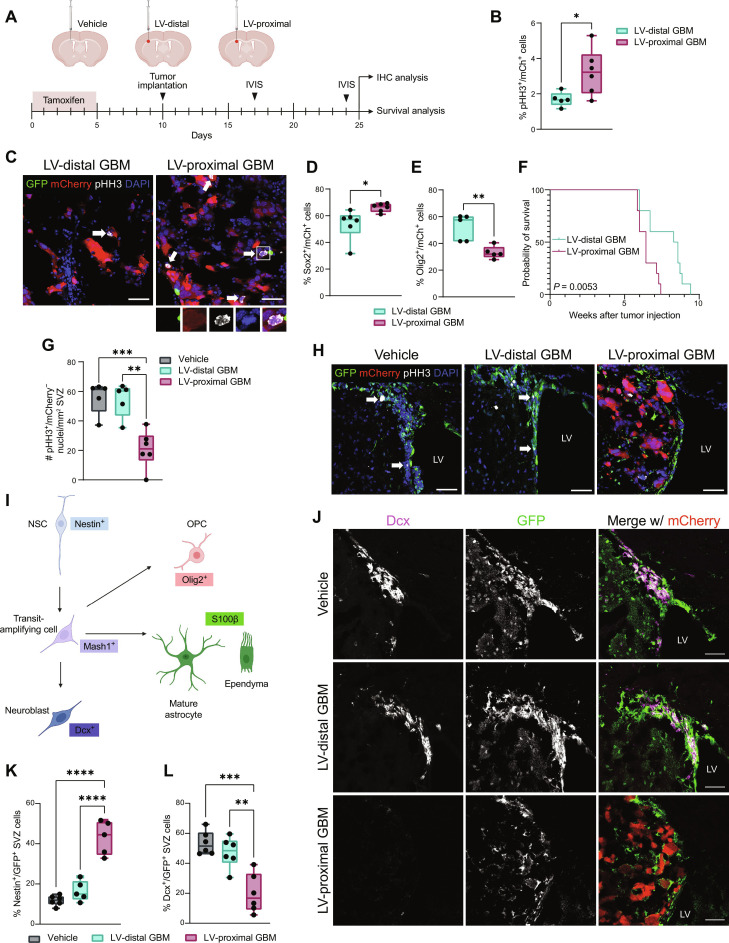
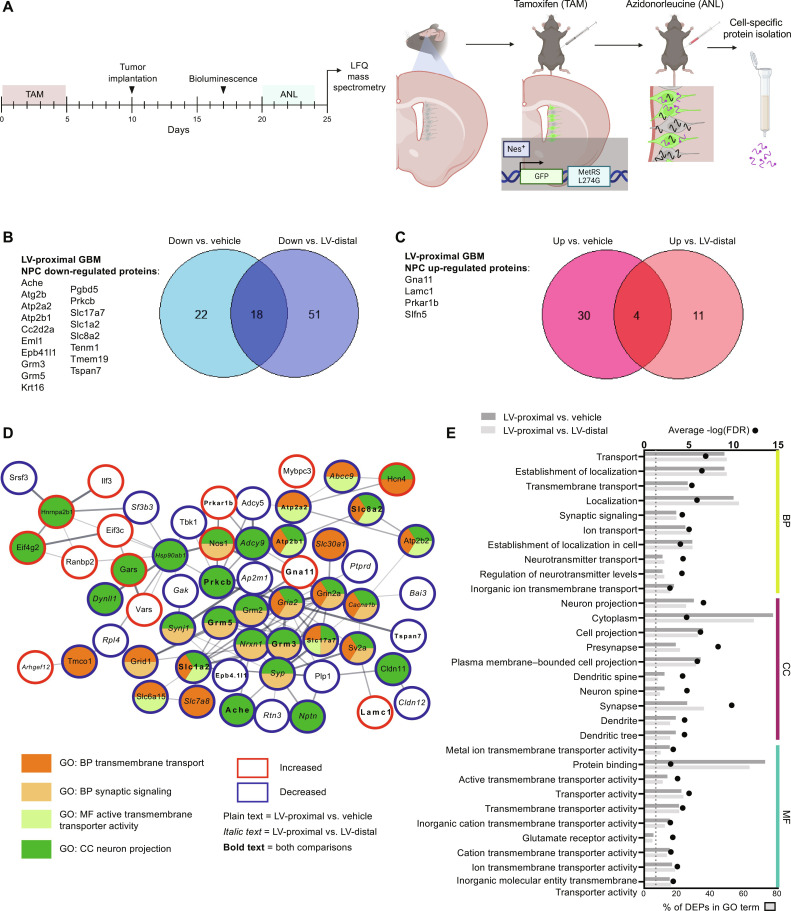
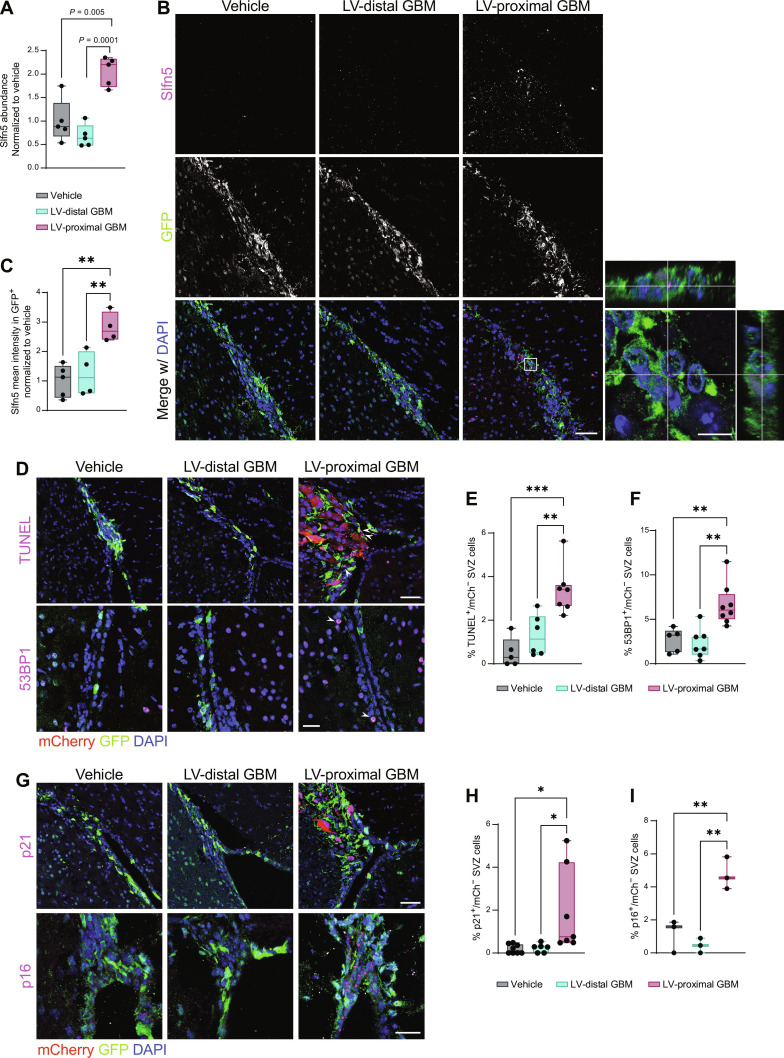
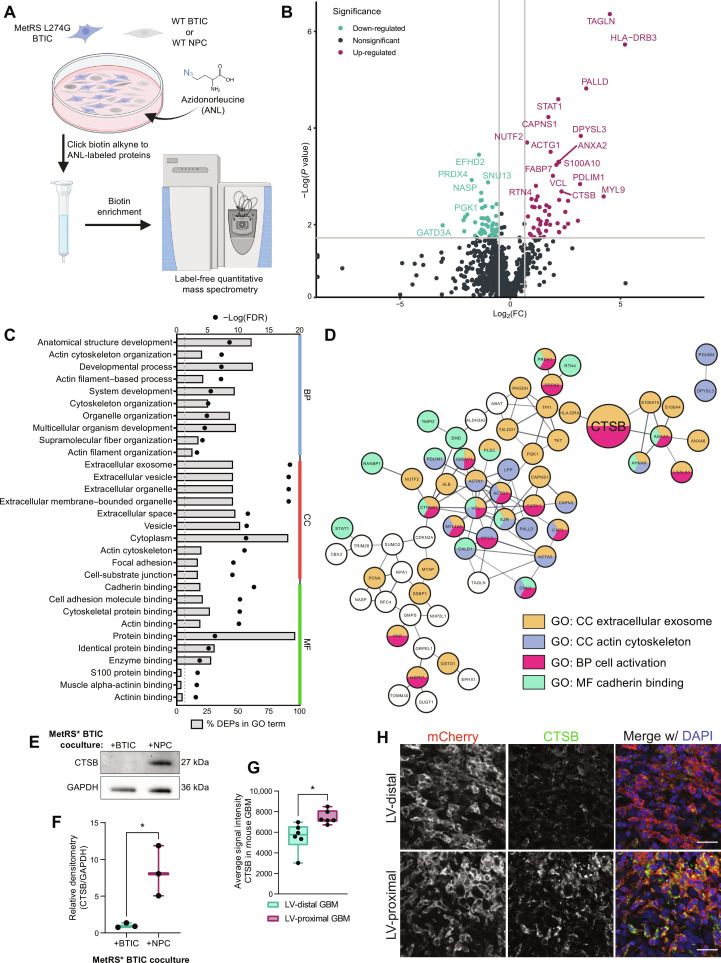
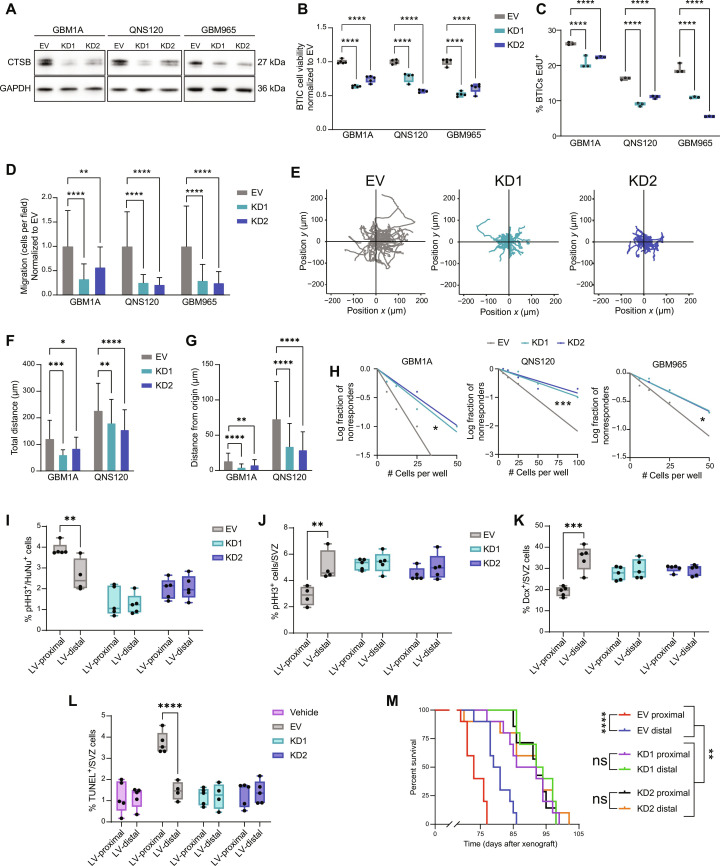
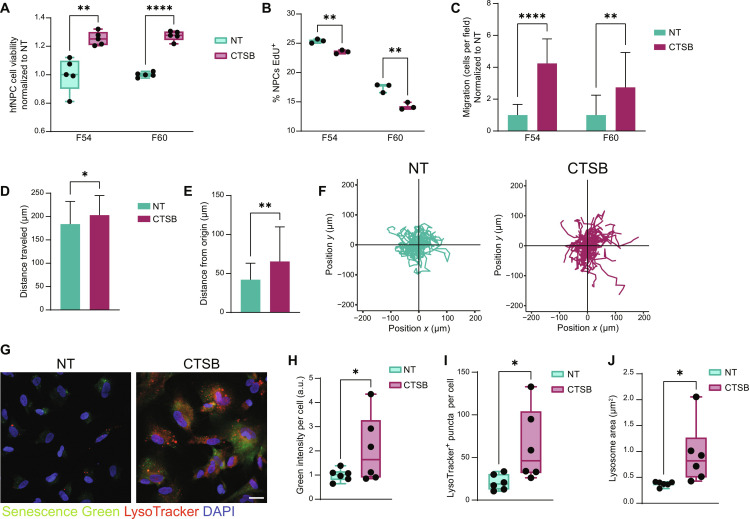
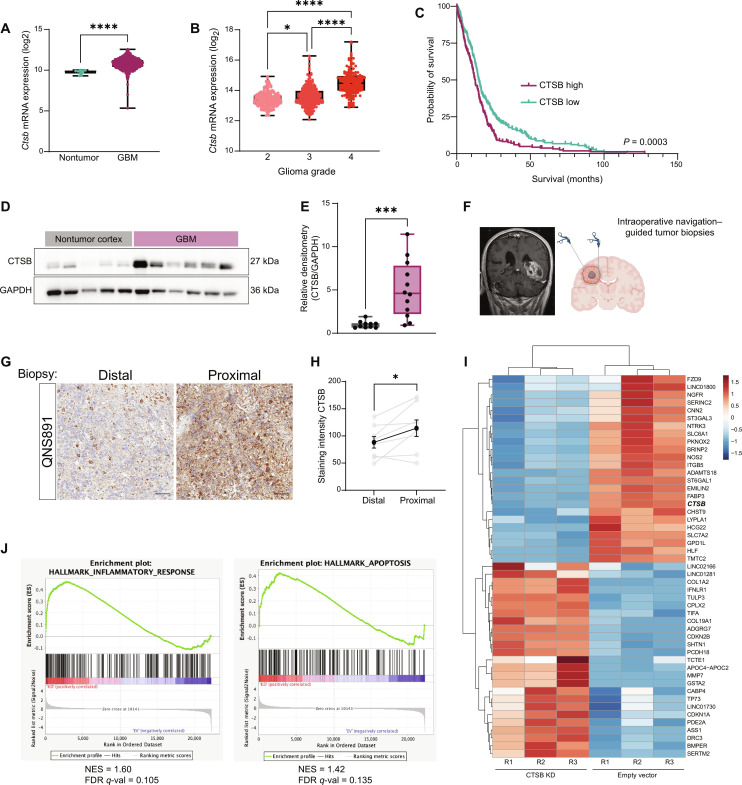
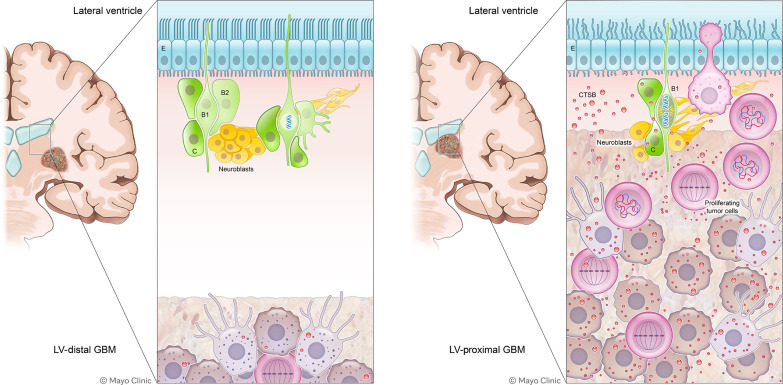
Glioblastoma (GBM) is the most prevalent and aggressive malignant primary brain tumor. GBM proximal to the lateral ventricles (LVs) is more aggressive, potentially because of subventricular zone contact. Despite this, cross-talk between GBM and neural stem/progenitor cells (NSC/NPCs) is not well understood. Using cell-specific proteomics, we show that LV-proximal GBM prevents neuronal maturation of NSCs through induction of senescence. In addition, GBM brain tumor-initiating cells (BTICs) increase expression of cathepsin B (CTSB) upon interaction with NPCs. Lentiviral knockdown and recombinant protein experiments reveal that both cell-intrinsic and soluble CTSB promote malignancy-associated phenotypes in BTICs. Soluble CTSB stalls neuronal maturation in NPCs while promoting senescence, providing a link between LV-tumor proximity and neurogenesis disruption. Last, we show LV-proximal CTSB up-regulation in patients, showing the relevance of this cross-talk in human GBM biology. These results demonstrate the value of proteomic analysis in tumor microenvironment research and provide direction for new therapeutic strategies in GBM.


Figures

Fig. 1.
Fig. 1.. Tumor malignancy is increased and SVZ neurogenesis is decreased in LV-proximal GBM-bearing animals.
(A) Experimental groups and timeline. Created with Biorender.com. (B) Percentage quantification of proliferation in murine GBM cells in vivo (n = 5 to 6 biological replicates). Data compared using two-tailed unpaired t test. (C) Representative immunohistochemistry (IHC) showing proliferation in GL261 mCh+ tumors. White arrows and inset indicate proliferating tumor cells. Scale bar, 50 μm. DAPI, 4′,6-diamidino-2-phenylindole. (D) Percentage quantification of Sox2+/mCh+ tumor cells (n = 6 biological replicates). Data compared using two-tailed unpaired t test. (E) Percentage quantification of Olig2+/mCh+ tumor cells (n = 5 biological replicates). Data compared using Mann-Whitney test. (F) Kaplan-Meier curves of survival outcomes for LV-distal GBM and LV-proximal GBM-bearing animals (n = 10 biological replicates). Data compared using Mantel-Cox log-rank test. (G) Quantification of proliferative (pHH3+) cells/mm2 SVZ (n = 5 to 6 biological replicates). Data compared using ordinary one-way analysis of variance (ANOVA) with Tukey multiple comparisons. (H) Representative IHC showing proliferation in the SVZ. White arrows indicate proliferating GFP+ cells. Scale bar, 50 μm. (I) Schematic describing neurogenesis markers used and cell types labeled. Created with Biorender.com. (J) Representative IHC showing Dcx+/GFP+ cells in the SVZ. Scale bar, 50 μm. (K) Percentage quantifications of GFP+ cells in the SVZ that are Nestin+ (n = 5 to 6 biological replicates). Data tested with ordinary one-way ANOVA with Tukey multiple comparisons. (L) Percentage quantifications of GFP+ cells in the SVZ that are Dcx+ (n = 5 to 6 biological replicates). Data tested with ordinary one-way ANOVA with Tukey’s multiple comparison. Data represented as median ± minimum/maximum; *P < 0.05, **P < 0.01, ***P < 0.001, ****P < 0.0001.
Fig. 2.
Fig. 2.. Cell-specific quantitative proteomics of SVZ NPCs reveals decreased expression of neuronal maturation proteins in the presence of LV-proximal glioma.
(A) Schematic illustrating experimental timeline and methodology for Fig. 2. Created with Biorender.com. (B) Venn diagram and list of down-regulated proteins in the SVZ of LV-proximal GBM animals compared to vehicle and LV-distal GBM controls. (C) Venn diagram and list of up-regulated proteins in the SVZ of LV-proximal GBM animals compared to vehicle and LV-distal GBM controls. (D) STRING interaction network for a subset of the LV-proximal GBM-associated DEPs that belong to the indicated GO or KEGG terms or directly interact with proteins belonging to these terms. Node colors indicate protein affiliation with the indicated terms. Plain text indicates a DEP in the LV-proximal GBM versus vehicle interaction. Italic text indicates a DEP in the LV-proximal GBM group versus LV-distal GBM group. Bold text indicates the DEP overlaps between the two interactions. (E) Overlapping GO terms between the two interaction DEPs. BP, biological process; CC, cellular compartment; MF, molecular function.
Fig. 3.
Fig. 3.. LV-proximal GBM induces increased DNA damage and senescence in SVZ NPCs.
(A) LFQ proteomic results for Slfn5 quantification (n = 5 biological replicates). Normalized to vehicle group. Data were compared with one-way ANOVA with false discovery rate (FDR) correction. (B) Representative immunofluorescent images of increased Slfn5+ in GFP+ cells of the LV-proximal GBM SVZ. Scale bar, 25 μm. White box indicates where inset on right is taken, showing Slfn5+ puncta within GFP+ cells. Scale bar for inset, 10 μm. (C) Slfn5+ mean intensity quantification in GFP+ cells via immunofluorescence (n = 4 to 5 biological replicates). Normalized to vehicle group. Data were compared via ordinary one-way ANOVA with Tukey multiple comparisons. (D) Representative immunofluorescence images of increased TUNEL+ cells (top) and increased 53BP1+ cells (bottom) in LV-proximal GBM SVZ. Scale bar, 50 μm for TUNEL images and 25 μm for 53BP1 images. White arrows indicate DNA damage+/mCh nuclei. (E) Quantification of percentage of TUNEL+ cells in SVZ (n = 5 to 7 biological replicates). Data were compared via ordinary one-way ANOVA with Tukey multiple comparisons. (F) Quantification of percentage of 53BP1+ cells in SVZ (n = 5 to 7 biological replicates). Data were compared via ordinary one-way ANOVA with Tukey multiple comparisons. (G) Representative immunofluorescence images of increased p21+ cells (top) and p16+ cells (bottom) in LV-proximal GBM SVZ. Scale bar, 50 μm for p21 images and 25 μm for p16 images. (H) Quantification of percentage of p21+ cells in SVZ (n = 5 to 7 biological replicates). Data were compared via ordinary one-way ANOVA with Tukey multiple comparisons. (I) Quantification of percentage of p16+ cells in SVZ (n = 3 biological replicates). Data were compared via ordinary one-way ANOVA with Tukey multiple comparisons. Data represented as median ± minimum/maximum; *P < 0.05, **P < 0.01, ***P < 0.001, ****P < 0.0001.
Fig. 4.
Fig. 4.. BTIC coculture with hfNPCs results in GBM-specific increase in the expression of promalignancy proteins including CTSB.
(A) Schematic illustrating coculture setup. Created with Biorender.com. WT, wild-type. (B) Volcano plot of BTIC-specific proteins up-regulated and down-regulated by coculture with NPCs. Gray lines indicate fold change = 1.5 (x axis) and adjusted P value at 0.05 (y axis). (C) Top 10 GO terms in each GO category associated with DEPs from BTIC coculture proteomics. Both the percentage of DEPs (bars) and FDR (points) of terms are included. (D) STRING interaction network for a subset of the NPC coculture associated DEPs that belong to the indicated GO or KEGG terms or directly interact with proteins belonging to these terms. Node colors indicate protein affiliation with the indicated terms. CTSB highlighted by larger size. (E) Representative Western blot for CTSB in BTIC-specific proteins from control coculture and NPC coculture. Glyceraldehyde-3-phosphate dehydrogenase (GAPDH) is shown as a loading control. (F) Quantification of Western blot densitometry for GBM1A BTIC-specific CTSB normalized to GAPDH (n = 3 biological replicates). Data were compared with two-tailed unpaired t test. (G) Quantification of IHC mean intensity of CTSB within murine GBM (n = 6 biological replicates). Data were compared with two-tailed unpaired t test. (H) Representative IHC of mouse tumors showing increased CTSB in LV-proximal GBM. Scale bar, 25 μm. Data represented as median ± minimum/maximum; *P < 0.05, **P < 0.01, ***P < 0.001, ****P < 0.0001.
Fig. 5.
Fig. 5.. Cell-intrinsic CTSB contributes to GBM malignancy and LV-proximal GBM phenotypes.
(A) Western blot confirming CTSB KD. (B) BTICs cell viability at 48 hours (n = 5 technical replicates). Normalized to EV. (C) EdU proliferation assay in EV and CTSB KD (n = 3 technical replicates). (D) Transwell migration of EV and CTSB KD. (E) Representative plots of migration from origin in QNS120 EV and CTSB KD. (F) Total distance traveled by EV and CTSB KD BTICs in time-lapse migration. (G) Distance from origin traveled by EV and CTSB KD BTICs in time-lapse migration. (H) LDA self-renewal for EV and CTSB KD. (I) Proliferation in EV and CTSB KD GBM1A tumors proximal or distal to LV (n = 4 to 5 biological replicates). (J) Proliferation in the SVZ in the presence of EV and CTSB KD GBM1A tumors proximal or distal to LV (n = 4 to 5 biological replicates). (K) Quantified Dcx+ neuroblasts in the SVZ in the presence of EV and CTSB KD GBM1A tumors proximal or distal to LV (n = 5 biological replicates). (L) Quantified TUNEL+ cells in the SVZ in the presence of PBS vehicle injection or EV and CTSB KD GBM1A tumors proximal or distal to LV (n = 4 to 5 biological replicates). (M) Kaplan-Meier curves of mice bearing EV or CTSB shRNA GBM1A tumors proximal or distal to LV (n = 7 to 10 biological replicates). Data represented as median ± maximum/minimum (box and whisker) or mean ± SD (bar charts). Data compared with two-way ANOVA, Dunnett multiple comparisons for (B), (C), (D), (F), and (G); Pearson’s chi-square test for (H); two-way ANOVA, Šídák multiple comparisons for (I) to (L); and Mantel-Cox log-rank test accounting for multiple comparisons for (M). *P < 0.05, **P < 0.01, ***P < 0.001, ****P < 0.0001. ns, not significant.
Fig. 6.
Fig. 6.. Soluble CTSB contributes to decreased proliferation and increased senescence of hfNPCs.
(A) hfNPC cell viability measurements for NT and +CTSB at 48 hours (n = 5 technical replicates). Data were tested with multiple unpaired t tests with Benjamini FDR. (B) Proliferation assay indicating percentage of EdU+ hfNPCs in NT and +CTSB conditions (n = 3 technical replicates). Data were tested with multiple unpaired t tests with Benjamini FDR. (C) Transwell migration of hfNPCs NT and +CTSB. Data were tested with Data were tested with multiple unpaired t tests with Benjamini FDR. (D) Total distance traveled by hfNPCs F54 NT and +CTSB in time-lapse migration. Data were compared with two-tailed unpaired t test. (E) Distance from origin traveled by hfNPCs F54 NT and +CTSB in time-lapse migration. Data were tested with two-tailed unpaired t test. (F) Representative plots of hfNPC migration from origin when NT or +CTSB in line F54. (G) Representative immunofluorescent images of F60 with Senescence Green (β-galactosidase) and LysoTracker labeling in NT or +CTSB conditions. Scale bar, 25 μm. (H) Quantification of Senescence Green levels in F60 NT or +CTSB (n = 6 technical replicates). Normalized to NT. Data were tested with unpaired t test. (I) Quantification of number of LysoTracker+ lysosomes per cell (n = 6 technical replicates). Data were tested with two-tailed unpaired t test. (J) Quantification of LysoTracker puncta area per cell (n = 6 technical replicates). Data were tested with two-tailed unpaired t test. Data represented as median ± maximum/minimum (box and whisker) or mean ± SD (bar charts); *P < 0.05, **P < 0.01, ***P < 0.001, ****P < 0.0001.
Fig. 7.
Fig. 7.. CTSB plays a role in the malignancy of patient LV-contacting GBM.
(A) CTSB gene expression in nontumor and GBM tissues from TCGA database. Data were tested with Mann-Whitney test. (B) CTSB gene expression among different glioma grades from TCGA database. Data were tested with one-way ANOVA with Tukey multiple comparisons. (C) Kaplan-Meier curves of survival outcomes for CTSB-high and CTSB-low GBM. Groups separated at median expression. Data were tested with Mantel-Cox log-rank test. (D) Representative Western blot for CTSB in patient-derived nontumor cortex and GBM tissues. (E) Quantification of Western blot densitometry data from patient tissues (n = 10 to 12 biological replicates). Normalized to nontumor cortex. Data were tested with two-tailed unpaired t test. (F) Schematic outlining collection of matched patient-derived biopsies from LV-contacting tumors. Created in Biorender.com. (G) Representative staining for CTSB in matched patient-derived LV-distal and LV-proximal biopsies for GBM patient QNS891. (H) Quantification of CSTB staining intensity in matched LV-distal and LV-proximal GBM biopsies (n = 8 biological replicates). Data were tested with two-tailed paired t test. (I) Gene heatmap of the 25 most down-regulated and up-regulated genes in GBM1A BTIC CTSB KD compared to EV controls (n = 3 technical replicates). CTSB gene indicated in bold text. (J) GSEA plots for inflammatory response and apoptosis hallmark gene sets indicating increase in CTSB KD. Data represented as median ± maximum/minimum (box and whisker) or mean ± SD (line graph), *P < 0.05, **P < 0.01, ***P < 0.001, ****P < 0.0001.
Fig. 8.
Fig. 8.. A schematic summarizing these findings.
B1 and B2, SVZ neurogenic astrocytes; C, transit-amplifying progenitor; E, ependymal layer.

Update of

References

    1. Ostrom Q. T., Price M., Neff C., Cioffi G., Waite K. A., Kruchko C., Barnholtz-Sloan J. S., CBTRUS statistical report: Primary brain and other central nervous system tumors diagnosed in the United States in 2016-2020. Neuro Oncol. 25, iv1–iv99 (2023). - PMC - PubMed
    1. Bartkowiak T., Lima S. M., Hayes M. J., Mistry A. M., Brockman A. A., Sinnaeve J., Leelatian N., Roe C. E., Mobley B. C., Chotai S., Weaver K. D., Thompson R. C., Chambless L. B., Ihrie R. A., Irish J. M., An immunosuppressed microenvironment distinguishes lateral ventricle-contacting glioblastomas. JCI Insight 8, e160652 (2023). - PMC - PubMed
    1. Chaichana K. L., McGirt M. J., Frazier J., Attenello F., Guerrero-Cazares H., Quinones-Hinojosa A., Relationship of glioblastoma multiforme to the lateral ventricles predicts survival following tumor resection. J. Neurooncol. 89, 219–224 (2008). - PubMed
    1. Lim D. A., Cha S., Mayo M. C., Chen M. H., Keles E., VandenBerg S., Berger M. S., Relationship of glioblastoma multiforme to neural stem cell regions predicts invasive and multifocal tumor phenotype. Neuro Oncol. 9, 424–429 (2007). - PMC - PubMed
    1. Mistry A. M., Hale A. T., Chambless L. B., Weaver K. D., Thompson R. C., Ihrie R. A., Influence of glioblastoma contact with the lateral ventricle on survival: A meta-analysis. J. Neurooncol 131, 125–133 (2017). - PMC - PubMed

Publication types

MeSH terms