Comparative Study
. 2024 Jul 1;101(7):451-463.
doi: 10.1097/OPX.0000000000002160.

A new, adaptive, self-administered, and generalizable method used to measure visual acuity

Affiliations
Comparative Study

A new, adaptive, self-administered, and generalizable method used to measure visual acuity

Jan Skerswetat et al. Optom Vis Sci. .

Abstract

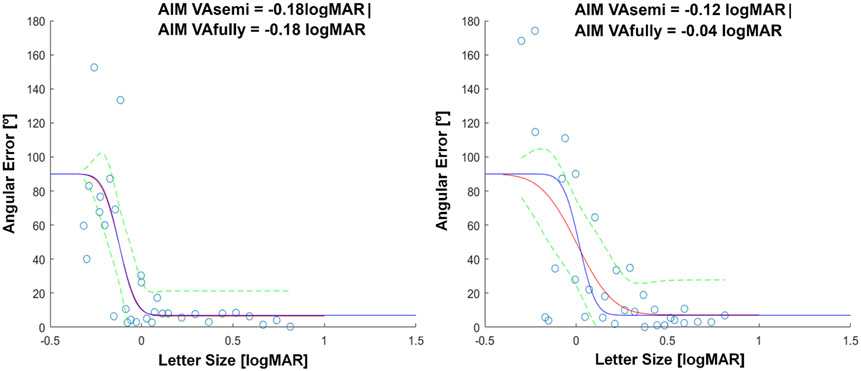
Significance: Angular Indication Measurement (AIM) is an adaptive, self-administered, and generalizable orientation-judgment method designed to interrogate visual functions. We introduce AIM Visual Acuity (VA) and show its features and outcome measures. Angular Indication Measurement VA's ability to detect defocus was comparable with that of an Early Treatment of Diabetic Retinopathy Study (ETDRS) letter chart and showed greater sensitivity to astigmatic blur.

Purpose: This proof-of-concept study introduces Angular Indication Measurement and applies it to VA.

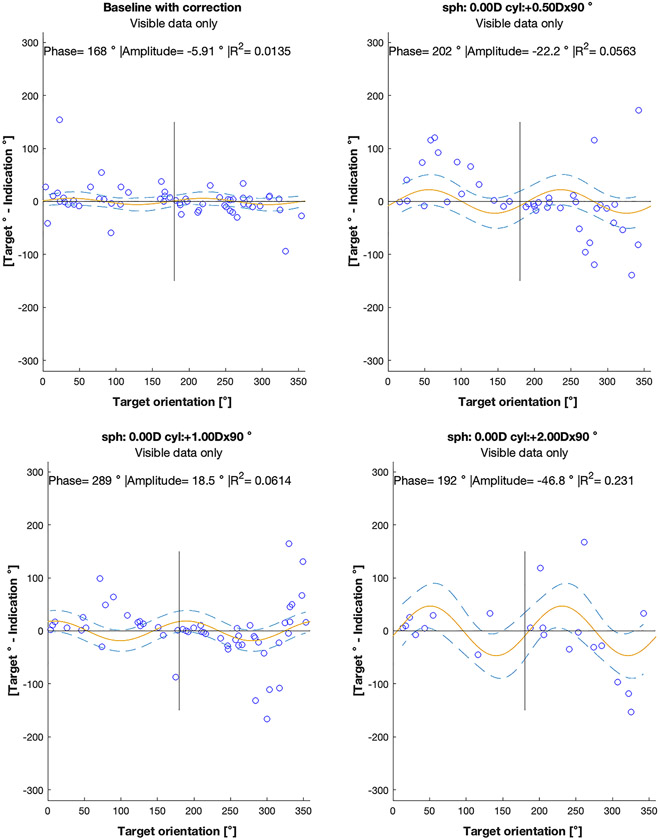
Methods: First, we compared the ability of AIM-VA and ETDRS to detect defocus and astigmatic blur in 22 normally sighted adults. Spherical and cylindrical lenses in the dominant eye induced blur. Second, we compared repeatability over two tests of AIM-VA and ETDRS.

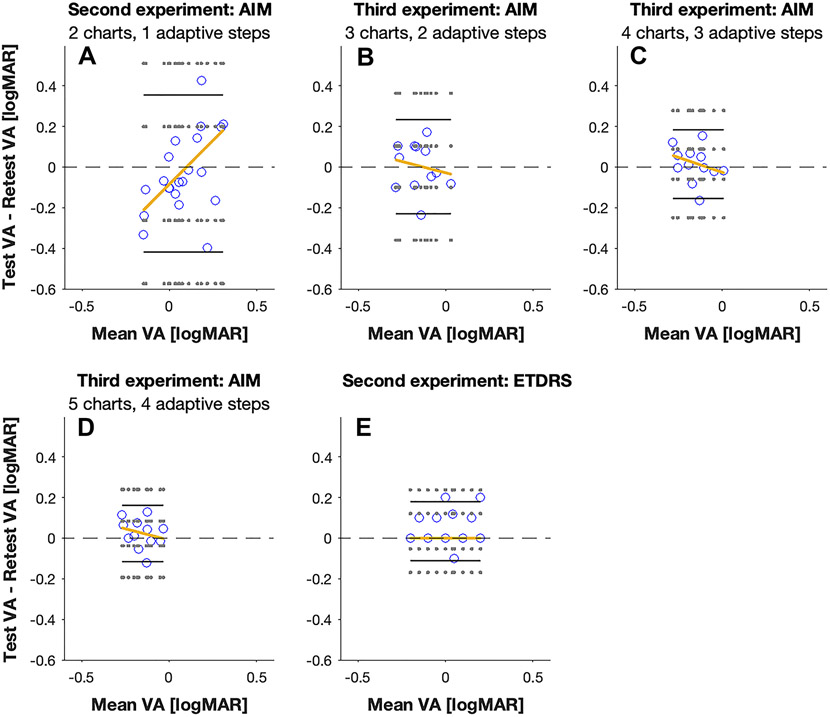
Results: A repeated-measure analysis of variance showed a main effect for defocus blur and test. For the astigmatism experiment, an interaction between blur and orientation was found. Pairwise comparisons showed that AIM was more sensitive to astigmatic-induced VA loss than ETDRS. Bland-Altman plots showed small bias and no systematic learning effect for either test type and improved repeatability with more than two adaptive steps for AIM-VA.

Conclusions: Angular Indication Measurement VA's ability to detect defocus was comparable with that of an ETDRS letter chart and showed greater sensitivity to induced astigmatic blur, and AIM-VA's repeatability is comparable with ETDRS when using two or more adaptive steps. Angular Indication Measurement's self-administered orientation judgment approach is generalizable to interrogate other visual functions, e.g., contrast, color, motion, and stereovision.


Conflict of interest statement

Conflict of Interest Disclosure: AIM is disclosed as patented (status pending during the time of submission) and held by Northeastern University, Boston, USA. JS and PJB are founders and shareholders of PerZeption Inc., which has an exclusive license agreement for AIM. All other authors declare no conflict of interests.

Figures

Appendix figure A1.
Appendix figure A1.
Impact of the number of free parameters on psychometric function fits. Standard Acuity estimates (e.g. Early Treatment Diabetic Retinopathy Study [ETDRS]) return a single parameter estimate, whereas AIM results are based on the fits of a psychometric function with 3 free parameters (equation 1 in the main manuscript), which increases variance on the estimate of each parameter. To decrease the difference between methods, we compared a full model with 3 free parameters per psychometric function (right panel) with a constrained model in which the slope and minimum report error parameters were shared across all the data for a single observer (left panel).
Appendix figure A2.
Appendix figure A2.
Angular indication measurement (AIM)-visual acuity (VA) psychometric function parameters (graph subtitle) as a function of defocus from the pilot experiment. X axis shows the added defocus in diopters, y axis shows the parameter values for visual acuity, slope, minimum report error (noise), and range of stimulus detectability improvement (ROSDI). Data for individual observers are shown as colored lines, the group mean is shown by the black lines. Visual acuity was fit to a fully constrained fit, i.e. only threshold varied, slope and noise were fixed, resulting in ceiling acuity of 0.76 logMAR. Slope, noise, and ROSDI were fit to a semi-constraint fit. The range from −10.00D to +3.00D was plotted and analyzed as all participants were able to see the first chart with these lenses.
Appendix figure A3.
Appendix figure A3.
Results for changes of the amplitude shifts of the sinewave model due to induced spherical blur.
Appendix figure A4.
Appendix figure A4.
Results for changes of the phase of the sinewave model due to induced astigmatic blur.
Figure 1.
Figure 1.
Schematic of Angular Indication Measurement (AIM) principal. (A) In series of charts, each containing a 4*4 grid of cells, stimuli that range from easy to hard-to-detect are presented while being scaled logarithmically and randomized in regards of size and gap orientation. Each cell consists of a stimulus surrounded by a response ring. Participants reported the orientation of the C optotype in each cell by clicking on the corresponding location on the response ring. Their response is indicated by an arc on the ring, and participants are able to adjust their response by clicking again on the response ring. After a response has been made for all cells, a ‘Next’ button is presented, which participants can click when they are satisfied with their responses to the chart. The stimulus sizes on the next chart are updated, based on the responses to stimuli in previous charts and again logarithmically scaled in size. (B) Schematic of AIM scoring and outcome parameters. Y-axis represent the angular indication error, the x-axis the stimulus size. (C) Representative results and fit after three charts including psychometric function (red line), 95% confidence intervals (dashed green lines), and single responses (blue circles).
Figure 2.
Figure 2.
Results for induced spherical defocus results for Angular Indication Measurement (AIM) and Early Treatment Diabetic Retinopathy Study (ETDRS). Shown are interquartile range (boxes), medians and means (horizontal lines and squares within each box, respectively), single outcomes (dots) jittered by a kernel density estimate horizontally, whiskers for extreme values, and red + for outliers. Depicted are visual acuity (VA) results (y-axis) for each effective blur level at 4m distance (i.e., lens power minus 0.25D accommodation), using plano lens, +0.25D, +0.50D, +0.75D, +1.00D, +2.00D spherical lenses.
Figure 3.
Figure 3.
Results for Angular Indication Measurement (AIM) and Early Treatment Diabetic Retinopathy Study (ETDRS) visual acuities using cylindrical lenses. Depicted are visual acuity (VA) results (y-axis) for each blur lens (x-axis), i.e., +0.50D (blue), +1.00D (green), and +2.00D (red) cylindrical powers in combination with 0°, 90°, 135° induced orientations.
Figure 4.
Figure 4.
Schematic representation of error bias during induced astigmatism. (A) Three types of responses can occur: correct response (indicated orientation= true orientation), clockwise and anti-clockwise error response. (B) Distortion bias due to positive plano-cylindrical induced astigmatism induces a sinusoidal change of error bias depending on the location of the gap relative to the astigmatism axis. The amplitude of the function refers to the level of distortion and thus is a function of astigmatic power. (C) Simulation of the effect of astigmatic blur on the perceived orientation and visibility of the aperture in a C optotype. The inset shows the ellipse digital filter that was convolved with a horizontally-oriented C stimulus over 22.5° steps.
Figure 5.
Figure 5.
Example for an individual’s data and model for the baseline and 90° orientated plano-cylindrical +0.50 D, +1.00 D, and +2.00 D blur conditions. The top graphs included all data whereas the bottom graphs include only data for stimuli sizes and respective responses that were visible i.e., ≥ the acuity for the condition. Within each graph, the orientation of each target ring was randomized, y-axis shows orientation report error, and the x axis shows the target orientation. The orange line represents the best fitting sinewave function, the blue dashed lines show the 95% confidence intervals, single indications are shown as blue circles. The phase, amplitude, and goodness-of-fit R2 are depicted above.
Figure 5.
Figure 5.
Example for an individual’s data and model for the baseline and 90° orientated plano-cylindrical +0.50 D, +1.00 D, and +2.00 D blur conditions. The top graphs included all data whereas the bottom graphs include only data for stimuli sizes and respective responses that were visible i.e., ≥ the acuity for the condition. Within each graph, the orientation of each target ring was randomized, y-axis shows orientation report error, and the x axis shows the target orientation. The orange line represents the best fitting sinewave function, the blue dashed lines show the 95% confidence intervals, single indications are shown as blue circles. The phase, amplitude, and goodness-of-fit R2 are depicted above.
Figure 6.
Figure 6.
Bland-Altman plots for repeatability comparing Angular Indication Measurement–Visual Acuity (AIM-VA) with an initial chart and one adaptive step (A) and Early Treatment Diabetic Retinopathy Study (ETDRS) with the same single chart repeated once (E) from the second experiment. Also shown are the control experiment results with two (B), three (C), and four (D) adaptive steps. Each y-axis shows the visual acuity (VA) test-retest difference in logMAR, each x-axis depicts the mean VA for test and retest VA results. Single circles represent data from individual participants, black horizontal lines represent limits of agreement and their upper and lower 95% confidence intervals (black dotted lines) for test-retest VA difference, orange lines represent the linear function fits.

Update of

Similar articles

Cited by

References

    1. Raasch TW. Spherocylindrical refractive errors and visual acuity. Optom Vis Sci 1995;72:272–5. - PubMed
    1. Holz FG, Tadayoni R, Beatty S, et al. Key drivers of visual acuity gains in neovascular age-related macular degeneration in real life: Findings from the AURA study. Br J Ophthalmol 2016;100:1623–8. - PMC - PubMed
    1. Shandiz JH, Derakhshan A, Daneshyar A, et al. Effect of cataract type and severity on visual acuity and contrast sensitivity. J Ophthalmic Vis Res 2011;6:26–31. - PMC - PubMed
    1. Wilhelm H, Schabet M. The diagnosis and treatment of optic neuritis. Dtsch Arztebl Int 2015;112:616–25. - PMC - PubMed
    1. Levi DM. Rethinking amblyopia 2020. Vision Res 2020;176:118–29. - PMC - PubMed

Publication types

LinkOut - more resources