. 2024 Sep 25;112(18):3058-3068.e8.
doi: 10.1016/j.neuron.2024.07.007. Epub 2024 Aug 6.

SYNGAP1 deficiency disrupts synaptic neoteny in xenotransplanted human cortical neurons in vivo

Affiliations

SYNGAP1 deficiency disrupts synaptic neoteny in xenotransplanted human cortical neurons in vivo

Ben Vermaercke et al. Neuron. .

Abstract

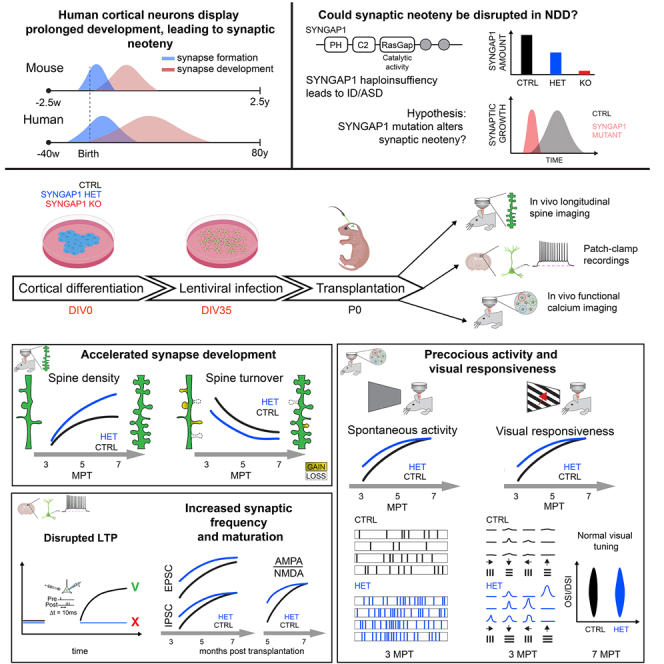
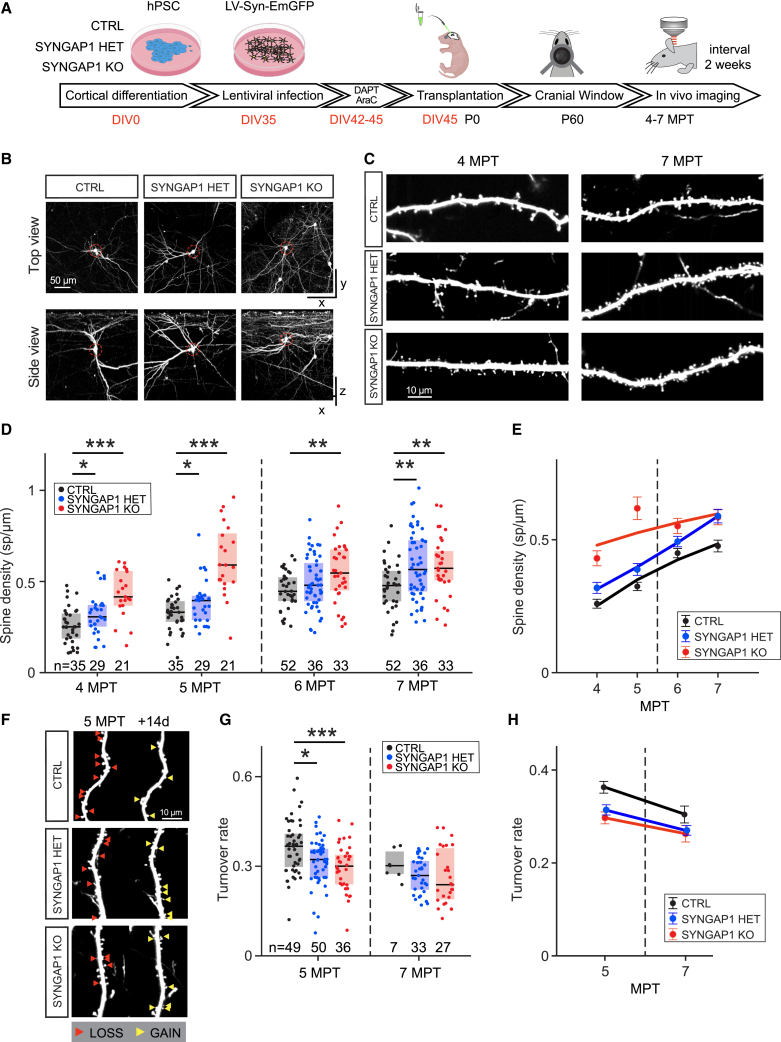
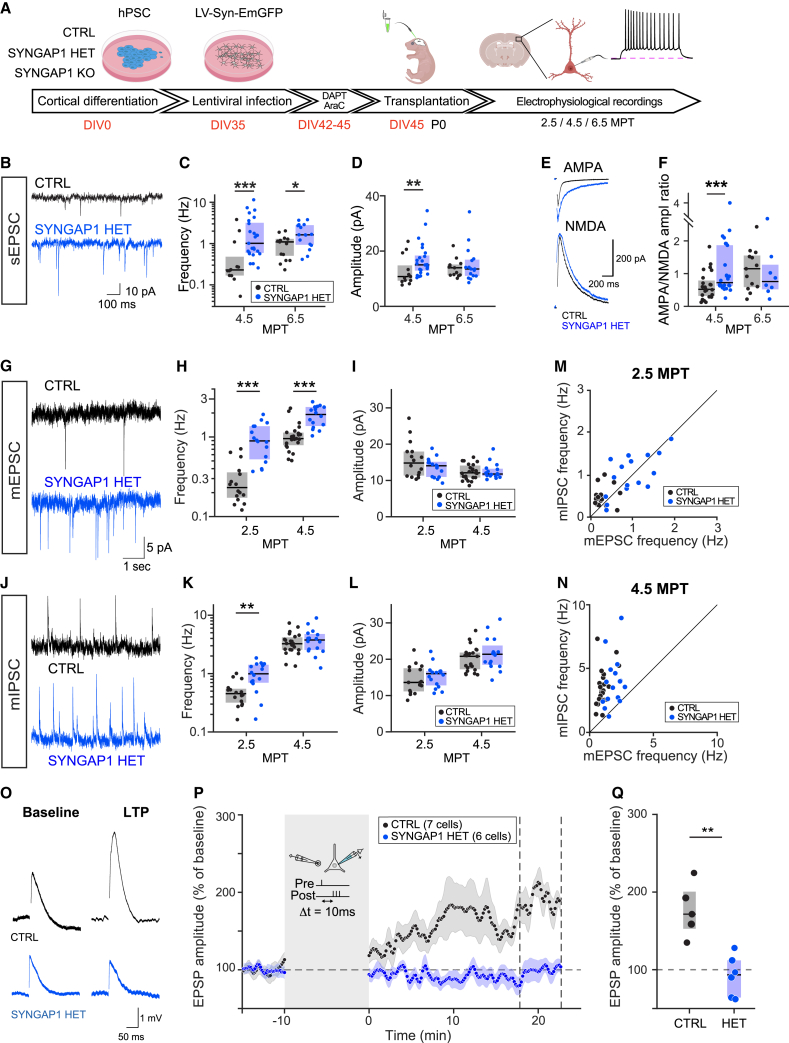
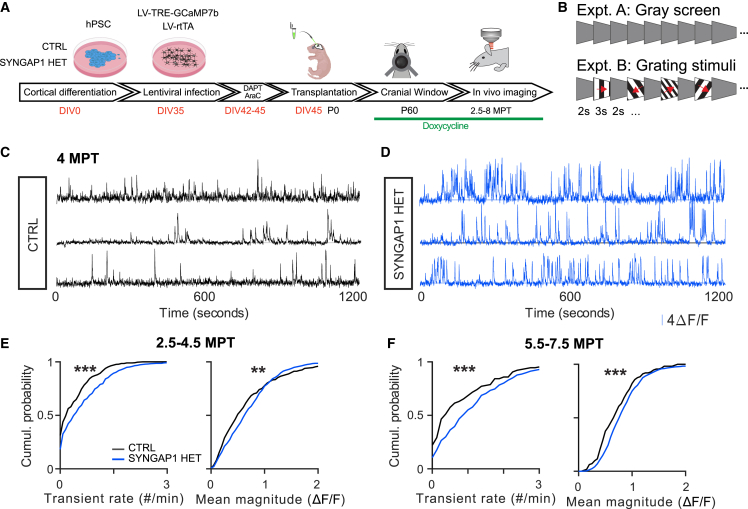
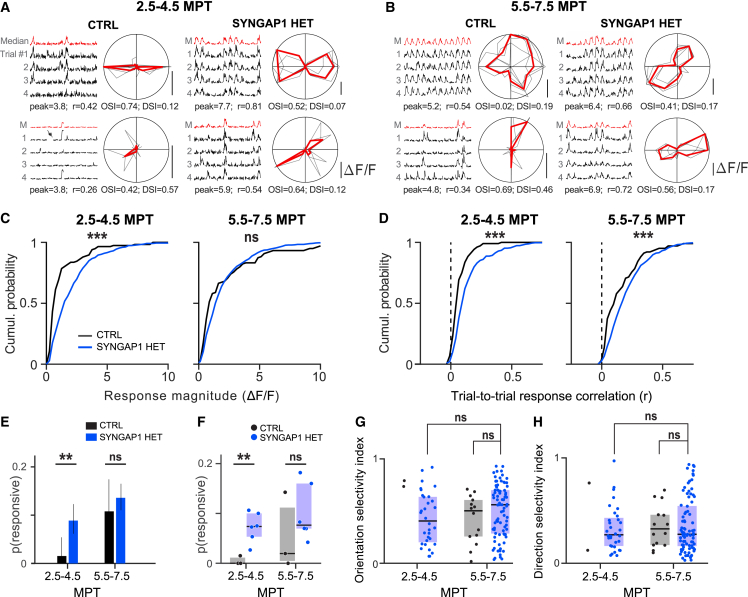
Human brain ontogeny is characterized by a considerably prolonged neotenic development of cortical neurons and circuits. Neoteny is thought to be essential for the acquisition of advanced cognitive functions, which are typically altered in intellectual disability (ID) and autism spectrum disorders (ASDs). Human neuronal neoteny could be disrupted in some forms of ID and/or ASDs, but this has never been tested. Here, we use xenotransplantation of human cortical neurons into the mouse brain to model SYNGAP1 haploinsufficiency, one of the most prevalent genetic causes of ID/ASDs. We find that SYNGAP1-deficient human neurons display strong acceleration of morphological and functional synaptic formation and maturation alongside disrupted synaptic plasticity. At the circuit level, SYNGAP1-haploinsufficient neurons display precocious acquisition of responsiveness to visual stimulation months ahead of time. Our findings indicate that SYNGAP1 is required cell autonomously for human neuronal neoteny, providing novel links between human-specific developmental mechanisms and ID/ASDs.

Keywords: SYNGAP1; autism spectrum disorder; cerebral cortex; evolution; human brain development; neoteny; neurodevelopmental disease.


Conflict of interest statement

Declaration of interests The authors declare no conflicts of interest.

Figures

None
Graphical abstract
Figure 1
Figure 1
Characterization of dendritic spine development and dynamics of SYNGAP1-deficient neurons (A) Experimental timeline: differentiated mutant or control cortical neurons are infected with lentivirus (LV)-EmGFP and transplanted into neonatal mouse pups. A cranial window is implanted in adult mice to allow longitudinal imaging of dendritic branches of transplanted cells. Red numbers mark days in vitro preceding transplantation. Postnatal day (P), months post-transplantation (MPT). (B) Example cell per genotype shown as top and side projection (rows). Red dashed circles mark the soma of each cell in both views. Total volume size shown is 360 × 340 × 400 μm. Data in (B), (C), and (F) show the signal of the green channel (EmGFP) after removing the scaled signal of the red channel. (C) Representative dendritic branches per genotype at 4 and 7 MPT. SYNGAP1 KO and HET neurons exhibit higher spine density across both time points. (D) Quantification of spine density for SYNGAP1 CTRL, HET, and KO; both mutants differ from controls at early (4 and 5 MPT) and late (7 MPT) time points. Data from 4 to 5 and 6–7 MPT are taken from the same longitudinally sampled branches; partial overlap exists between branches of both datasets. Medians per genotype/time point (4 MPT: 0.25, 0.31, 0.42; 5 MPT: 0.33, 0.40, 0.59; 6 MPT: 0.45; 0.48, 0.55; 7 MPT: 0.48, 0.57, 0.57). Data collected at 4–5 MPT from CTRL: 16 cells (4 mice); HET: 14 (3); KO: 11 (2). Data collected at 6–7 MPT from CTRL: 17 cells (3 mice); HET: 21 (5); KO: 17 (6). Boxes indicate median and interquartile range (IQR). Statistical comparison was done using rank-sum tests. (E) Temporal evolution of dendritic spine density for all genotypes. The markers and error bars indicate ± SEMs for each group. The continuous lines are power-law fits. Note the upward shift of the SYNGAP1 KO and HET mutants compared to CTRL. (F) Example of dendritic spine dynamics at 5 MPT for the 3 genotypes. Branches shown were recorded 2 weeks apart. Red arrow heads indicate spines that were not found at the next time point. Yellow arrows indicated spines that are newly formed relative to the previous time point. (G) Quantification of spine turnover rate (see STAR Methods). Both mutants differ from controls at 5 MPT; a similar trend is observed at 7 MPT. Medians per genotype/time point (5 MPT: 0.37, 0.32, 0.30; 7 MPT: 0.30, 0.27, 0.24). Data collected at 5 MPT from CTRL: 23 cells (5 mice); HET: 23 (5); KO: 17 (5). Data collected at 7 MPT from CTRL: 4 cells (1 mouse); HET: 14 (3); KO: 14 (4). (H) Summary of turnover data for all 3 genotypes. Note the downward shift of spine turnover values in SYNGAP1 KO and HET neurons compared to controls. See also Figures S1 and S2.
Figure 2
Figure 2
Electrophysiological characterization of SYNGAP1-deficient cortical neurons (A) Experimental timeline: differentiated mutant or control cells are infected with LV-EmGFP and transplanted. Coronal slices are prepared and EmGFP-labeled cells are targeted for patch-clamp experiments. (B) Recording traces of SYNGAP1 CTRL and HET neurons showing example sEPSCs. Note more and larger inflections in the blue (HET) trace. (C and D) Quantification of synaptic properties across time: (C) sEPSC frequency at 4.5 and 6.5 MPT. Medians per genotype/time point (4.5 MPT: 0.23, 1.02; 6.5 MPT: 1.10, 1.63). Data collected at 4.5 MPT from CTRL: 13 cells (4 mice); HET: 25 (4). Data collected at 6.5 MPT from CTRL: 13 cells (2 mice); HET: 16 (3). (D) sEPSC amplitude at 4.5 and 6.5 MPT. Medians per genotype/time point (4.5 MPT: 10.8, 15.00; 6.5 MPT: 14.0, 13.5). Data collected from same cells as in (D). (E) Example AMPA (top) and NMDA (bottom) traces for both CTRL (black) and HET (blue) genotypes. AMPA currents are increased in HET (blue) neurons. (F) AMPA/NMDA ratio at 4.5 and 6.5 MPT. Medians per genotype (4.5 MPT: 0.52, 0.72; 6.5 MPT: 1.15, 0.76). Data collected at 4.5 MPT from CTRL: 24 cells (4 mice); HET: 26 (5). Data collected at 6.5 MPT from CTRL: 13 cells (2 mice); HET: 8 (1). Boxes indicate median and IQR. Statistical comparison was done using rank-sum tests. (G–I) Quantification of mEPSC recordings at 2.5 and 4.5 MPT. (G) Example mEPSC traces for both genotypes; TTX is applied to isolate spontaneous synaptic events. (H) mEPSC frequency at 2.5 and 4.5 MPT. Medians per genotype/time point (2.5 MPT 0.23, 0.89; 4.5 MPT: 0.95, 1.92). Data collected at 2.5 MPT from CTRL: 16 cells (2 mice); HET: 16 (3). Data collected at 4.5 MPT from CTRL: 23 cells (3 mice); HET: 16 (3). (I) mEPSC amplitude at 2.5 and 4.5 MPT. Medians per genotype/time point (2.5 MPT: 14.8, 14.00; 4.5 MPT: 12.1, 11.8). (J–L) Quantification of miniature inhibitory post-synaptic currents (mIPSC) recordings at 2.5 and 4.5 MPT. (J) Example mIPSC traces for both genotypes, as in (G). (K) mIPSC frequency at 2.5 and 4.5 MPT. Medians per genotype/time point (2.5 MPT: 0.45, 0.99; 4.5 MPT: 3.24, 3.76). Data collected from same cells as (H). (L) mIPSC amplitude at 2.5 and 4.5 MPT. Medians per genotype/time point (2.5 MPT: 13.6, 16.00; 4.5 MPT: 20.8, 21.4). Data collected from same cells as (H). (M and N) E/I frequency at 2.5 and 4.5 MPT. (M) Scatterplot showing miniature excitatory post-synaptic currents (mEPSC) and mIPSC frequency per cell at 2.5 MPT and (N) at 4.5 MPT. In both cases, HET (blue) neurons tend toward higher E/I ratios. (O–Q) LTP experiments performed at 7–8 MPT. (O) Example traces during baseline (left) and after potentiation (right). (P) Average excitatory post-synaptic potential (EPSP) per genotype showing deviation from baseline after 10′ pairing protocol (see STAR Methods). CTRL neurons (black) show potentiation, whereas HET neurons (blue) show lack of potentiation. (Q) Quantification of average EPSP levels 20 min after the end of the potentiation protocol. Data collected between 7.5 and 8.5 MPT from CTRL: 5 cells (3 mice); HET: 6 (3). See also Figures S3 and S4.
Figure 3
Figure 3
Spontaneous circuit function in vivo (A) Experimental timeline: differentiated mutant or control cells are infected with LV-TRE-GCaMP/LV-rtTA and transplanted. A cranial window is implanted to allow longitudinal imaging of cellular calcium responses. (B) Neurons were stimulated with static gray screen (expt. A) or square-wave drifting gratings of different temporal frequencies, spatial frequencies, spatial orientations, and directions of motion (expt. B). (C and D) Example calcium traces for 3 SYNGAP1 (C) CTRL and (D) HET neurons recorded at 4 MPT. Note the increased activity and transient magnitude in the HET mutants. (E) Quantification of calcium transient rates (left) and average transient magnitude (right) for SYNGAP1 CTRL and HET neurons recorded between 2.5 and 4.5 MPT. Medians per genotype (rate: 0.38, 0.45; magnitude: 50.3, 64.6). Data collected between 2.5 and 4.5 MPT from CTRL: 591 cells (10 mice); HET: 701 (12). (F) Transient rate (left) and transient magnitude (right) for CTRL and mutant neurons recorded between 5.5 and 7.5 MPT. Medians per genotype (rate: 0.40, 0.90; magnitude: 68.7, 78.0). Data collected between 5.5 and 7.5 MPT from CTRL: 127 cells (3 mice); HET: 619 (6). Note the rightward shifted curves consistent with increased values for HET neurons. See also Figures S5 and S6 and Table S1.
Figure 4
Figure 4
Evoked circuit function in vivo (A) Example responses for 2 neurons per genotype recorded at the early time point (2.5–4.5 MPT). (Left) Single trial responses (black, in rows) for 12 directions (in columns) for the best combination of spatial frequency-temporal frequency (SF-TF) for each neuron. The median trace is shown in red in the top row. Values for response magnitude (peak, in change in fluorescence divided by basal fluorescence [df/f]) and trial-to-trial response correlation (r) are shown below the panel. (Right) Same data represented as polar plots, single trials shown in gray and the median across trial in red. The values for orientation selectivity index (OSI) and direction selectivity index (DSI) per neuron are reported below each panel. (B) Same conventions as in (A), for neurons recorded at the later time point (5.5–7.5 MPT). (C) Quantification of response magnitude to the preferred stimulus for SYNGAP1 CTRL (black) and HET (blue) neurons at both time epochs. Note the large difference in response magnitude at the early time point (left). Medians per genotype/time point (2.5–4.5: 0.76, 1.62; 5.5–7.5: 1.22, 1.62). Data collected between 2.5 and 4.5 MPT from CTRL: 104 cells (3 mice); HET: 337 (6). Statistical comparison was done using rank-sum tests. (D) Quantification of trial-to-trial correlation for SYNGAP1 CTRL (black) and HET (blue) neurons at both time epochs. SYNGAP1 mutants show increased values at both time points. Medians per genotype/time point (2.5–4.5: 0.01, 0.05; 5.5–7.5: 0.11, 0.18). Data collected between 5.5 and 7.5 MPT from CTRL: 104 cells (3 mice); HET: 337 (6). (E) Proportion of visually responsive neurons for SYNGAP1 CTRL and HET at both time points. Proportions per genotype/time point (2.5–4.5: 0.02, 0.09; 5.5–7.5: 0.11, 0.14). Statistical comparison was done using a two-proportion chi-square test. Error bars indicate 95% confidence interval (CI) obtained from the binomial fit. (F) Proportion of responsive neurons per animal for CTRL (gray, n = 3) and HET (blue, n = 6). (G) Overview of OSI across genotype/time point. We find no difference between HET neurons across time nor between genotypes at the later time point. (H) Results for DSI values are similar to what is reported in (G). See also Figure S7 and Table S1.

References

    1. Zoghbi H.Y., Bear M.F. Synaptic dysfunction in neurodevelopmental disorders associated with autism and intellectual disabilities. Cold Spring Harb. Perspect. Biol. 2012;4 doi: 10.1101/cshperspect.a009886. - DOI - PMC - PubMed
    1. Ebert D.H., Greenberg M.E. Activity-dependent neuronal signalling and autism spectrum disorder. Nature. 2013;493:327–337. doi: 10.1038/nature11860. - DOI - PMC - PubMed
    1. Courchesne E., Gazestani V.H., Lewis N.E. Prenatal Origins of ASD: The When, What, and How of ASD Development. Trends Neurosci. 2020;43:326–342. doi: 10.1016/j.tins.2020.03.005. - DOI - PMC - PubMed
    1. Klingler E., Francis F., Jabaudon D., Cappello S. Mapping the molecular and cellular complexity of cortical malformations. Science. 2021;371 doi: 10.1126/science.aba4517. - DOI - PubMed
    1. Vanderhaeghen P., Polleux F. Developmental mechanisms underlying the evolution of human cortical circuits. Nat. Rev. Neurosci. 2023;24:213–232. doi: 10.1038/s41583-023-00675-z. - DOI - PMC - PubMed

Substances

LinkOut - more resources