. 2024 Oct 1:200:106628.
doi: 10.1016/j.nbd.2024.106628. Epub 2024 Aug 5.

Developmental trajectory and sex differences in auditory processing in a PTEN-deletion model of autism spectrum disorders

Affiliations

Developmental trajectory and sex differences in auditory processing in a PTEN-deletion model of autism spectrum disorders

Katilynne Croom et al. Neurobiol Dis. .

Abstract

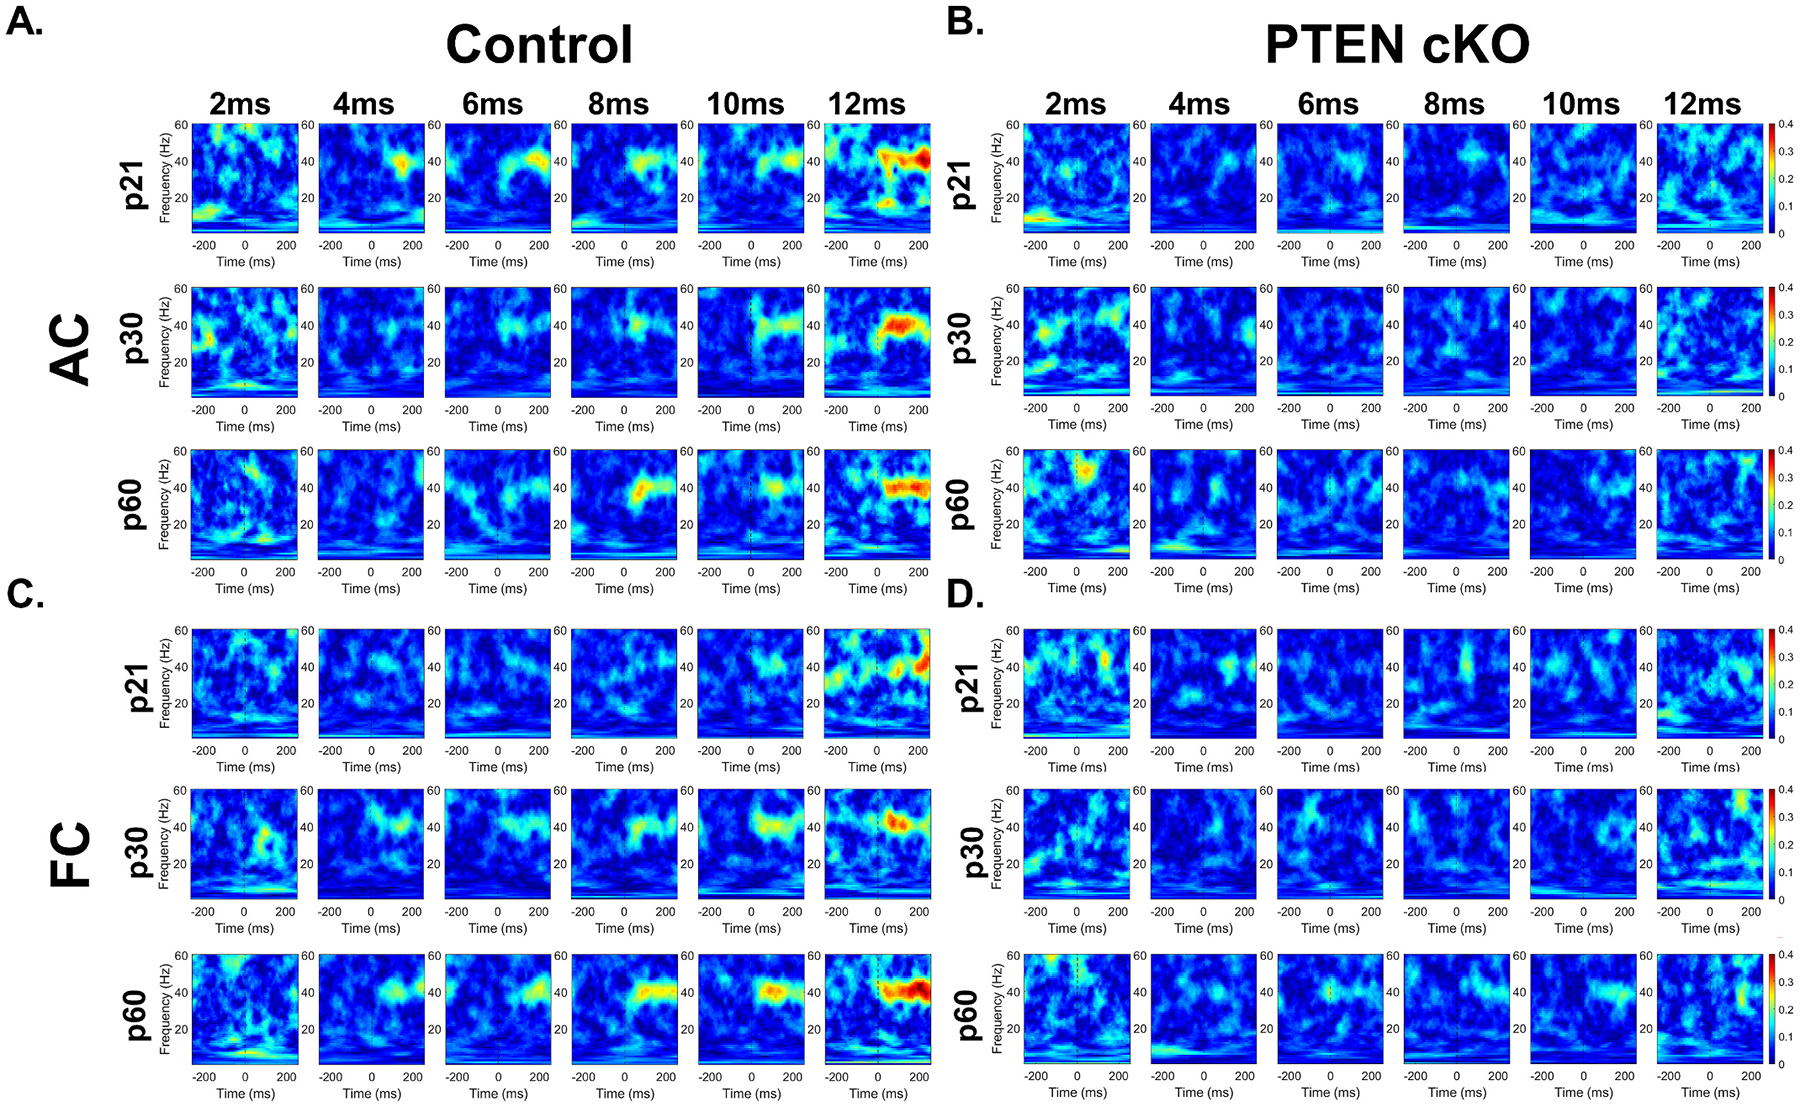
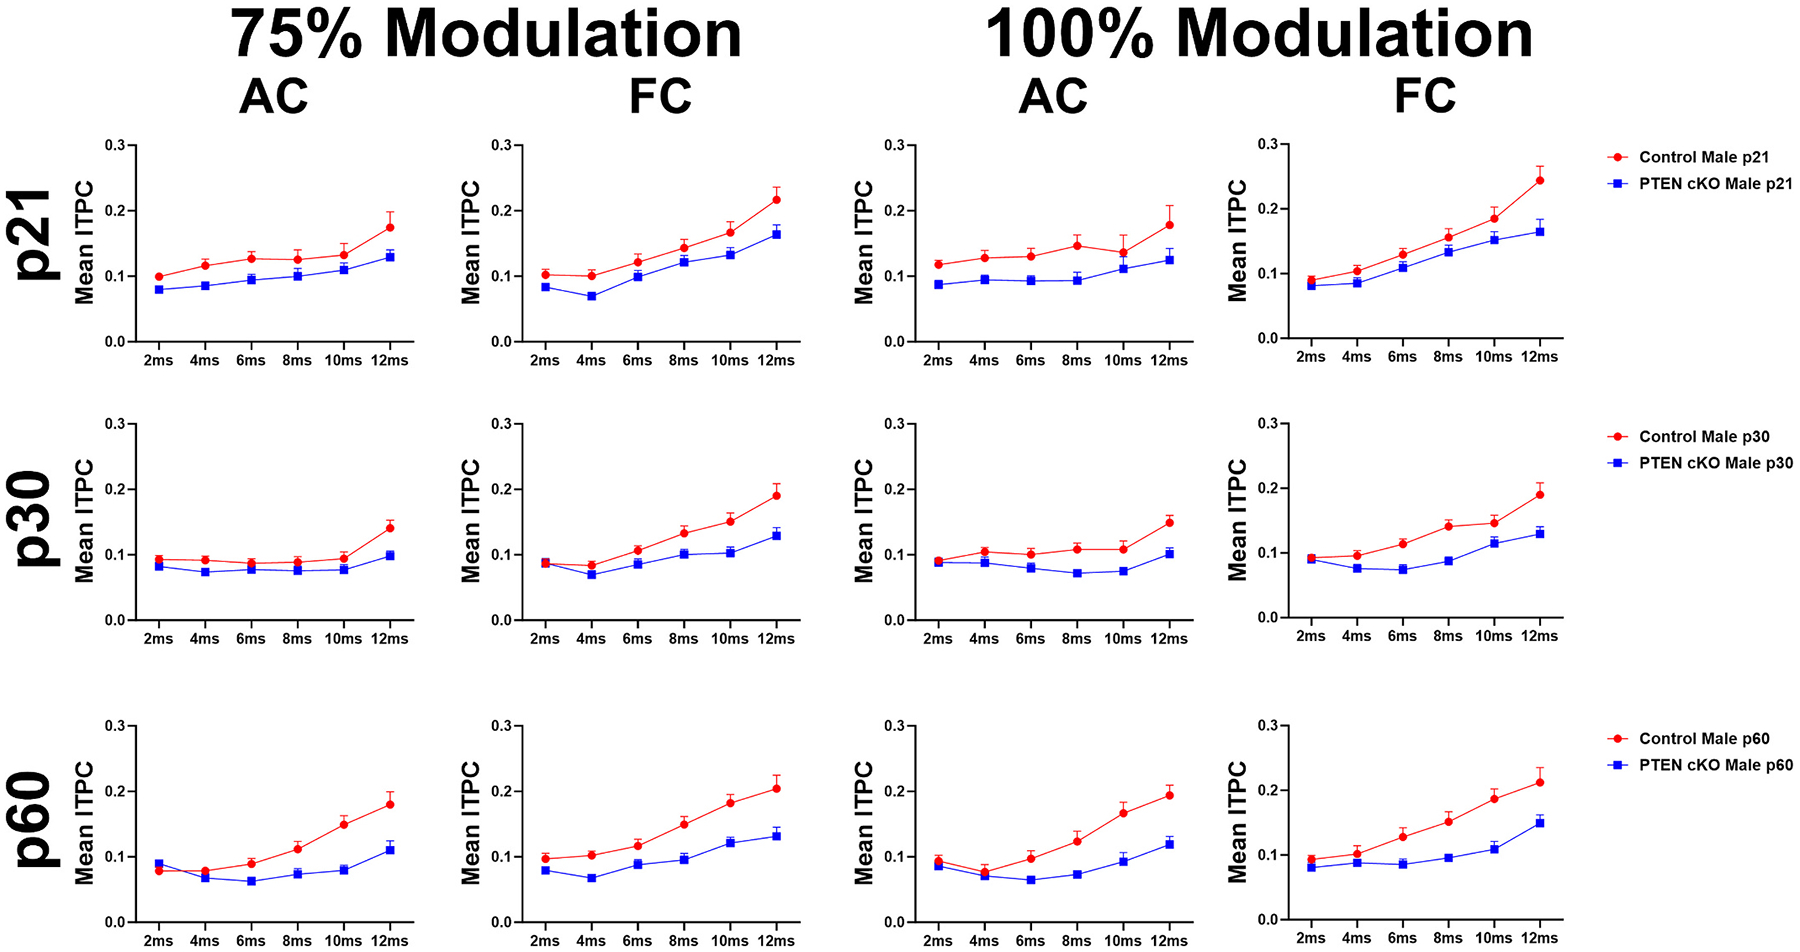
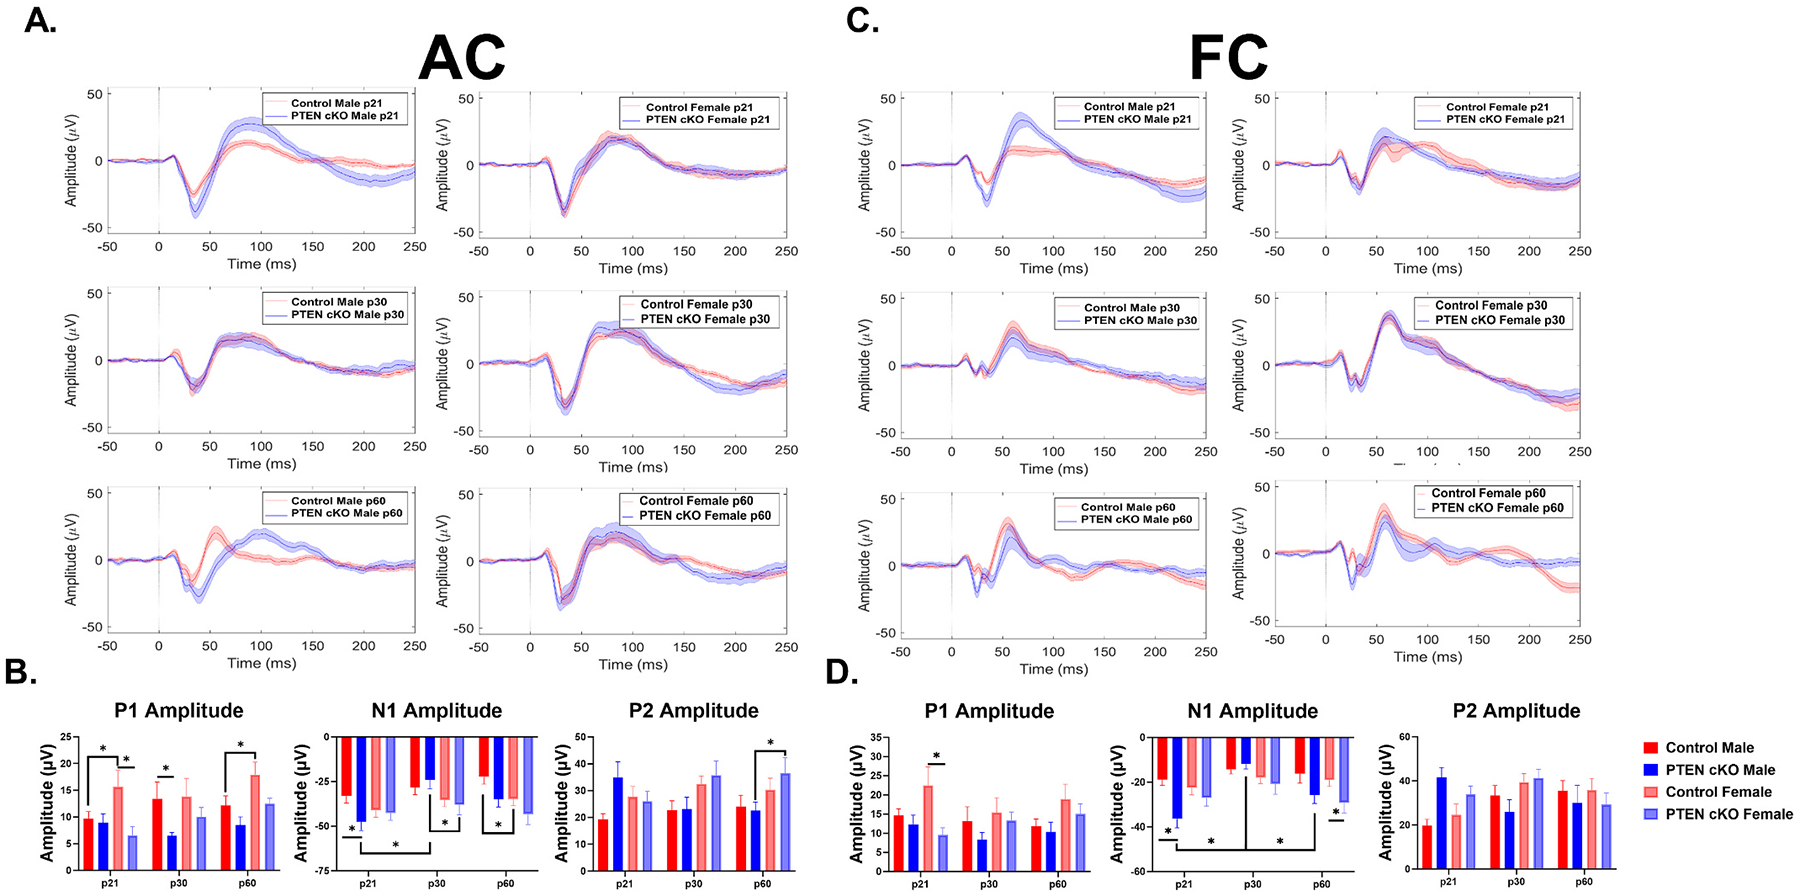
Autism Spectrum Disorders (ASD) encompass a wide array of debilitating symptoms, including severe sensory deficits and abnormal language development. Sensory deficits early in development may lead to broader symptomatology in adolescents and adults. The mechanistic links between ASD risk genes, sensory processing and language impairment are unclear. There is also a sex bias in ASD diagnosis and symptomatology. The current study aims to identify the developmental trajectory and genotype- and sex-dependent differences in auditory sensitivity and temporal processing in a Pten-deletion (phosphatase and tensin homolog missing on chromosome 10) mouse model of ASD. Auditory temporal processing is crucial for speech recognition and language development and deficits will cause language impairments. However, very little is known about the development of temporal processing in ASD animal models, and if there are sex differences. To address this major gap, we recorded epidural electroencephalography (EEG) signals from the frontal (FC) and auditory (AC) cortex in developing and adult Nse-cre PTEN mice, in which Pten is deleted in specific cortical layers (layers III-V) (PTEN conditional knock-out (cKO). We quantified resting EEG spectral power distribution, auditory event related potentials (ERP) and temporal processing from awake and freely moving male and female mice. Temporal processing is measured using a gap-in-noise-ASSR (auditory steady state response) stimulus paradigm. The experimental manipulation of gap duration and modulation depth allows us to measure cortical entrainment to rapid gaps in sounds. Temporal processing was quantified using inter-trial phase clustering (ITPC) values that account for phase consistency across trials. The results show genotype differences in resting power distribution in PTEN cKO mice throughout development. Male and female cKO mice have significantly increased beta power but decreased high frequency oscillations in the AC and FC. Both male and female PTEN cKO mice show diminished ITPC in their gap-ASSR responses in the AC and FC compared to control mice. Overall, deficits become more prominent in adult (p60) mice, with cKO mice having significantly increased sound evoked power and decreased ITPC compared to controls. While both male and female cKO mice demonstrated severe temporal processing deficits across development, female cKO mice showed increased hypersensitivity compared to males, reflected as increased N1 and P2 amplitudes. These data identify a number of novel sensory processing deficits in a PTEN-ASD mouse model that are present from an early age. Abnormal temporal processing and hypersensitive responses may contribute to abnormal development of language function in ASD.

Keywords: Autism Spectrum disorders; Cerebral cortex; Neurodevelopment; Sensory processing disorder; Sex differences; Temporal processing.


Conflict of interest statement

Declaration of competing interest The authors declare the following financial interests/personal relationships which may be considered as potential competing interests. Razak KA reports financial support was provided by National Institutes of Health. Huber KM reports financial support was provided by National Institutes of Health. Binder DK reports financial support was provided by National Institutes of Health. If there are other authors, they declare that they have no known competing financial interests or personal relationships that could have appeared to influence the work reported in this paper.

Figures

Fig. 1.
Fig. 1.. Abnormal resting spectral power distributions in the auditory and frontal cortices in Male and female PTEN cKO mice.
Relative resting spectral power distribution in male and female control and PTEN cKO mice in the AC (A-F) and FC (G-L) across development. Panels indicate main and interaction effects. Male and female PTEN cKO mice have increased beta power (AC: C, FC: I) and decreased high gamma power (AC: E, FC: K) and high frequency oscillations (AC: E, FC: L) compared to control mice. Error bars show SEM. Full ANOVA analysis can be found in Table 1. Post hoc comparisons can be found in Supplementary Tables 1–22.
Fig. 2.
Fig. 2.. Impaired temporal processing in PTEN cKO mice.
Individual example heatmaps of ITPC generated at 40 Hz for different gap durations in p21, p30, and p60 control (A: AC, C: FC) and PTEN cKO (B: AC, D: FC) female mice. The same example mouse is used for the AC and FC. Each panel shows the ITPC (scale is seen at the right edge of the figure, warmer colors mean greater ITPC) obtained at a specific gap width. Sound onset in each panel is at 0 msec. Each column shows ITPC for the same gap width, with the gap width increasing from left to right. As expected, ITPC increases with increasing gap width. The y-axis of each panel is the range of frequencies analyzed for ITPC. ITPC is maximum around 40 Hz, which was the repetition rate of ASSR stimulus train. Qualitative observations of these examples show clear deficits in cortical temporal processing across development in both cortical regions. All panels show 100% modulation depth. The onset of the gap-ASSR stimulus is at 0 msec in each panel.
Fig. 3.
Fig. 3.. Population analysis shows temporal processing deficits in the AC and FC during development in PTEN cKO male mice.
Each plot represents the group average ITPC values. Each row represents a different age group: p21 (top), p30 (middle), and p60 (bottom). The left columns represent AC and FC data at 75% modulation depth, and the right columns represent AC and FC data at 100% modulation depth. PTEN cKO male mice show significant deficits in both cortical regions across development. Error bars show SEM. The complete four-way ANOVA analysis of this data is shown in Table 2. Post hoc comparisons are shown in Supplementary Table 23.
Fig. 4.
Fig. 4.. Population analysis shows temporal processing deficits in the AC and FC during development in PTEN cKO female mice.
Each plot represents the group average ITPC values. Each row represents a different age group: p21 (top), p30 (middle), and p60 (bottom). The left columns represent AC and FC data at 75% modulation depth, and the right columns represent AC and FC data at 100% modulation depth. PTEN cKO female mice show significant deficits in both cortical regions across development. No significant difference between PTEN cKO and control females were seen in the AC at p30. Error bars show SEM. The complete four-way ANOVA analysis of this data is shown in Table 2. Post hoc comparisons are shown in Supplementary Table 23.
Fig. 5.
Fig. 5.. Impaired auditory temporal processing in the AC and FC of male and female PTEN cKO mice.
(A-B) Each plot represents the group average ITPC values from the AC (A) and FC (B)collapsed across all the gap widths. Columns represent different modulation depths, and rows represent the different sexes (Columns – left = 75% modulation, right = 100% modulation; Rows – top = males, bottom = females). cKO mice show a significant ITPC deficit across development in the AC and FC. Significance was not reached in females in the AC at p30. Error bars show SEM. (C–D) Each plot represents the group average (A: control, B: PTEN cKO) ITPC values collapsed across all the gap widths. Columns represent different modulation depths, and rows represent different cortical regions (Columns – left = 75% modulation, right = 100% modulation; Rows – top = AC, bottom = FC). No significant sex difference in either genotype in the AC or FC at any age. Error bars show SEM.
Fig. 6.
Fig. 6.. Age, genotype, and sex impact ERP amplitudes in the AC and FC.
(A) Average ERPs recorded in the AC for control and cKO male (left) and female (right) mice at p21 (top), p30 (middle), and p60 (bottom). (B) Population averages of AC ERP wave amplitudes. Female and male PTEN cKO mice have decreased P1 amplitudes at p21 and p30, respectively, compared to their controls. Control females have increased P1 amplitudes at p21 and p60 compared to control males. N1 amplitudes are increased in young male cKO mice but decrease with age. Control females have increased N1 amplitudes compared to control males at p60. cKO females show increased N1 and P2 amplitudes compared to cKO males at p30 and p60, respectively. (C) Average ERPs recorded in the FC for control and cKO male (left) and female (right) mice at p21 (top), p30 (middle), and p60 (bottom). (D) Population averages of FC ERP wave amplitudes. P1 amplitude was significantly decreased in young female PTEN cKO mice. N1 amplitude was increased in cKO males at p21 and in cKO females at p60. cKO males show developmental fluctuations in N1 amplitude. An age × genotype interaction was identified for P2 amplitudes. Error bars show SEM. The complete ANOVA analysis can be found in Table 3. Post hoc comparisons for the AC and FC are shown in Supplementary Tables 24–29 and Supplementary Tables 30–33, respectively.
Fig. 7.
Fig. 7.. Elevated background noise power in PTEN cKO mice.
Non-baseline normalized STP during ERP stimulation is altered in PTEN cKO males (A,B) and females (C,D) in the AC (A,C) and FC (B,D) during development. The heatmaps show non-baseline corrected normalized power from the AC (A,C) and FC (B,D), where warm hues represent increased ongoing background activity, and cooler hues represent a decrease. The smaller panels show group average STP for control and PTEN cKO mice. The larger panels show the difference between cKO and control. Outlined regions indicate clusters which are significantly different between control and cKO. (A,C) STP was significantly increased in PTEN cKO males and females p30 and p60 in the AC. (B,D) STP was significantly increased in PTEN cKO males and females at p30 and p60 in the FC.

References

    1. Balakrishnan S, Pearce RA, 2015. Spatiotemporal characteristics and pharmacological modulation of multiple gamma oscillations in the CA1 region of the hippocampus. Front. Neural Circuits 8, 150. 10.3389/fncir.2014.00150. - DOI - PMC - PubMed
    1. Bhatara A, Babikian T, Laugeson E, Tachdjian R, Sininger YS, 2013. Impaired timing and frequency discrimination in high-functioning autism spectrum disorders. J. Autism Dev. Disord 43 (10), 2312–2328. 10.1007/s10803-013-1778-y. - DOI - PubMed
    1. Busch RM, Srivastava S, Hogue O, Frazier TW, Klaas P, Hardan A, Martinez-Agosto JA, Sahin M, Eng C, Developmental Synaptopathies Consortium, 2019. Neurobehavioral phenotype of autism spectrum disorder associated with germline heterozygous mutations in PTEN. Transl. Psychiatry 9 (1), 253. 10.1038/s41398-019-0588-1. - DOI - PMC - PubMed
    1. Butler MG, Dasouki MJ, Zhou XP, Talebizadeh Z, Brown M, Takahashi TN, Miles JH, Wang CH, Stratton R, Pilarski R, Eng C, 2005. Subset of individuals with autism spectrum disorders and extreme macrocephaly associated with germline PTEN tumour suppressor gene mutations. J. Med. Genet 42 (4), 318–321. 10.1136/jmg.2004.024646. - DOI - PMC - PubMed
    1. Buxbaum JD, Cai G, Chaste P, Nygren G, Goldsmith J, Reichert J, Anckarsäter H, Rastam M, Smith CJ, Silverman JM, Hollander E, Leboyer M, Gillberg C, Verloes A, Betancur C, 2007. Mutation screening of the PTEN gene in patients with autism spectrum disorders and macrocephaly. American J. Med. Genet. Part B, Neuropsychiatr. Genet. :Off. Publicat. Int. Soc. Psychiatr. Genet 144B (4), 484–491. 10.1002/ajmg.b.30493. - DOI - PMC - PubMed

Publication types