

Intake of sugar sweetened beverages among children and adolescents in 185 countries between 1990 and 2018: population based study
- PMID: 39111807
- PMCID: PMC11305379
- DOI: 10.1136/bmj-2024-079234
Intake of sugar sweetened beverages among children and adolescents in 185 countries between 1990 and 2018: population based study
Abstract
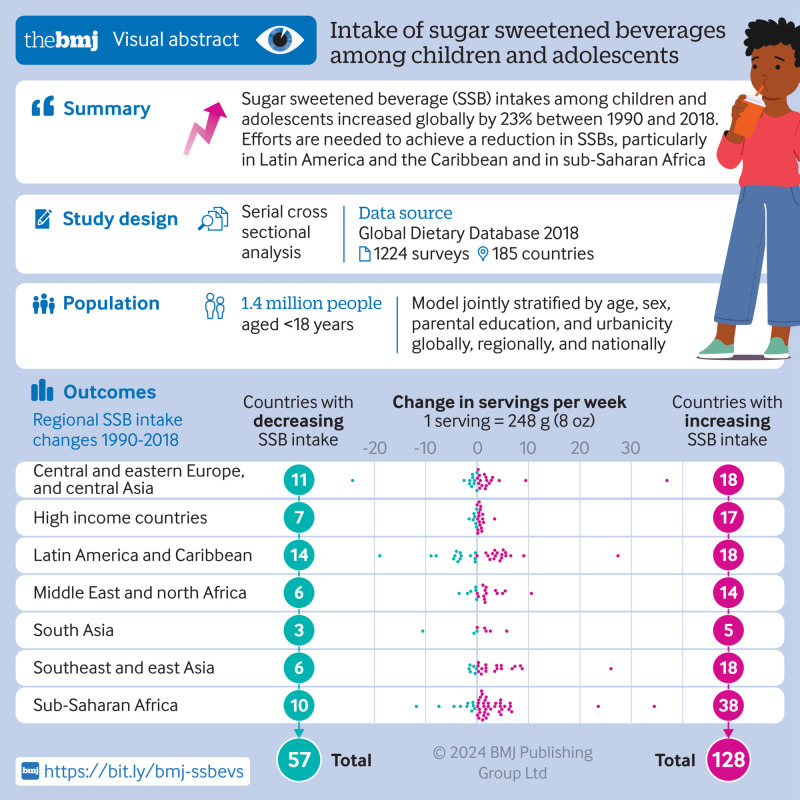
Objective: To quantify global intakes of sugar sweetened beverages (SSBs) and trends over time among children and adolescents.
Design: Population based study.
Setting: Global Dietary Database.
Population: Children and adolescents aged 3-19 years in 185 countries between 1990 and 2018, jointly stratified at subnational level by age, sex, parental education, and rural or urban residence.
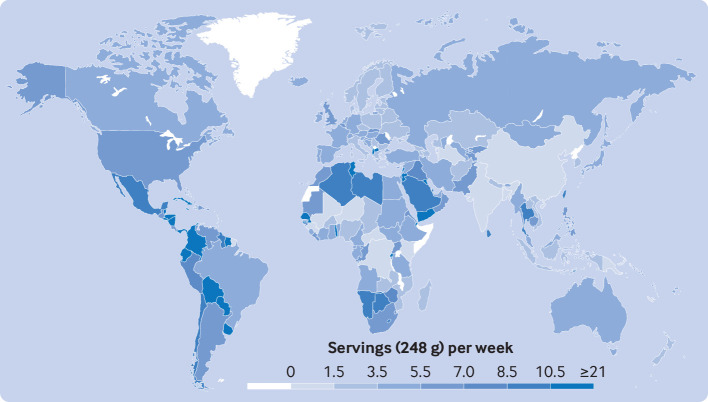
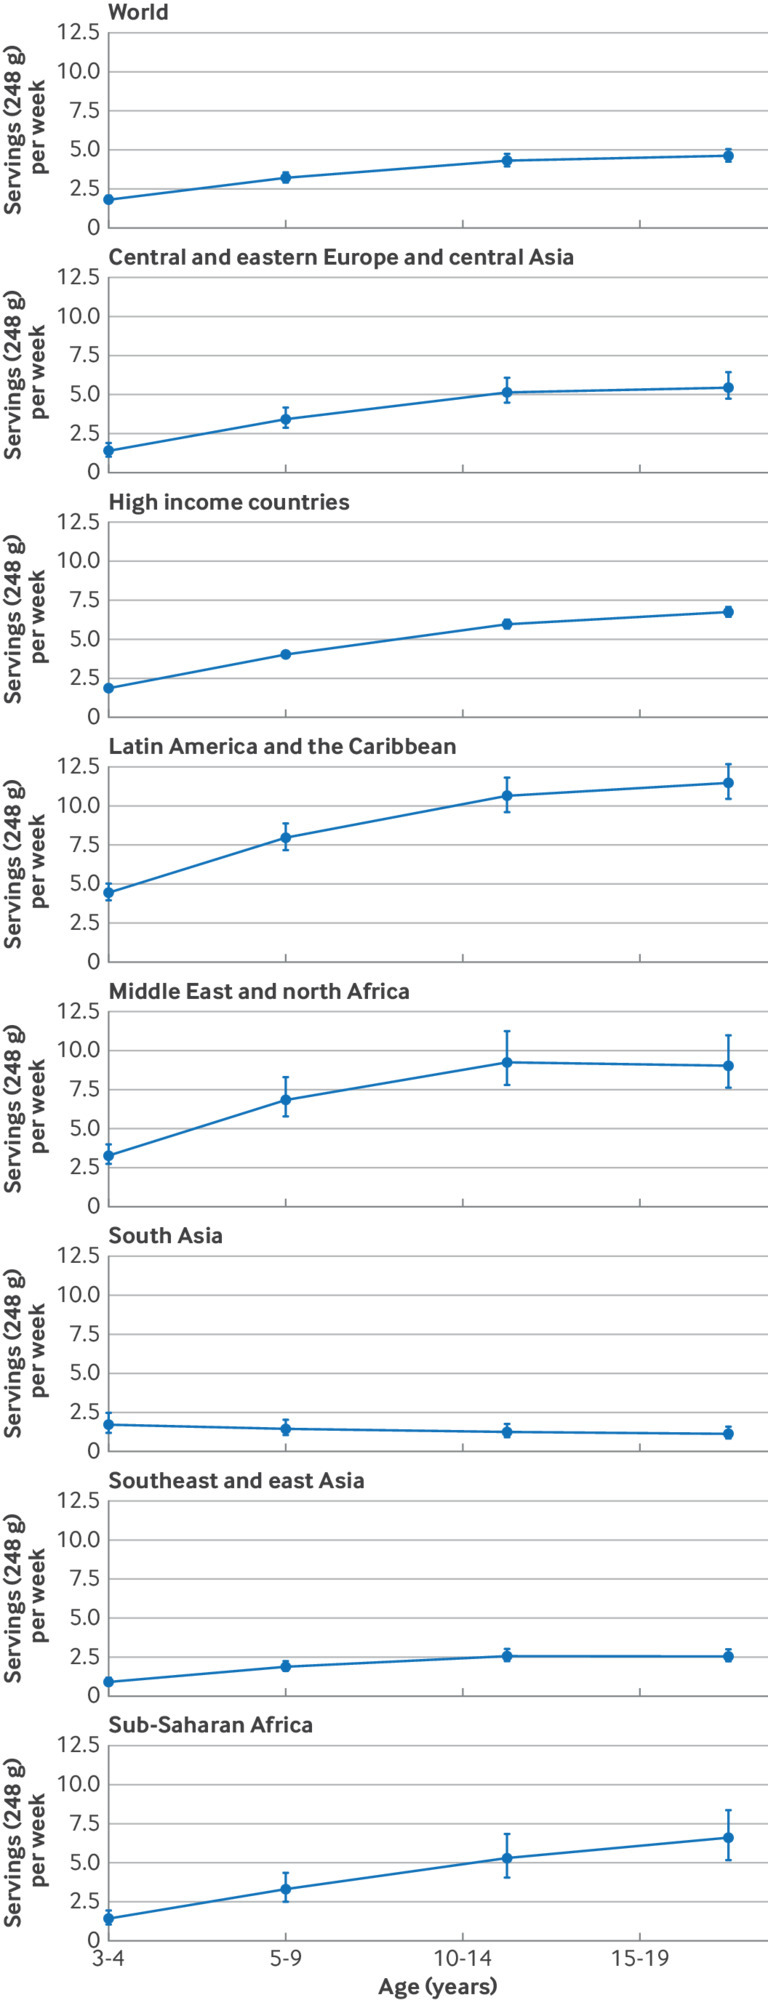
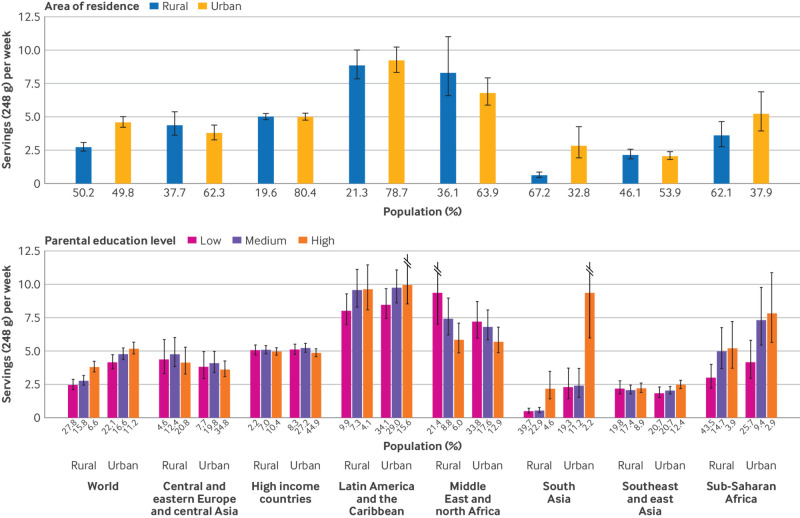
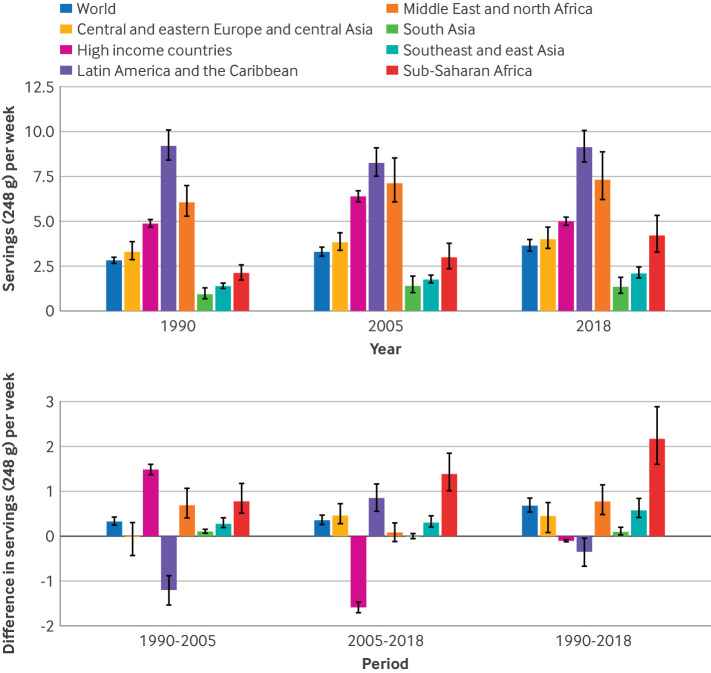
Results: In 2018, mean global SSB intake was 3.6 (standardized serving=248 g (8 oz)) servings/week (1.3 (95% uncertainly interval 1.0 to 1.9) in south Asia to 9.1 (8.3 to 10.1) in Latin America and the Caribbean). SSB intakes were higher in older versus younger children and adolescents, those resident in urban versus rural areas, and those of parents with higher versus lower education. Between 1990 and 2018, mean global SSB intakes increased by 0.68 servings/week (22.9%), with the largest increases in sub-Saharan Africa (2.17 servings/week; 106%). Of 185 countries included in the analysis, 56 (30.3%) had a mean SSB intake of ≥7 servings/week, representing 238 million children and adolescents, or 10.4% of the global population of young people.
Conclusion: This study found that intakes of SSBs among children and adolescents aged 3-19 years in 185 countries increased by 23% from 1990 to 2018, parallel to the rise in prevalence of obesity among this population globally. SSB intakes showed large heterogeneity among children and adolescents worldwide and by age, parental level of education, and urbanicity. This research should help to inform policies to reduce SSB intake among young people, particularly those with larger intakes across all education levels in urban and rural areas in Latin America and the Caribbean, and the growing problem of SSBs for public health in sub-Saharan Africa.
© Author(s) (or their employer(s)) 2019. Re-use permitted under CC BY. No commercial re-use. See rights and permissions. Published by BMJ.
Conflict of interest statement
Competing interests: All authors have completed the ICMJE uniform disclosure form at https://www.icmje.org/disclosure-of-interest/ and declare the following: support from the Bill & Melinda Gates Foundation, American Heart Association, and Consejo Nacional de Ciencia y Tecnología in Mexico. LLC reports research funding from the Bill & Melinda Gates Foundation, the American Heart Association, and Consejo Nacional de Ciencia y Tecnología in Mexico (CONACyT), outside of the submitted work. RM reports research funding from the Bill & Melinda Gates Foundation; and (ended) the US National Institutes of Health, Danone, and Nestle. She also reports consulting from Development Initiatives and as IEG chair for the Global Nutrition Report, outside of the submitted work. FC, JZ, and PS report research funding from the Bill & Melinda Gates Foundation, as well as the National Institutes of Health, outside of the submitted work. VM reports research funding the Canadian Institutes of Health Research and from the American Heart Association, outside the submitted work. JRS reports research funding from the Bill & Melinda Gates Foundation, as well as the National Institutes of Health, Nestlé, Rockefeller Foundation, and Kaiser Permanent Fund at East Bay Community Foundation, outside of the submitted work. SBC reports research funding from the US. National Institutes of Health, US. Department of Agriculture, the Rockefeller Foundation, US. Agency for International Development, and the Kaiser Permanente Fund at East Bay Community Foundation, outside the submitted work. SB reports funding from Bloomberg Philanthropies, CONACyT, United Nations International Children’s Emergency Fund (Unicef), and Fundación Rio Arronte, outside the submitted work. DM reports research funding from the US National Institutes of Health, the Bill & Melinda Gates Foundation, the Rockefeller Foundation, Vail Innovative Global Research, and the Kaiser Permanente Fund at East Bay Community Foundation; personal fees from Acasti Pharma, Barilla, Danone, and Motif FoodWorks; is on the scientific advisory board for Beren Therapeutics, Brightseed, Calibrate, Elysium Health, Filtricine, HumanCo, Instacart, January, Perfect Day, Tiny Organics, and (ended) Day Two, Discern Dx, and Season Health; has stock ownership in Calibrate and HumanCo; and receives chapter royalties from UpToDate, outside the submitted work. The investigators did not receive funding from a pharmaceutical company or other agency to write this report, and declare no other relationships or activities that could appear to have influenced the submitted work.
Figures
References
-
- Mahumud RA, Sahle BW, Owusu-Addo E, Chen W, Morton RL, Renzaho AMN. Association of dietary intake, physical activity, and sedentary behaviours with overweight and obesity among 282,213 adolescents in 89 low and middle income to high-income countries. Int J Obes (Lond) 2021;45:2404-18. 10.1038/s41366-021-00908-0 - DOI - PubMed
MeSH terms
LinkOut - more resources
Full Text Sources