Review
. 2024 Aug;17(8):937-988.
doi: 10.1016/j.jcmg.2024.04.010.

Pericardial Diseases: International Position Statement on New Concepts and Advances in Multimodality Cardiac Imaging

Affiliations
Review

Pericardial Diseases: International Position Statement on New Concepts and Advances in Multimodality Cardiac Imaging

Allan L Klein et al. JACC Cardiovasc Imaging. 2024 Aug.

Abstract

Pericardial diseases have gained renewed clinical interest, leading to a renaissance in the field. There have been many recent advances in pericardial diseases in both multimodality cardiac imaging of diagnoses, such as recurrent, transient constrictive and effusive-constrictive pericarditis, and targeted therapeutics, especially anti-interleukin (IL)-1 agents that affect the inflammasome as part of autoinflammatory pathophysiology. There remains a large educational gap for clinicians, leading to variability in evaluation and management of these patients. The latest pericardial imaging (American Society of Echocardiography, European Association of Cardiovascular Imaging) and clinical guidelines (European Society of Cardiology) are >8-10 years of age and may not reflect current practice. Recent clinical trials involving anti-IL-1 agents in recurrent pericarditis, including anakinra (AIRTRIP), rilonacept (RHAPSODY), and goflikicept have demonstrated their efficacy. The present document represents an international position statement from world leaders in the pericardial field, focusing on novel concepts and emphasizing the role of multimodality cardiac imaging as well as new therapeutics in pericardial diseases.

Keywords: cardiac magnetic resonance; constrictive pericarditis; echocardiography; pericardial effusion; pericarditis; pericardium.


Conflict of interest statement

Funding Support and Author Disclosures Dr Klein has received research grants from Kiniksa Pharmaceuticals and Cardiol Therapeutics, and is on advisory boards for Kiniksa Pharmaceuticals, Cardiol Therapeutics, and Pfizer. Dr Cremer has received research grants from Kiniksa Pharmaceutics and Novartis, and is on advisory boards for Kiniksa Pharmaceutics and Swedish Orphan Biovitrum. Antonio Abbate has received consulting fees from Cardiol Therapeutics, Kiniksa Pharmaceuticals, Implicit Biosciences, Novo Nordisk, Olatec, R-Pharm, Serpin Pharma, and Swedish Orphan Biovitrum. Dr Asher has received royalties from Wolters-Kluwer Publishing Company. Dr Brucato’s institution has received funding from Kiniksa Pharmaceuticals as an investigative site, unrestricted research grants from Swedish Orphan Biovitrum and ACARPIA, and travel and accommodation for advisory committee from Swedish Orphan Biovitrum and Kiniksa. Dr Hoit is speaker for Philips Medical. Dr Kwon has received a research grant from the National Heart, Lung, and Blood Institute of the National Institutes of Health (1R01HL170090-01) and has research agreements with Circle cvi42 and Myocardial Solutions. Dr LeWinter has received a research grant from and is on an advisory board for Kiniksa Pharmaceuticals. Dr Lin is on an advisory board for Kiniksa Pharmaceuticals. Dr Luis is a consultant for Medtronic, Kiniksa Pharmaceuticals, Cardiol Therapeutic, and Swedish Orphan Biovitrum Pharmaceuticals; Dr Ordovas has received a research grant from the American College of Radiology; Dr Schenone is on the speaking bureau for Bristol Myers Squibb; Dr Weber is on advisory boards for Kiniksa Pharmaceuticals, Novo Nordisk, and Horizon Therapeutics; Dr Imazio is on advisory boards for Kiniksa Pharmaceuticals and Cardiol Therapeutics. The other authors have reported that they have no relationships relevant to the contents of this paper to disclose.

Figures
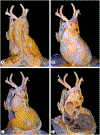
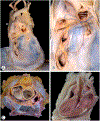
FIGURE 1
FIGURE 1. Pericardial Anatomy
(A) Pericardium with mediastinal pleura and epipericardial adipose tissue. Arrowheads indicate the sternopericardial ligaments. (B) Fibrous pericardium after removal of adipose tissue. (C) The fibrous pericardium is continuous with the adventitia of the aorta (Ao) and pulmonary artery (PA) superiorly (red arrowheads) and is anchored to the central tendon of the diaphragm inferiorly (white arrowheads). (D) Anterior (1), superior (2), and inferior (3) aortic recesses of the transverse sinus. IV = innominate vein; SVC = superior vena cava.
FIGURE 2
FIGURE 2. Pericardial Sinuses Anatomy
(A) Dorsal portion of the fibrous pericardium after removal of the heart. The phrenic nerves are indicated by arrowheads. (B) The transverse sinus (TS) is the space between the anterior great arteries and posterior veins (PVs) (blue dots). The oblique sinus (OS) is delineated by the pulmonary veins and inferior vena cava (IVC) (red dots). (C) Axial view of TSs and OSs. (D) Sagittal image of TS and OS, which do not communicate with each other. Abbreviation as in Figure 1.
FIGURE 3
FIGURE 3. Histopathologic Correlations With CMR of Inflammatory and CP
(A) Fibrinous inflammatory pericarditis involving the serosa of both parietal and visceral pericardium: (left) histology, (middle) T2-STIR imaging indicating pericardial edema (arrow), and (right) late gadolinium enhancement (LGE) imaging indicating pericardial inflammation (arrow). (B) CP with obliteration of the pericardial cavity and fibrous thickening of both pericardial layers: (left) histology, (middle) black-blood spin-echo imaging indicating pericardial thickening (arrow), and (right) LGE imaging indicating pericardial calcific thickening (arrow) without LGE. CMR = cardiac magnetic resonance; CP = constrictive pericarditis; STIR = short-tau inversion recovery.
FIGURE 4
FIGURE 4. Pericardial Pressure-Volume Relationship Determined Postmortem in a Normal Canine Heart and During Chronic Volume Overload Due to an Experimental Systemic Arteriovenous Fistula
The smallest volume is that of the empty heart with no fluid in the pericardial sac. Fluid was added to the pericardial sac to determine the pressure-volume relationship. Note the abrupt transition to a very steep pressure-volume relationship in the normal heart. Above the transition point, small increases in volume result in large increases in pressure. In the chronically dilated heart or with chronic pericardial effusions (PEffs), the pressure-volume relationship shifts to the right and flattens. This change reduces pericardial restraint to filling during chronic cardiac dilation, allowing accommodation for the markedly enlarged heart, and accounts for the observation that large chronic PEffs are better tolerated than smaller, rapidly developing PEffs. Adapted with permission from Freeman and LeWinter.
FIGURE 5
FIGURE 5. Pathophysiology of Pericardial Inflammation
Injury to the pericardium leads to the release of DAMPs and PAMPs and induces NF-κB synthesis, which increases the transcription of precursors of inflammatory molecules and associated cytokines (NLRP3, ASC, pro–caspase-1) required for the polymerization of the NLRP3 inflammasome, ultimately releasing IL-1β and IL-18. NF-κB stimulates the synthesis of phospholipase-A2 required for promoting the arachidonic acid pathway and the subsequent synthesis of prostaglandins and thromboxanes. The IL-1 receptor (IL-1R) occupies a central role as IL-1α functions as an alarmin or DAMP being released during tissue injury, and IL-1β is processed and released by the inflammasome leading to amplification of the process. ASA = acetylsalicylic acid; ASC = apoptosis-associated Speck-like protein containing a carboxy-terminal caspase-recruiting domain; DAMP = damage-associated molecular pattern; IL = interleukin; NF-κB = nuclear factor kappa-light-chain enhancer of activated B cells; NLRP3 = NACHT, leucine-rich repeat, and pyrin domain-containing protein 3; NOD = nucleotide-binding oligomerization domain; NSAID = nonsteroidal anti-inflammatory drug; PAMP = pathogen-associated molecular pattern; PLA2 = phospholipase A2; TLR = Toll-like receptor. Reproduced with permission from Chiabrando et al.
FIGURE 6
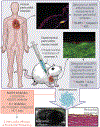
FIGURE 6. Mouse Model of Pericardial Inflammation Pathophysiology and Therapeutics
A mouse model of acute pericarditis was developed through the intrapericardial injection of zymosan A, leading to the classic features of the inflamed pericardium: PEff, pericardial thickening, and increased expression of the NLRP3 inflammasome. By inhibiting the NLRP3 inflammasome or IL-1β, the PEff and pericardial thickening and the NLRP3 inflammasome expression were greatly reduced compared with vehicle. Treatment with IL-1 trap, neutralizing both IL-1β and IL-1α, produced a powerful effect on pericardial inflammation in the experimental pericarditis model. Reproduced with permission from Mauro et al. Abbreviations as in Figures 4 and 5.
FIGURE 7
FIGURE 7. Time to Pericarditis Recurrence in Anti–IL-1 Agents Randomized Withdrawal Trials
Survival curves for time to pericarditis recurrence in the (A) AIRTRIP (anakinra), (B) RHAPSODY (rilonacept), (C) and Myachikova et al (goflikicept) randomized withdrawal trials, reproduced with permission from Klein et al. All 3 studies showed a significant reduction in pericarditis recurrence compared with placebo after randomized withdrawal of the treatment drug. AIRTRIP = Anakinra—Treatment of Recurrent Idiopathic Pericarditis; RHAPSODY = Rilonacept Inhibition of Interleukin-1 Alpha and Beta for Recurrent Pericarditis: A Pivotal Symptomatology and Outcomes Study.
FIGURE 8
FIGURE 8. Spectrum of Pericardial Diseases, CMR Findings, and Imaging-Guided Therapies
The use of CMR–based pericardial characterization, demonstrating the continuum of inflammatory pericardial diseases starting from acute inflammation (with or without CP physiology) and ending in either burned-out pericarditis or calcific CP. Reproduced with permission from Chetrit et al. DHE = delayed hyperenhancement (LGE); other abbreviations as in Figure 3.
FIGURE 9
FIGURE 9. Proposed Pericardial LGE Severity Grading Criteria in CMR
Pericardial LGE severity grading criteria on CMR PSIR-LGE sequence (fat-suppressed sequence suggested), based on pericardial enhancement thickness and circumferential extent on short-axis imaging at basal, mid, and apical slices. PSIR = phase-sensitive inversion-recovery; other abbreviations as in Figure 3.
FIGURE 10
FIGURE 10. Serial Pericardial LGE Evaluation With CMR for a Complex Case of RP to Show Time Course and to Assess Pericarditis Severity, Surveillance, and Response to Therapy
(A) Initial encounter with incessant pericarditis with chest pain symptoms despite ibuprofen and colchicine, C-reactive protein (CRP) 30.5 mg/dL, sedimentation rate 30 mm/h, severe pericardial LGE (arrow). Added prednisone. (B) 6-month follow-up, persistent symptoms on ibuprofen + colchicine + prednisone, CRP 6.8 mg/dL, sedimentation rate 33 mm/h still elevated, moderate pericardial LGE. Switched prednisone to anakinra. (C) 1-year follow-up, symptoms resolution on anakinra and colchicine, CRP 0.1 mg/dL, sedimentation rate 2 mm/h, mild pericardial LGE. (D) 2-years later, anakinra and colchicine had been stopped after course completed, recurrence of symptoms, CRP 7.4 mg/dL, sedimentation rate 41 mm/h, mild pericardial LGE. Started rilonacept after this examination. (E) 1-year follow-up on rilonacept, symptoms resolution, CRP <0.3 mg/dL, sedimentation rate 2 mm/h, trivial pericardial LGE. Consider stopping rilonacept. (F) 18-month followup on rilonacept, symptom free, CRP <0.3 mg/dL, sedimentation rate 2 mm/h, trivial pericardial LGE. Other abbreviation as in Figure 3.
FIGURE 11
FIGURE 11. Pericardial Native T1-Mapping Sequence Correlation With Other Tissue Characterization Sequences in CMR
(A) Pericardial native T1-mapping sequence (modified look-locker inversion recovery) indicated elevated T1 times in the pericardium (white arrows). (B) Correlations with elevated signal on T2-STIR sequence indicating pericardial edema. (C) Correlations with LGE on PSIR-LGE sequence indicating pericardial inflammation/fibrosis (white arrows). Abbreviations as in Figures 3 and 9.
FIGURE 12
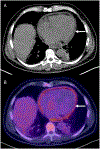
FIGURE 12. Pericarditis Case in FDG-PET
(A) Noncontrast computed tomography demonstrates pericardial thickening (arrow). (B) 18F-FDG-PET indicating increasing pericardial signal consistent with acute pericarditis (arrow). FDG = fluorodeoxyglucose; PET = positron emission tomography.
FIGURE 13
FIGURE 13. TTE Case of Intensely Inflammatory Acute Pericarditis With Fever, Raised CRP, and Neutrophil Leukocytosis
Two-dimensional TTE revealed a large circumferential PEff with remarkable intrapericardial fibrin strands indicated by white arrows ([A] apical view and [B] short axis). (C and D) Complete resolution after several days of indomethacin. TTE = transthoracic echocardiography; other abbreviation as in Figure 4.
FIGURE 14
FIGURE 14. CMR Case of Acute Pericarditis
(A) A mild PEff is well evident (blue arrow). Of interest, at the same location, a hyperintense pericardium, in both (B) T2-weighted and (C) LGE images, is suggestive for acute pericardial inflammation (red arrows). (D-F) Similarly, different views of pericardial hyperintensity in LGE images supporting pericardial inflammation (red arrows) are presented. Abbreviations as in Figures 3 and 4.
FIGURE 15
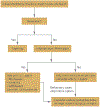
FIGURE 15. New Therapeutic Algorithm for RP According to the Presentation Phenotype
RP = recurrent pericarditis; other abbreviations as in Figure 5.
FIGURE 16
FIGURE 16. Hallmarks of Pericarditis in CMR: Evidence of Pericardial Thickening, Edema, and LGE
(A) Black-blood spin-echo sequence axial image showing pericardial thickening (arrow). (B) T2-STIR sequence short-axis imaging showing pericardial edema (arrow). (C) PSIR-LGE sequence short-axis images with fat suppression showing pericardial LGE indicating inflammation (arrow). Abbreviations as in Figures 3 and 9.
FIGURE 17
FIGURE 17. Goals of MMI in PEff and CTP
CT = computed tomography; CTP = cardiac tamponade; MMI = multimodality imaging; other abbreviations as in Figures 3 and 4.
FIGURE 18
FIGURE 18. Sizing and Characterization of PEffs With TTE
Representative (A) small, (B) moderate, and (C) large PEffs (stars). Representative (D) simple PEff with fibrin strands, (E) exudative PEff, and (F) malignant PEff (stars) caused by pericardial mesothelioma. TTE = transthoracic echocardiography; other abbreviation as in Figure 4.
FIGURE 19
FIGURE 19. PEff Mimickers on MMI
(A) Pericardial cyst (star) masquerading as PEff in TTE (top), which is better characterized on cardiac CT (bottom). (B) Prominent pericardial fat (plus sign) mimicking complex PEff on TTE (top), which is better characterized in CMR (bottom). (C) Pleural effusion (double star) with lung atelectasis giving the appearance of a PEff. (D) Subcostal view of a TTE (top) demonstrates a large heterogenous echodensity anterior to the right atrium and ventricle (arrow) with associated chamber compression. In computed tomographic angiography (bottom), the soft tissue attenuation and vascularity of the large mass is appreciated. On resection, pathology demonstrated a benign hemangioma. Abbreviations as in Figures 3, 4, 17, and 18.
FIGURE 20
FIGURE 20. TTE Signs of CTP
(A) TTE in parasternal long-axis view featuring moderate PEff (asterisk). (B) Parasternal long-axis and short-axis views demonstrate end-diastolic right ventricular free wall collapse. Significant respirophasic tricuspid (C) and mitral (D) inflow velocity variation is noted, and there is a plethoric IVC (E). Exp = expiration; Insp = inspiration; other abbreviations as in Figures 2, 4, and 18.
FIGURE 21
FIGURE 21. Characterization of PEff With CT and CMR
(A) Cardiac CT with delayed acquisition featuring pericardial enhancement (pericardial inflammation) with associated (asterisk) small exudative PEff. (B) Cardiac CT demonstrating (asterisk) hemorrhagic PEff (53 HU) caused by left atrial appendage perforation from Watchman device migration. (C) TTE (left) in short-axis view demonstrates abnormal lateral wall thinning in continuity with intrapericardial hematoma and moderate-sized (asterisk) hemorrhagic PEff (49 HU). (D) Transesophageal echocardiogram (top) and CT (bottom) demonstrates a hematoma causing focal CTP because of collapse of the right atrium. (E) CMR demonstrates underlying pericardial edema on T2 weighted imaging and pericardial inflammation on LGE sequence. Findings are consistent with acute pericarditis with associated small PEff. Abbreviations as in Figures 3, 4, 17, and 18.
FIGURE 22
FIGURE 22. TTE Features of CP
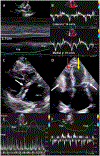
(A) M-mode subcostal view showing dilated IVC measuring 2.7 cm with <50% collapse. (B) Tissue Doppler of mitral annulus lateral e′ lower than medial e′, indicating annulus reversus. (C) Parasternal ventricular short axis view with respiratory interventricular septal shift (arrow). (D) Apical 4-chamber view with pericardial calcifications and tethering at the lateral to mitral and tricuspid annulus (white arrows); and left ventricle cylindrical (yellow arrow) and right ventricle conical (red arrow) deformities. (E) Mitral valve inflow pulsed-wave Doppler indicating significant >25% respirophasic variation. (F) Hepatic vein pulsed-wave Doppler indicating expiratory end-diastolic reversal velocity/forward flow velocity >0.8. Abbreviation as in Figure 2.
FIGURE 23
FIGURE 23. Diagnostic Algorithm and Validation of TTE Parameters for CP
NPV = negative predictive value; PPV = positive predictive value; other abbreviations as in Figures 3 and 18.
FIGURE 24
FIGURE 24. Cardiac CT and CMR Features of CP
(A) Noncontrast cardiac CT ventricular short-axis view showing severe pericardial calcifications (arrow). (B) CMR black-blood spin-echo axial view showing significant pericardial thickening. (C) Free breathing cine sequence ventricular short-axis view showing respirophasic interventricular septal shift (typically flattening of septum with inspiration; white arrow). Abbreviations as in Figures 3 and 17.
FIGURE 25
FIGURE 25. Pericardial Cyst Multimodality Cardiac Imaging Evaluation
Pericardial cyst at the right cardiophrenic angle, indicated by arrows. (A) TTE with possible echo lucency vs drop-out adjacent to the right atrium and ventricle. (B) CMR showing T1 (isointense). (C) T2 fat saturation (hyperintense). (D) Post-contrast delayed enhancement imaging (no gadolinium uptake) consistent with a pericardial cyst. Abbreviations as in Figures 3 and 18.
FIGURE 26
FIGURE 26. Pericardial Invasion From Lung Cancer Evaluation in CMR
Patient with known non–small cell lung cancer, indicated by arrows. (A) CMR T1-weighted image showing mass with isointense signal and invasion into the epicardium near the right atrioventricular grove. (B) In T2-weighted image, mass is hyperintense. (C and D) In LGE images, mass has heterogeneous gadolinium uptake. Findings are consistent with a malignant lesion. Abbreviations as in Figure 3.
FIGURE 27
FIGURE 27. Pericardial Mesothelioma Case in CT and CMR
(A) Axial slice in cardiac CT with contrast: homogeneous mass vs PEff surrounding the heart (white arrow). (B) Axial slice on CMR steady-state free-precession sequence before contrast, showing the mesothelioma mass (white arrow) with associated loculated PEff adjacent to right atrium (yellow arrow), along with pleural effusions (red arrow). (C) Phase-sensitive inversion-recovery LGE sequence after contrast, showing mild contrast update but relatively low heterogeneous signal within the pericardial mesothelioma mass (white arrow), expected no uptake within the PEff (yellow arrow), and circumferential pericardial LGE, indicating degree of inflammation (red arrow). (D) Free breathing cine sequence showing respirophasic septal shift (white arrow) representing degree of CP physiology. Abbreviations as in Figures 3, 4, and 17.
FIGURE 28
FIGURE 28. Cardiac Sarcoma Evaluation in CMR and PET
Primary cardiac sarcoma involving the left atrium invading into the right pulmonary vein and pericardium, indicated by arrows. (A) Isointense signal on T1-weighted sequence. (B) Hyperintense signal on T2-weighted sequence. (C) Heterogeneous gadolinium uptake with central core of necrosis. (D) FDG-PET–computed tomography showing hypermetabolic activity of the left atrial mass consistent with a malignancy. Abbreviations as in Figures 3 and 12.
FIGURE 29
FIGURE 29. Cardiac Fibroma Evaluation in CMR
Patient presented with heart block with MMI evaluation of fibroma (arrows). CMR: (A) Hypointense signal on T2-weighted imaging with well-defined border, (B) also hypointense signal on T1-weighted image, and (C) LGE sequence, often homogeneous gadolinium uptake from collagen. (D) FDG PET: low metabolic activity. (E) Cardiac CT showing mass with focal calcifications. Abbreviations as in Figures 3, 12, and 17.
FIGURE 30
FIGURE 30. ECG and Chest X-Ray Findings in CAP
(Top) Typical electrocardiogram of patient with absent pericardium showing right axis deviation, incomplete right bundle branch block, and right ventricular hypertrophy. (Bottom) Chest x-ray findings in complete (A) and partial (B) absence of the pericardium. Note the interposition of lung tissue causing a prominent aortopulmonary window (arrow in A). Arrow in B indicates herniated left atrial appendage through a partial pericardial defect. Adapted with permission from Gatzoulis et al. CAP = congenital absence of the pericardium; ECG = electrocardiography.
FIGURE 31
FIGURE 31. TTE Evaluation of CAP
Parasternal long-axis (left) and apical 4-chamber (right) views. TTE images show, (A) unusual echo window with posterior orientation of the LV apex, (B) “tear-drop” appearance due to bulbous ventricles and abnormal atrial-ventricular angle and (C) elongated atrium. Reproduced with permission from Abbas et al. LA = left atrium; LV = left ventricle; RA = right atrium; RV = right ventricle; other abbreviation as in Figure 18.
FIGURE 32
FIGURE 32. CT and CMR Evaluation of CAP
(Top) Cardiac CT evaluation. (A) Note the interposed lung between the aorta and main pulmonary artery (arrow). (B) Mediastinal shift to the left is noticeable with clockwise rotation of the heart. (Bottom) Cardiac CMR steady-state free precision sequence showing (C) significant displacement of the heart into the left hemithorax with complete absence of the pericardium (arrow pointing to apex), compared with (D) normal pericardial position (arrow pointing to apex). Reproduced with permission from Asher et al. Abbreviations as in Figures 3, 17, and 31.
FIGURE 33
FIGURE 33. Novel Algorithm for the Diagnostic and Therapeutic Approach to Acute and RP
Of note, radical pericardiectomy surgery should be performed at high-volume experienced surgical centers. DHE = delayed hyperenhancement (LGE); LGE = late gadolinium enhancement; NSAID = nonsteroidal antiinflammatory drug; RHC = right heart catheterization; RP = recurrent pericarditis; other abbreviations as in Figures 3, 5, 10, 17, 18, and 30.
FIGURE 34
FIGURE 34. Novel Algorithm for the Diagnostic and Therapeutic Approaches to a PEff
Abbreviations as in Figures 2, 3, 4, 10, 17, and 30.
FIGURE 35
FIGURE 35. A Multimodal Approach to the Noninvasive Diagnosis of CP
LVGLS = left ventricular global longitudinal strain; MRI = magnetic resonance imaging; T2 STIR = T2-weighted short-tau inversion recovery; other abbreviations as in Figures 1, 2, and 17.
CENTRAL ILLUSTRATION
CENTRAL ILLUSTRATION. Multimodality Cardiac Imaging and Therapies for Pericardial Diseases
CMR = cardiac magnetic resonance; CT = computed tomography; IL = interleukin; NSAID = nonsteroidal anti-inflammatory drug; TTE = transthoracic echocardiography.

References

    1. Klein AL, Abbara S, Agler DA, et al. American Society of Echocardiography clinical recommendations for multimodality cardiovascular imaging of patients with pericardial disease: endorsed by the Society for Cardiovascular Magnetic Resonance and Society of Cardiovascular Computed Tomography. J Am Soc Echocardiogr. 2013;26:965–1012. - PubMed
    1. Adler Y, Charron P, Imazio M, et al. 2015 ESC guidelines for the diagnosis and management of pericardial diseases. Eur Heart J. 2015;36:2921–2964. - PubMed
    1. Cremer PC, Kumar A, Kontzias A, et al. Complicated pericarditis: understanding risk factors and pathophysiology to inform imaging and treatment. J Am Coll Cardiol. 2016;68:2311–2328. - PubMed
    1. Chiabrando JG, Bonaventura A, Vecchié A, et al. Management of acute and recurrent pericarditis: JACC state-of-the-art review. J Am Coll Cardiol. 2020;75:76–92. - PubMed
    1. Brucato A, Imazio M, Gattorno M, et al. Effect of anakinra on recurrent pericarditis among patients with colchicine resistance and corticosteroid dependence: the AIRTRIP randomized clinical trial. JAMA. 2016;316:1906–1912. - PubMed

MeSH terms

LinkOut - more resources