. 2024 Aug 8;15(1):6744.
doi: 10.1038/s41467-024-51003-7.

Multisensory gamma stimulation mitigates the effects of demyelination induced by cuprizone in male mice

Affiliations

Multisensory gamma stimulation mitigates the effects of demyelination induced by cuprizone in male mice

Daniela Rodrigues-Amorim et al. Nat Commun. .

Abstract

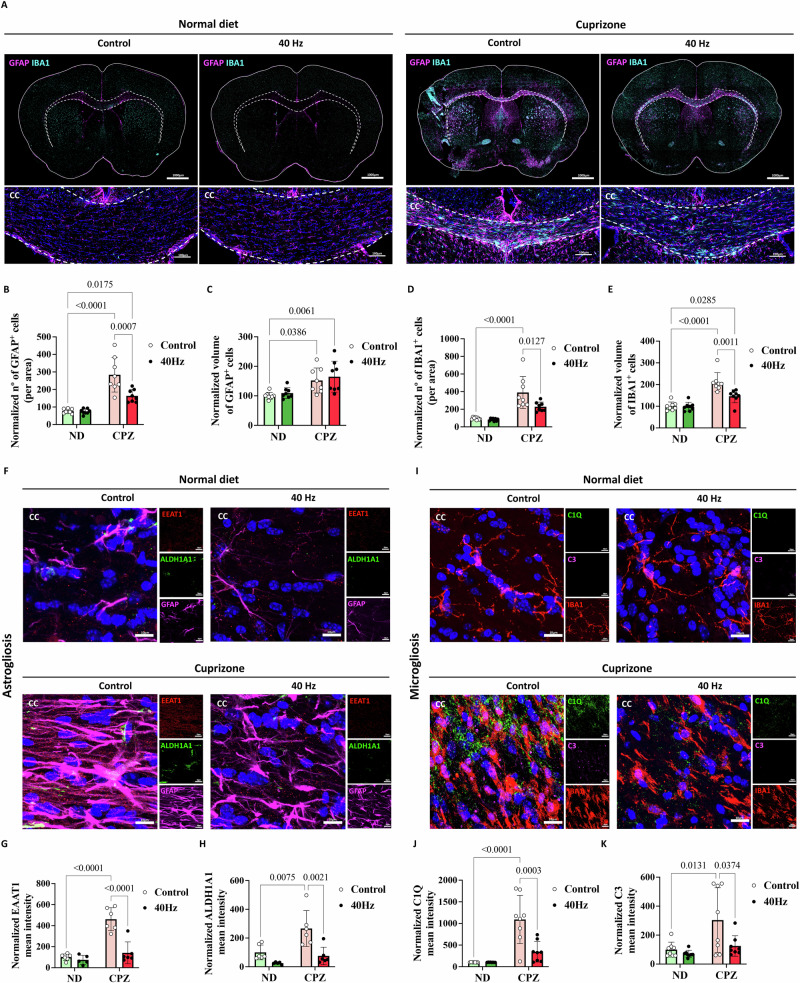
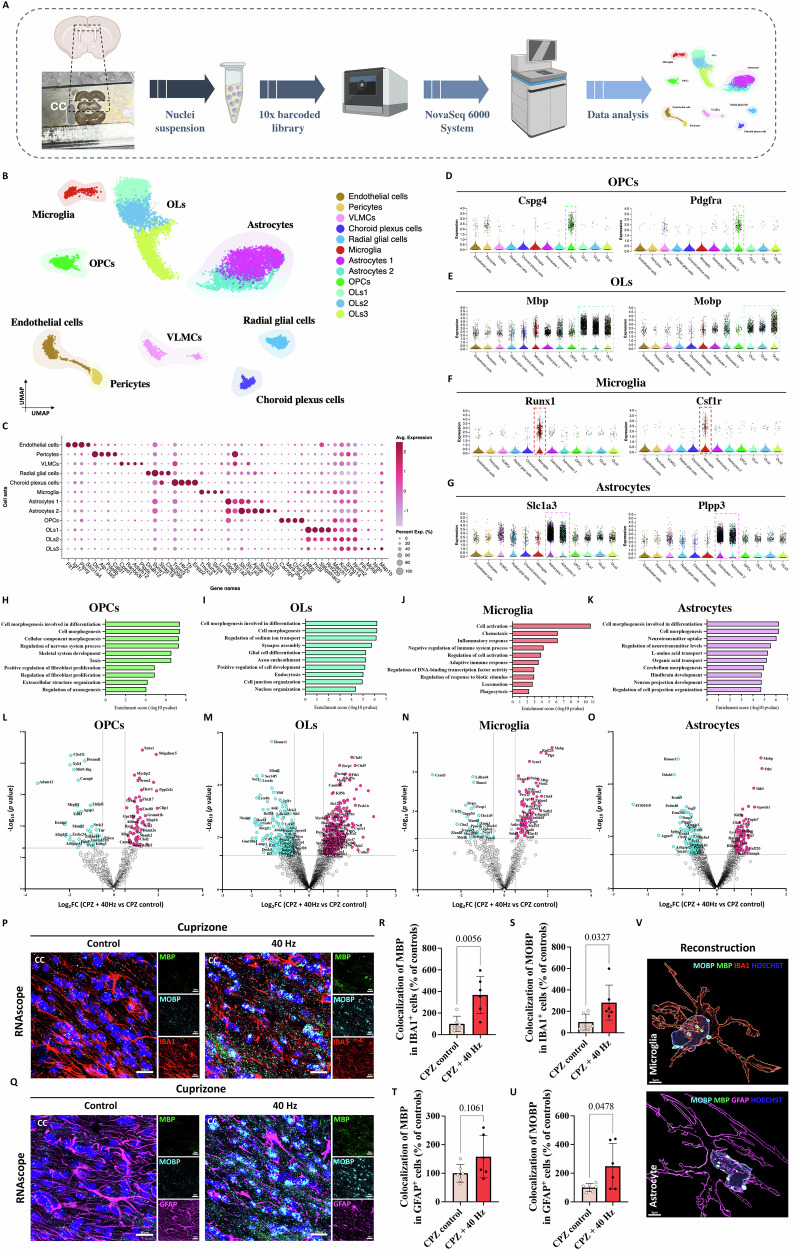
Demyelination is a common pathological feature in a wide range of diseases, characterized by the loss of myelin sheath and myelin-supporting oligodendrocytes. These losses lead to impaired axonal function, increased vulnerability of axons to damage, and result in significant brain atrophy and neuro-axonal degeneration. Multiple pathomolecular processes contribute to neuroinflammation, oligodendrocyte cell death, and progressive neuronal dysfunction. In this study, we use the cuprizone mouse model of demyelination to investigate long-term non-invasive gamma entrainment using sensory stimulation as a potential therapeutic intervention for promoting myelination and reducing neuroinflammation in male mice. Here, we show that multisensory gamma stimulation mitigates demyelination, promotes oligodendrogenesis, preserves functional integrity and synaptic plasticity, attenuates oligodendrocyte ferroptosis-induced cell death, and reduces brain inflammation. Thus, the protective effects of multisensory gamma stimulation on myelin and anti-neuroinflammatory properties support its potential as a therapeutic approach for demyelinating disorders.


Conflict of interest statement

L.-H.T. is a scientific founder and serves on the scientific advisory board of Cognito Therapeutics. The remaining authors declare no competing interests.

Figures

Fig. 1
Fig. 1. GENUS reduces cuprizone-induced demyelination.
A LFP schematic approach. B LFP spectrograms from the PFC and SSp at two different time points. C Tile scan of mouse brain slices of one mouse to confirm probe implantation using MBP (green) and GFAP (magenta) antibodies (mouse brain atlas by Matt Gaidica, scale bar: 1000 μm). DH IHC of Fluoromyelin (green) and MOG antibody (red) of the CC (n = 8 mice per group, each dot corresponds to a technical replicate, tile scan, scale bar—100 μm). E Normalized fluorescence intensity of Fluoromyelin® in the CC area (mean ± SD). F (1,28) = 11,56; p = 0.0020. F Normalized fluorescence intensity of MOG in the CC area (mean ± SD). F (1,28) = 1.359; p = 0.2535. G Morphometric analysis of CC area (mean ± SD). F (1,28) = 8.330; p = 0.0074. H Morphometric analysis of CC thickness (mean ± SD). F (1,28) = 8.660; p = 0.0065. I IHC of MBP antibody (green) in different brain areas (Ctx cortex, AC anterior commissure, CC corpus callosum and STR striatum; representative image, one mouse per group). JM Representative TEM images of the CC of (n = 4 mice per group; 14 technical replicates for high magnification images and one technical replicate for low magnification images, 200 axons per mouse). K G-ratio quantification (mean ± SD). F (597,2398) = 0.8396; p = 0.9959. L Myelin thickness quantification (mean ± SD). F (597,2398) = 0.8617; p = 0.9879. M Axon diameter quantification (mean ± SD). F (597,2398) = 0.9513; p = 0.7747. N Scatter plot displays the linear regression of g-ratios of individual myelinated axons per their axon diameter for each group. O Bar graph displays the percentage of myelinated axons to their axon diameter, for each group. PS Experimental detail of stimulated and recording electrodes implanted in the CC to detect CAPs (n = 3 mice per group, two technical replicates). Q CAPs detected across the experimental groups showed N1 (myelinated axons) and N2 (non-myelinated axons) peaks. R Quantification of N1 CAP amplitude. F (60,2079) = 9.366; p < 0.0001. S Quantification of N2 CAP amplitude. F(60,2079) = 1.119; p = 0.2498. All p-values were calculated using two-way ANOVA followed by Bonferroni’s multiple comparisons test (Supplementary Data S14). Schematic panel A and P were created with BioRender. Source data are provided as a Source Data file. **** p ≤ 0.0001, ** p ≤ 0.01, *p < 0.005. LFP local field potentials, CPZ cuprizone, ND normal diet, SSp somatosensory cortex, PFC prefrontal cortex, CAPs compound action potentials.
Fig. 2
Fig. 2. GENUS rescued distinct CPZ-induced pathological signatures.
A TMT proteomics workflow. B Overall pathway-specific biology analysis of DEPs (a total of 473). C Heatmap of DEPs after filtering the proteins of interest. DH From the heatmap, 3 panels were associated with the GENUS effect (n = 4 CPZ + 40 Hz; n = 3 CPZ control; n = 4 ND + 40 Hz; n = 4 ND control, one technical replicate). D Panel I shows the marked overexpression of DEPs in the CPZ control group, but also in the ND control group. F (72,275) = 0.4664; p > 0.9999. E Sankey diagram of significantly enriched biological pathways (top 5 GO terms). F Panel II shows the marked underexpression of DEPs in the CPZ control group, as well as, in the ND control group. F (12,55) = 0.1093; p > 0.9999. G Sankey diagram of significantly enriched biological pathways (top 5 GO terms). H Panel III shows the marked underexpression of DEPs in the CPZ control group. F (24,99) = 0.1095; p > 0.9999. I Sankey diagram of significantly enriched biological pathways (top 5 GO terms). JM IHC of HMGB1 (red), OLIG2 (green), and GFAP (magenta) of the CC of 12-week WT mice under CPZ and ND (n = 6 CPZ + 40 Hz; n = 6 CPZ control; n = 6 ND + 40 Hz; n = 6 ND control, scale bar—5 μm). K Normalized mean intensity of HMGB1 in the CC area (mean ± SD). F (1,18) = 62.38; p < 0.0001. L Normalized colocalization of HMGB1 GFAP+ cells in the CC area (mean ± SD). F(1,19) = 7.167; p = 0.0149. M Normalized colocalization of HMGB1 OLIG2+ cells in the CC area (mean ± SD). F (1,19) = 15.11; p = 0.0010. NQ IHC of SYN1 (green), SHANK3 (red), and MAP2 (magenta) of the anterior cingulate cortical area (ACA) (n = 6 mice per group, scale bar—5 μm). O Normalized mean intensity of SYN in the ACA area (mean ± SD). F (1,20) = 6.710; p = 0.0175. P Normalized mean intensity of SHANK3 in the ACA area (mean ± SD). F(1,20) = 5.525; p = 0.0291. Q Normalized mean intensity of MAP2 in the ACA area (mean ± SD). F (1,20) = 7.737; p = 0.0115. All P-values were calculated using two-way ANOVA followed by Bonferroni’s multiple comparisons test (Supplementary Data S14). Schematic panel A was created with BioRender. Source data are provided as a Source Data file. CPZ cuprizone, ND normal diet.
Fig. 3
Fig. 3. Neuroinflammation induced by cuprizone is reduced by GENUS.
AE IHC of GFAP (magenta) and IBA1 (cyan) of the CC of 12-week WT mice under CPZ and ND after 6 weeks of diet intervention and 3 weeks of 1 h/day of GENUS or control (n = 8 mice per group, one technical replicate, tile scan, scale bar—50 μm). B Normalized number of GFAP+ cells in the CC area (mean ± SD). F(1,28) = 9.763; p = 0.0041. C Normalized volume of GFAP cells in the CC area (mean ± SD). F(1,28) = 0.0194; p = 0.8902. D Normalized number of IBA1+ cells in the CC area (mean ± SD). F(1,28) = 4.866; p = 0.0358. E Normalized volume of IBA1 cells in the CC area (mean ± SD). F(1,28) = 8.653; p = 0.0065. F–H IHC of EAAT1 (red), ALDH1A1 (green), and GFAP (magenta) of the CC of 12-weeks WT mice under CPZ and ND after 6 weeks of diet intervention and 3 control weeks of 1 h/day of GENUS or control (n = 6 mice per group, one technical replicate, scale bar—10 μm). G Normalized mean intensity of EAAT1 in the CC area (mean ± SD). F(1,19) = 18.63; p = 0.0004. H Normalized mean intensity of ALDH1A1 in the CC area (mean ± SD). F(1,19) = 3.327; p = 0.0839. IK IHC of IBA1 (red), C1Q (green), and C3 (magenta) of the CC of 12-weeks WT mice under CPZ and ND after 6 weeks of diet intervention and 3 weeks of 1 h/day of GENUS or control (n = 8 mice per group, two technical replicates, scale bar—10 μm). J Normalized mean intensity of C1Q in the CC area (mean ± SD). F(1,27) = 11.47; p = 0.0022. K Normalized mean intensity of C3 in the CC area (mean ± SD). F(1,28) = 3.071; p = 0.0907. All p-values were calculated using two-way ANOVA followed by Bonferroni’s multiple comparisons test (Supplementary Data S14). Source data are provided as a Source Data file.
Fig. 4
Fig. 4. Single-nucleus RNA sequencing analysis of the CC.
A Overview of the experimental design. Single-nucleus RNA sequencing (snRNA-seq) was performed in 12-week WT mice under CPZ and ND after 6 weeks of diet intervention and 3 weeks of 1 h/day of GENUS or control (n = 4 mice per group, one technical replicate). B UMAP plot of sn-RNAseq data. C Bubble plot showing expression levels of marker genes for each cell type. D Violin plot of upregulated genes in OPCs (Cspg4 and Pdgfra). E Violin plot of upregulated genes in OLs (Mbp and Mobp). F Violin plot of upregulated genes in microglia (Runx1 and Csf1r). G Violin plot of upregulated genes in astrocytes (Slc1a3 and Plpp3). HK Bar plots of significantly enriched biological pathways of top-50 upregulated genes in OPCs, OLs, microglia and astrocytes, respectively. p-Values are calculated based on the accumulative hypergeometric distribution. LO Volcano plot showing the top DEGs within OPCs, OLs, microglia and astrocytes, respectively. p-Values are calculated based on the Wilcoxon rank-sum test. PU RNAscope using Mbp and Mobp probes combined with IHC for IBA1 staining of the CC (n = 6 CPZ + 40 Hz and n = 6 CPZ control, one technical replicate, scale bar—20 μm). Q RNAscope using Mbp and Mobp probes combined with IHC for GFAP staining of the CC (n = 6 CPZ + 40 Hz and n = 6 CPZ control, one technical replicate, scale bar—20 μm). R Normalized colocalization of Mbp transcripts in IBA1+ cells in the CC area. The graph displays normalized values using an unpaired two-tailed Student’s t-test (mean ± SD). S Normalized colocalization of Mobp transcripts in IBA1+ cells in the CC area. The graph displays normalized using an unpaired two-tailed Student’s t-test (mean ± SD). T Normalized colocalization of Mbp transcripts in GFAP+ cells in the CC area. The graph displays normalized values using an unpaired two-tailed Student’s t-test (mean ± SD). U Normalized colocalization of Mobp transcripts in GFAP+ cells in the CC area. The graph displays normalized values using an unpaired two-tailed Student’s t-test (mean ± SD). V 3D reconstruction of the RNAscope images. Schematic panel A was created with BioRender. Source data are provided as a Source Data file. CC corpus callosum, OPCs oligodendrocyte progenitor cell, OLs oligodendrocytes.
Fig. 5
Fig. 5. GENUS stimulates oligodendrogenesis and reduces OL cell death.
AC IHC of APCCC1 (red) and PDGFRα (green) of the CC of 12-week WT mice under CPZ and ND after 6 weeks of diet intervention and 3 weeks of 1 h/day of GENUS or control (n = 7 CPZ + 40 Hz; n = 8 CPZ control; n = 8 ND + 40 Hz; n = 8 ND control, one technical replicate, scale bar—20 μm). Dashed lines indicate the boundaries of the CC. B Normalized number of PDGFR+ cells in the CC area (mean ± SD). F(1,27) = 12.53; p = 0.0015. C Normalized number of APCCC1+ cells in the CC area (mean ± SD). F(1,27) = 7.964; p = 0.0088. DF IHC of Ki67 (green) and OLIG2 (red) of the CC of 12-week WT mice under CPZ and ND after 6 weeks of diet intervention and 3 weeks of 1 h/day of GENUS or control (n = 8 mice per group, one technical replicate, scale bar—20 μm). E Normalized number of OLIG2+ cells in the CC area (mean ± SD). F(1,26) = 7.894; p = 0.0093. F Normalized number of Ki67+OLIG2+ cells in the CC area (mean ± SD). F(1,27) = 3.981; p = 0.0562. G Representative image of the TUNEL colorimetric assay in CC comparing the four conditions, CPZ + 40 Hz, CPZ control, ND + 40 Hz, ND control (scale bar—100 μm). TUNEL-positive cells (apoptotic cells) acquired a dark brown color. HJ IHC of GPX4 (green) and OLIG2 (red) of the CC of 12-week WT mice under CPZ and ND after 6 weeks of diet intervention and 3 weeks of 1 h/day of GENUS or control (n = 7 CPZ + 40 Hz; n = 7 CPZ control; n = 8 ND + 40 Hz; n = 8 ND control, one technical replicate, scale bar—20 μm). I Normalized mean intensity of GPX4 in the CC (mean ± SD). F(1,26) = 1.149; p = 0.2936. J Normalized number of GPX4+ cells colocalized with OLIG2 in the CC area (mean ± SD). F(1,26) = 2.515; p = 0.1248. All p-values were calculated using two-way ANOVA followed by Bonferroni’s multiple comparisons test (Supplementary Data S14). Source data are provided as a Source Data file.

References

    1. Aggarwal, S., Yurlova, L. & Simons, M. Central nervous system myelin: structure, synthesis and assembly. Trends Cell Biol.21, 585–593 (2011). 10.1016/j.tcb.2011.06.004 - DOI - PubMed
    1. Franklin, R. J. M. & Ffrench-Constant, C. Remyelination in the CNS: from biology to therapy. Nat. Rev. Neurosci.9, 839–855 (2008). 10.1038/nrn2480 - DOI - PubMed
    1. Love, S. Demyelinating diseases. J. Clin. Pathol.59, 1151–1159 (2006). 10.1136/jcp.2005.031195 - DOI - PMC - PubMed
    1. Graves, J. et al. Protective environmental factors for neuromyelitis optica. Neurology83, 1923–1929 (2014). 10.1212/WNL.0000000000001001 - DOI - PMC - PubMed
    1. Menge, T. et al. Acute disseminated encephalomyelitis: an update. Arch. Neurol.62, 1673–1680 (2005). 10.1001/archneur.62.11.1673 - DOI - PubMed