. 2024 Aug 7;15(1):6367.
doi: 10.1038/s41467-024-48897-8.

Male autism spectrum disorder is linked to brain aromatase disruption by prenatal BPA in multimodal investigations and 10HDA ameliorates the related mouse phenotype

Collaborators, Affiliations

Male autism spectrum disorder is linked to brain aromatase disruption by prenatal BPA in multimodal investigations and 10HDA ameliorates the related mouse phenotype

Christos Symeonides et al. Nat Commun. .

Abstract

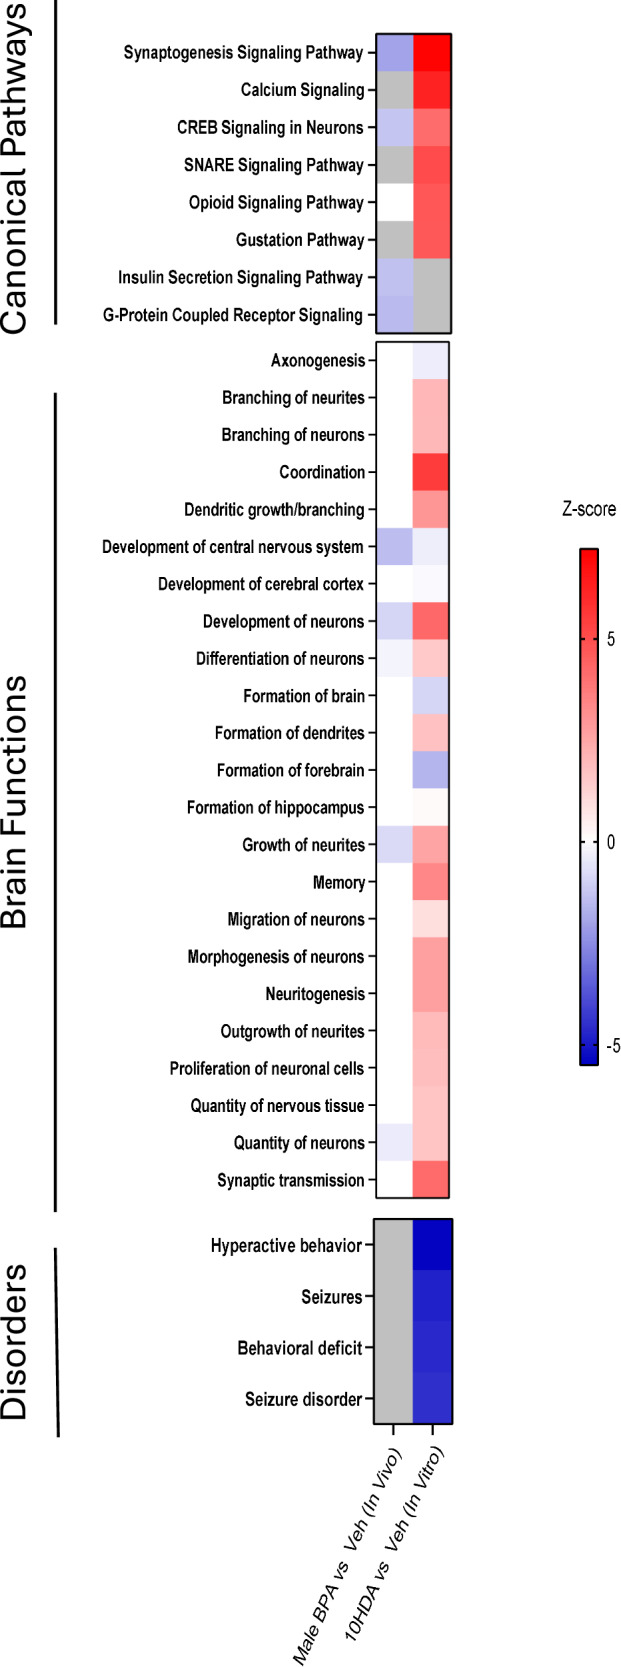
Male sex, early life chemical exposure and the brain aromatase enzyme have been implicated in autism spectrum disorder (ASD). In the Barwon Infant Study birth cohort (n = 1074), higher prenatal maternal bisphenol A (BPA) levels are associated with higher ASD symptoms at age 2 and diagnosis at age 9 only in males with low aromatase genetic pathway activity scores. Higher prenatal BPA levels are predictive of higher cord blood methylation across the CYP19A1 brain promoter I.f region (P = 0.009) and aromatase gene methylation mediates (P = 0.01) the link between higher prenatal BPA and brain-derived neurotrophic factor methylation, with independent cohort replication. BPA suppressed aromatase expression in vitro and in vivo. Male mice exposed to mid-gestation BPA or with aromatase knockout have ASD-like behaviors with structural and functional brain changes. 10-hydroxy-2-decenoic acid (10HDA), an estrogenic fatty acid alleviated these features and reversed detrimental neurodevelopmental gene expression. Here we demonstrate that prenatal BPA exposure is associated with impaired brain aromatase function and ASD-related behaviors and brain abnormalities in males that may be reversible through postnatal 10HDA intervention.


Conflict of interest statement

W.C.B. is a co-inventor on ‘Methods of treating neurodevelopmental diseases and disorders’, USA Patent No. US9925163B2, Australian Patent No. 2015271652. This has been licensed to Meizon Innovation Holdings. A.-L.P. is a scientific advisor and W.C.B. is a board member of the Meizon Innovation Holdings. The remaining authors declare no competing interests.

Figures

Fig. 1
Fig. 1. Association between prenatal bisphenol A (BPA) exposure and autism spectrum disorder outcomes stratified by assigned sex at birth and CYP19A1 genetic score for aromatase enzyme activity.
Conditional logistic regression models were run where participants were matched on ancestry and time of day of urine collection and, for ASD diagnosis at 9 years, each case within these matched groups was individually matched to eight controls based on nearest date of and age at year 9 interview. BPA was classified in quartiles with the top quartile above 2.18 μg/L as high BPA exposure vs the other three quartiles. ‘Low aromatase enzyme activity’ means being in the top quartile and ‘high aromatase enzyme activity’ means being in the lower three quartiles of an unweighted sum of the following genotypes associated with lower estrogen levels (participant given 1 if genotype is present, 0 if not): CC of rs12148604, GG of rs4441215, CC of rs11632903, CC of rs752760, AA of rs2445768. ‘Greater ASD symptoms’ represents a T-score above 50 (that is, above median based on normative data) on the DSM-5-oriented autism spectrum problems scale of the Child Behavior Checklist for Ages 1.5-5 (CBCL). Data are OR ± 95% CI. Source data are provided as a Source Data file. * Since there were only two ASD cases at age 9 in the girls with low aromatase enzyme activity group, the regression model was not run.
Fig. 2
Fig. 2. Prenatal BPA-associated aromatase CYP19A1 gene methylation in cord blood.
Visualized using the coMET R package. A Association of individual CpGs along the region of interest with BPA exposure, overlaid with three methylation windows: a 2 CpG window positioned directly on promoter PII, and 7 and 15 CpG windows overlapping PI.f. The red shading reflects each CpG’s level of methylation (beta value). B The CYP19A1 gene, running right to left along chromosome 15, and the positions of both brain promoters. Orange boxes indicate exons. C A correlation matrix for all CpGs in this region. Highlighted in tan are the two CpGs located within the PII promoter sequence and the single CpG located within PI.f. For the 7 CpG window over promoter PI.f, higher BPA associated positively with methylation, mean increase = 0.05% (95% CI 0.01%, 0.09%); P = 0.009, after adjustment for relevant covariates including cell composition. The BPA-associated higher methylation of the brain promoter PI.f region remained evident when the window was expanded to 15 CpGs (mean increase = 0.06%, 95% CI [0.01%, 0.11%], P = 0.04). For PII, the BPA-associated mean methylation increase was 0.07%, 95% CI [-0.02%, 0.16%], P = 0.11). BPA also associated positively with methylation across both PI.f and PII as a composite, mean increase = 0.06% (95% CI 0.01%, 0.10%); P = 0.009. For the remainder of CYP19A1, excluding both PI.f and PII brain promoters, there was no significant association, P = 0.12. Higher CYP19A1 brain promoter methylation leads to reduced transcription. All statistical tests are two sided. Source data are provided as a Source Data file.
Fig. 3
Fig. 3. Bisphenol A (BPA) exposure reduces levels of aromatase.
A Western Blot (1 representative blot) demonstrates that increasing BPA concentrations reduced immunoblotted aromatase protein signals (green fluorescence, 55 kDa) in lysates from human-derived neuroblastoma SH-SY5Y cells. Each sample was normalized to its internal house keeping protein β-Actin (red fluorescence, 42 kDa). B Aromatase immunoblotted signals in SH-SY5Y cells treated with vehicle or BPA (n = 3 independent experiments/group). Five-day BPA treatment of SH-SY5Y cells leads to a significant reduction in aromatase following 50 mg/L(MD = 89, t(6) = 4.0, P = 0.01) and 100 mg/L (MD = 85, t(6) = 3.9, P = 0.01) BPA treatment, compared to vehicle. C BPA treatment (50 µg/kg/day) of Cyp19-EGFP mice at E10.5-E14.5 results in fewer EGFP+ neurons in the medial amygdala (MD = -5334, t(4) = 5.9, P = 0.004) compared to vehicle mice, n = 3 mice per treatment. Independent t-tests were used and where there were more than two experimental groups (B), P-values were corrected for multiple comparisons using Holm-Sidak. All statistical tests were two-sided. Plots show mean ± SEM. Source data are in a Source Data file. Note: UT = untreated.
Fig. 4
Fig. 4. Male BPA-exposed mice and aromatase knockout (ArKO) mice have sociability deficits and increased grooming behavior.
Sociability is the higher proportion of time spent in the stranger interaction zone compared to the empty interaction zone. In the three chamber social interaction test (A) BPA-exposed mice (n = 30, MD = 75 s, t(96) = 3.7 P = 0.0004) spent less time investigating the stranger mouse as compared with male control (n = 21) mice. B Male ArKO (n = 8, MD = 43 s, t(30) = 2.3, P = 0.03) mice also spent less time with the stranger compared to male WT littermates (n = 9). C A schematic of the 3-Chamber Sociability Trial. Created with BioRender.com. D Male BPA-exposed mice (n = 12, MD = 8.2, U = 11, P = 0.048.) spent more time grooming compared to control (n = 5) mice. There were no differences between female BPA-exposed (n = 9) and female control (n = 6) mice. Independent t-tests were used P-values were corrected for multiple comparisons using Holm-Sidak. For (C), a Mann–Whitney U test was used. All statistical tests were two-sided. Plots show mean ± SEM. Source data are in a Source Data file. Note: Veh = vehicle.
Fig. 5
Fig. 5. Medial amygdala (MeA) cell alterations in male BPA-exposed and ArKO mice.
A Golgi staining showed shorter apical and basal dendrites in male BPA-exposed (apical: n = 27β = −136μm, 95% CI [−189, −83], P = 6.0 × 10⁻⁷; basal: n = 27 neurons β =-106, 95% CI [−147, −64], P = 5.1 × 10⁻⁷) and ArKO mice (apical: n = 27 β = −194, 95% CI [−258, −130], P = 2.9 × 10⁻⁹; basal: n = 27, β = −121, 95% CI [−143, −100], P = 1.2 × 10⁻²⁹) compared to male vehicle (apical n = 27, basal n = 27) or WT (apical n = 27, basal n = 29). Female BPA-exposed mice had longer basal dendrites vs. vehicle (n = 26 neurons/group, β = 133, 95% CI [76, 191], P = 5.5 × 10⁻⁶), while female ArKO mice had shorter basal dendrites vs. WT (n = 22 neurons/group, β = −45, 95% CI [−91, −0.2], P = 0.049). Significant sex-by-BPA-treatment interaction effects were observed for apical (P = 0.0002) and basal (P = 3.0 × 10⁻¹¹) dendritic lengths, and a sex-by-genotype interaction for basal length (P = 0.003) but not apical length (P = 0.19). B Golgi staining showed male BPA-exposed (apical: n = 39, β = −7.0, 95% CI [−10.1, −4.0], P = 5.5 × 10⁻⁶; basal: n = 90, β = −3.4, 95% CI [−5.7, −1.1], P = 0.004) and ArKO (apical: n = 51, β = −6.8, 95% CI [−12.2, −1.3], P = 0.01; basal: n = 97, β = −3.8, 95% CI [−5.4, −2.2], P = 5.2 × 10⁻⁶) mice had lower spine densities on apical and basal dendrites vs. vehicle (apical n = 46, basal n = 106) or WT (apical n = 53, basal n = 109) mice. Female mice exhibited no spine density differences for BPA exposure (apical n = 74, basal n = 106) vs. vehicle (apical n = 61, basal n = 103) and ArKO (apical n = 94, basal n = 86) vs. WT (apical n = 88, basal n = 83). There was a significant sex-by-BPA-treatment interaction for apical spine density (P = 0.0005) but not basal (P = 0.99), and no significant sex-by-genotype interactions (apical: P = 0.08; basal: P = 0.19). For golgi staining experiments, 3 mice/group with 6–9 neuron measures/mouse. Spine count datapoints represent the number of spines on a single 10μm concentric circle. C c-Fos fluorescent immunostaining in adult male PD-MeA revealed fewer c-Fos+ve cells in BPA-exposed (n = 3) vs. vehicle mice (n = 3; mean difference MD = 3687, t(4) = 16.12, P < 0.0001) and ArKO (n = 4) vs. WT mice (n = 4; MD = −10237; t(4) = 6.48, P = 0.0002). Early postnatal estradiol restored ArKO c-Fos to WT levels (n = 4; MD = −3112; t(4) = 1.97, P = 0.08). D Microelectrode array electrophysiology showed a lower rate of change in EPSP over 1-4 volts in male BPA-exposed mice (n = 5 mice, n = 11 slices) vs. vehicle (n = 7 mice, n = 12 slices; P = 0.02). Generalized estimating equations were used clustering by mouse (A, B) or voltage input (D) and assuming an exchangeable correlation structure. For (C), independent t-tests were used and where there were more than two experimental groups (ArKO analysis), P-values were corrected for multiple comparisons using Holm–Sidak. All statistical tests were two-sided. Plots show mean ± SEM. Source data are in a Source Data file.
Fig. 6
Fig. 6. Altered structure and function of cortex in male BPA-exposed and ArKO mice.
A Golgi staining showed shorter apical and basal dendrites in male BPA-exposed (apical: n = 36, β =-350μm, 95% CI [−679, −20], P = 0.04; basal: n = 36, β = −217, 95% CI [−315, −119], P = 1.4 × 10⁻⁵) and ArKO mice (apical: n = 35, β = −541.9, 95% CI [−666, −417], P = 1.3 × 10⁻¹⁷; basal: n = 35, β = −163, 95% CI [−308, −17], P = 0.02) compared to male vehicle (apical n = 35, basal n = 36) or WT(apical n = 36, basal n = 36). B Golgi staining showed male BPA-exposed (apical: n = 186, β = −4.7, 95% CI [−9.2, −0.2], P = 0.04; basal: n = 40 β = −6.7, 95% CI [−16, 2.8], P = 0.17) and ArKO (apical: n = 148 β = −4.4, 95% CI [−7.7, −1.0], P = 0.01; basal: n = 51 β = −5.2, 95% CI [−14.4, 4.1], P = 0.27) mice had lower spine densities on apical but not on basal dendrites vs. vehicle (apical n = 189, basal n = 56) or WT mice (apical n = 185, basal n = 55). For golgi staining experiments, 3 mice/group with 9–12 neuron measures/mouse. Spine count datapoints represents the number of spines on a single 10 μm concentric circle. C Representative photomicrographs of golgi stained cortical neurons, scale bar is 100μm. D Electrocorticograms (ECoG) revealed an increased in the average spectral power at 8 Hz in BPA-exposed (n = 4; *a 8 Hz MD = −0.5; t(325) = 3.4 P = 0.01) mice and (E) 4–6 Hz in ArKO mice (n = 4; *b 4 Hz MD = −0.2; t(120) = 4.3, P = 0.0006; *c 5 Hz MD = −0.2, t(120) = 6.1, P < 0.0001; *d 6 Hz MD = −0.2, t(120) = 5.2 P < 0.0001) vs. vehicle (n = 7) or WT (n = 4)mice. Generalized estimating equations were used clustering by mouse (Panels A, B) and assuming an exchangeable correlation structure. For (D) and(E) Independent t test were used used, P-values were corrected for multiple comparisons using Holm-Sidak. All statistical tests were two-sided. Plots show mean ± SEM. Source data are in a Source Data file.
Fig. 7
Fig. 7. Molecular docking of E2, BPA and 10HDA with estrogen receptor β.
In silico molecular docking analysis of estrogen receptor β (ERβ, Protein Data Bank (PDB) ID: 1YYE; encoded by the ES gene) using the DockThor platform, showing binding predictions for (A) the native ligand 17β-estradiol (E2), (B) bisphenol A (BPA), (C) Trans-10-hydroxy-2-decenoic acid (10HDA), and (D) E2 and BPA (left) and E2 and 10HDA (right) superimposed for spatial alignment comparison. While the molecular affinities of BPA and 10HDA for Erβ were comparable (−9.2 vs. −7.9, respectively), 10HDA aligns better with the binding conformation of the endogenous ligand E2, which activates the receptor. BPA is previously reported as sub-optimally estrogenic— >1000-fold less compared to natural estradiol,—whereas 10HDA has an estrogenic role in nature,. Thus, 10HDA may compensate for E2 deficiency caused by a reduction in aromatase enzyme, and in competition with binding by BPA. Please see Supplementary Movie 1 for a video of the above molecular docking of ERβ with E2 superimposed with BPA and Supplementary Movie 2 for the above molecular docking of ERβ with E2 superimposed with 10HDA.
Fig. 8
Fig. 8. BPA-exposed male cortical neurons and 10HDA exposure in vitro.
A Representative photomicrographs of primary cultures of embryonic (ED15.5) mouse cortical neurons, red staining is βIII tubulin and green is aromatase. Scale bar is 100μm. B Compared to the BPA group, the vehicle group (β = 79.9, 95% CI [36, 124], P = 0.0004) and BPA + 10HDA group (β = 174, 95% CI [102, 247], P = 2.4 × 10⁻⁷) have significantly longer neurites. The BPA + 10HDA group (β = 94, 95% CI [8, 180], P = 0.03) has longer neurites compared to the vehicle group, and there is no difference between the vehicle and 10HDA groups. C Compared to the BPA group, the vehicle group(β = 16, 95% CI [11, 21], P = 1.7 × 10⁻⁸) and BPA + 10HDA group (β = 30, 95% CI [21, 40], P = 8.4 × 10⁻¹⁰) have significantly higher spine densities. The BPA + 10HDA group (β = 14, 95% CI [4, 24], P = 0.006) has a higher spine density compared to the vehicle group, and there is no difference between the vehicle and 10HDA groups. n = 10 neurons/group. Primary cortical cell culture was obtained from 12 male mouse embryoes. Spine count datapoints represent the number of spines on a single 10μm concentric circle. Generalized estimating equations were used clustering by mouse and assuming an exchangeable correlation structure. All statistical tests were two-sided. Plots show mean ± SEM. Source data are in a Source Data file.
Fig. 9
Fig. 9. Social approach and excitatory postsynaptic potential deficits are ameliorated by postnatal 10HDA.
A 10HDA treatments increased social approach in males (n = 10/group, MD = 41.14, U = 11, P = 0.03,) but not females (n = 8/group), compared to saline controls. After 3 months of treatment withdrawal (B), male mice (saline n = 8, 10HDA n = 7) no longer spent more time interacting with strangers, compared to vehicle treatment. C When male mice (n = 8/group) were subsequently treated with a second round of 10HDA, social approach behavior was once again significantly elevated (MD = 39.2, U = 5, P = 0.003), indicative of a rescue of this behavioral effect. D Compared to the WT Saline (n = 10) group (β = 57.1, 95% CI [47.4, 66.8]), EPSP increases at a 21% lower rate with increasing input in the ArKO Saline (n = 14) group (β = 45.1 μV, 95% CI [40.1, 50.1], P = 0.03). No differences in slope were detected when comparing the WT Saline group with each of the other two treatment (WT n = 18, KO n = 12) groups. Mann–Whitney U tests were used and for (D), Generalized estimating equations were used clustering by voltage input (D) and assuming an exchangeable correlation structure. All statistical tests were two-sided. Plots show mean ± SEM. Source data are in a Source Data file. Note: Sal = saline, w/d = withdrawal.
Fig. 10
Fig. 10. Synaptogenesis pathway signaling, and growth of neurites are downregulated by BPA and upregulated by 10HDA.
The Canonical pathways and Disease and Function—Brain pathway databases were selected in Ingenuity. Several key signaling pathways and brain functions were downregulated (Z-score less than zero) by BPA and also upregulated (Z-score greater than zero) by 10HDA. 10HDA downregulated four brain disorder related pathways—hyperactive behavior, seizures, seizure disorder and behavioral deficit. Colored boxes indicate significant (P < 0.05, Fisher’s Exact Test with Benjamani-hochberg) changes in z-score. Boxes shaded in gray indicate non-significant gene expression changes (P = 0.05 or greater). Source data are provided as a Source Data file.

References

    1. American Psychiatric Association aAPAD-TF. Diagnostic and Statistical Manual of Mental Disorders: DSM-5 (American Psychiatric Association, 2013).
    1. Maenner, M. et al. Prevalence of autism spectrum disorder among children aged 8 years—autism and developmental disabilities monitoring network, 11 sites, United States, 2016. MMWR Surveill. Summ.69, 1–12 (2020). 10.15585/mmwr.ss6904a1 - DOI - PMC - PubMed
    1. Li, Q. et al. Prevalence of autism spectrum disorder among children and adolescents in the United States From 2019 to 2020. JAMA Pediatrics176, 943–945 (2022). 10.1001/jamapediatrics.2022.1846 - DOI - PMC - PubMed
    1. Atladottir, H. O. et al. The increasing prevalence of reported diagnoses of childhood psychiatric disorders: a descriptive multinational comparison. Eur. Child Adolesc. Psychiatry24, 173–183 (2015). 10.1007/s00787-014-0553-8 - DOI - PubMed
    1. Lai, M.-C. & Lombardo, M. V. Baron-Cohen S. autism. Lancet383, 896–910 (2014). 10.1016/S0140-6736(13)61539-1 - DOI - PubMed

MeSH terms