. 2024 Aug 7;14(1):128.
doi: 10.1038/s41408-024-01111-w.

Identification of genetic subtypes in follicular lymphoma

Affiliations

Identification of genetic subtypes in follicular lymphoma

Victoria Shelton et al. Blood Cancer J. .

Abstract

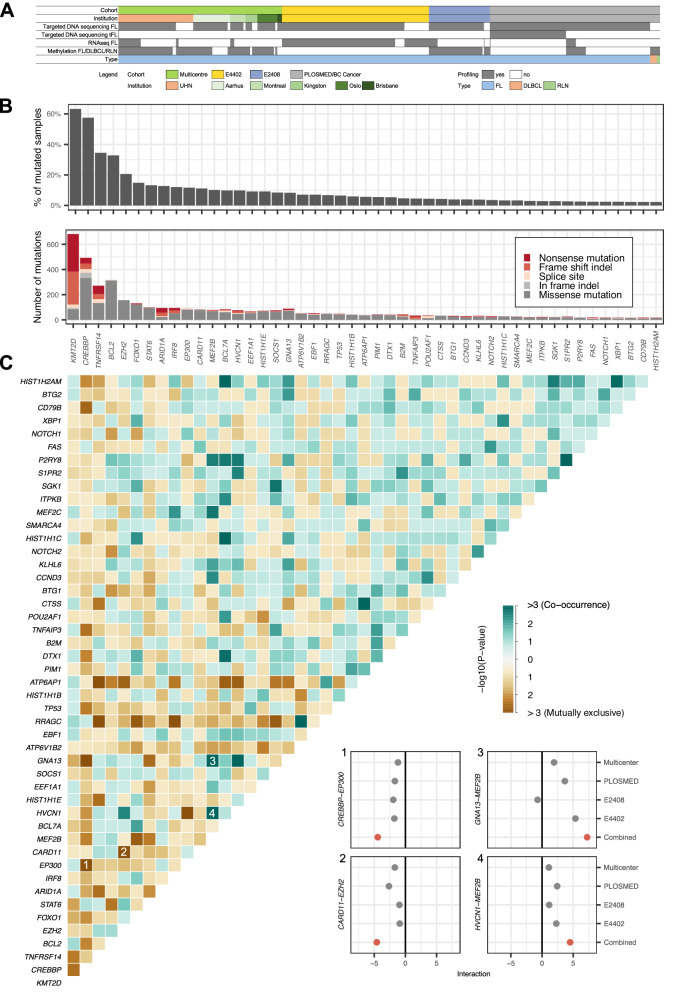
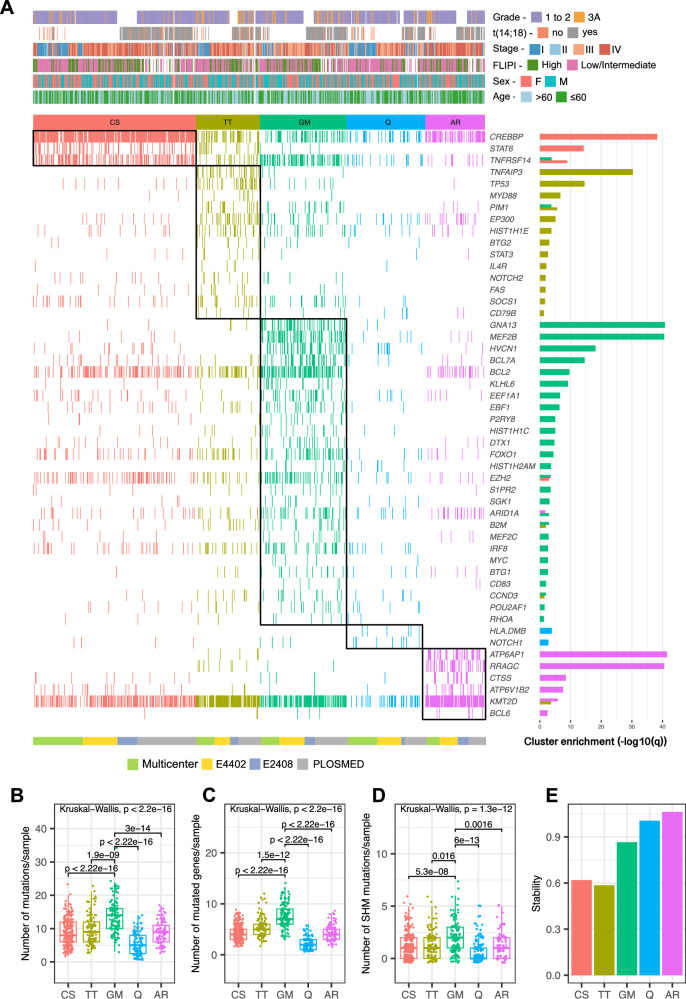
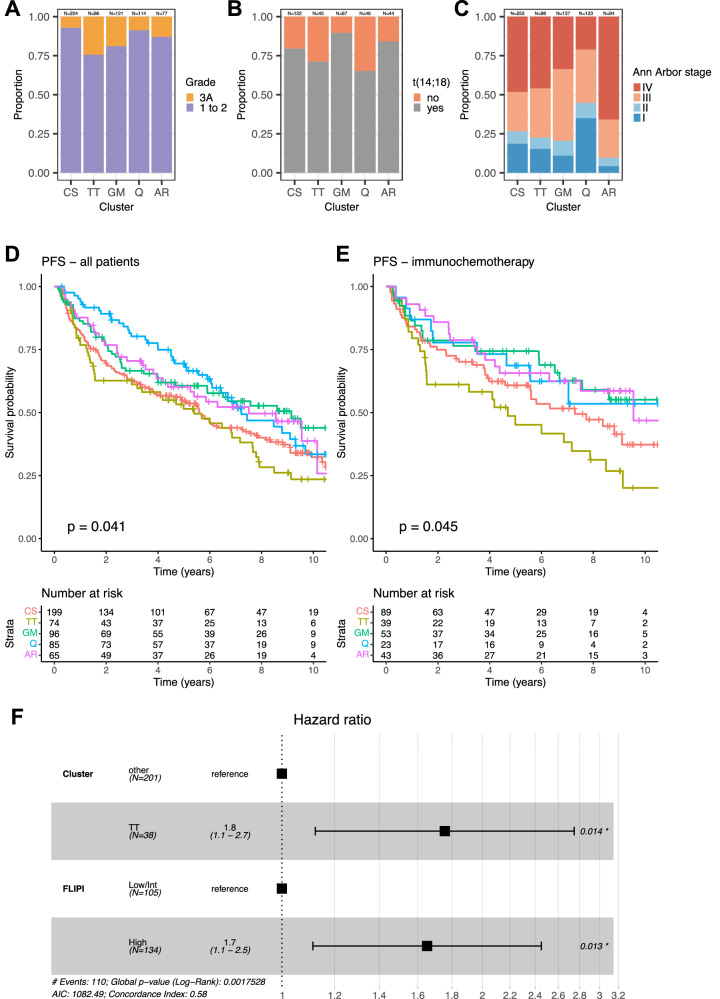
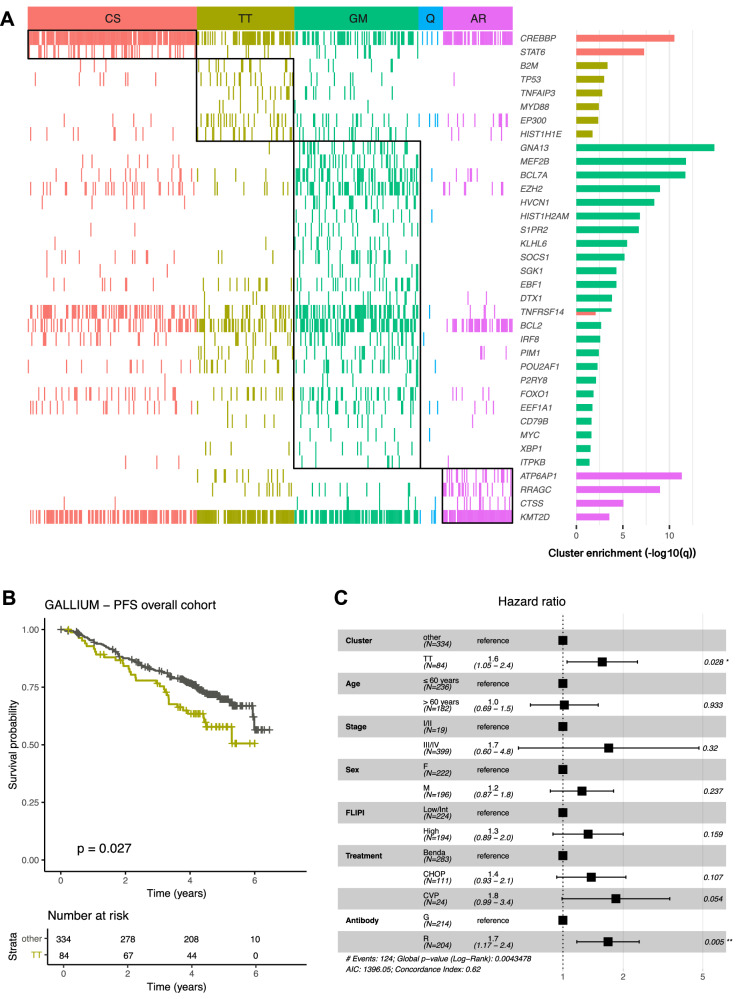
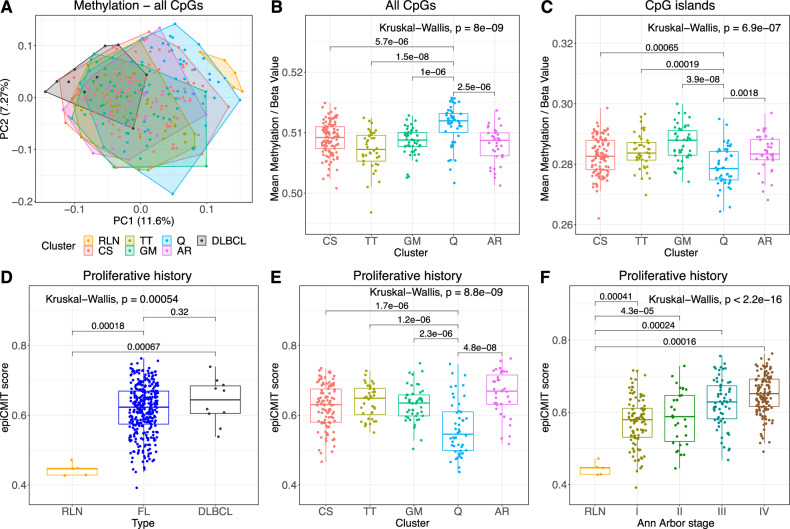
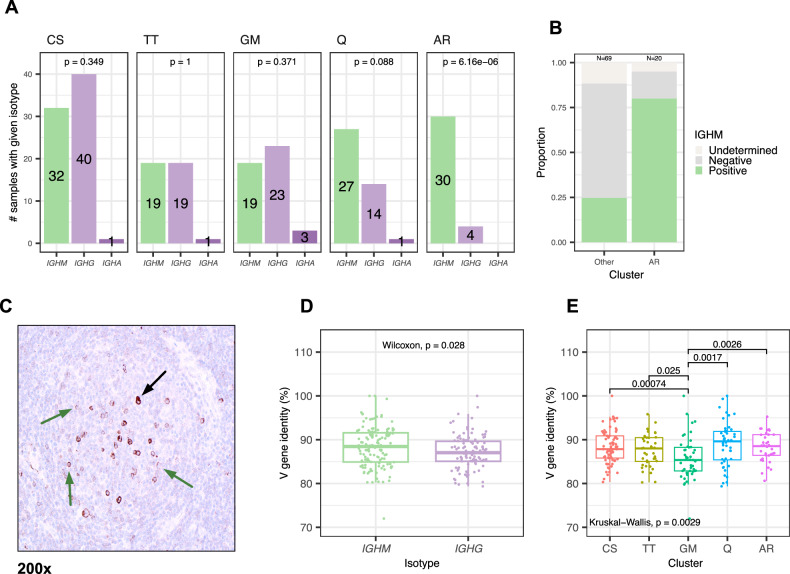
Follicular lymphoma (FL) exhibits considerable variability in biological features and clinical trajectories across patients. To dissect the diversity of FL, we utilized a Bernoulli mixture model to identify genetic subtypes in 713 pre-treatment tumor tissue samples. Our analysis revealed the existence of five subtypes with unique genetic profiles that correlated with clinicopathological characteristics. The clusters were enriched in specific mutations as follows: CS (CREBBP and STAT6), TT (TNFAIP3 and TP53), GM (GNA13 and MEF2B), Q (quiescent, for low mutation burden), and AR (mutations of mTOR pathway-related genes). The subtype Q was enriched for patients with stage I disease and associated with a lower proliferative history than the other subtypes. The AR subtype was unique in its enrichment for IgM-expressing FL cases and was associated with advanced-stage and more than 4 nodal sites. The existence of subtypes was validated in an independent cohort of 418 samples from the GALLIUM trial. Notably, patients assigned to the TT subtype consistently experienced inferior progression-free survival when treated with immunochemotherapy. Our findings offer insight into core pathways distinctly linked with each FL cluster and are expected to be informative in the era of targeted therapies.


Conflict of interest statement

The authors declare no competing interests.

Figures

Fig. 1
Fig. 1. Study overview and pre-analysis of genetic variants gathered from 57 targeted genes.
A Overview of the sources of samples used for this study and genomic profiling performed: tFL transformed FL, DLBCL diffuse large B-cell lymphoma, RLN reactive lymph node. B The percentage of FL samples with genetic variants in the targeted genes and the number of mutations per gene, ordered from the most to least abundant representation within the total cohort. The color legend indicates the variant type. C Heat map of genetic variant co-occurrence and mutual exclusivity across the 57 targeted genes in FL. Negative log10 p-values of each somatic interaction are indicated by the intensity of color. The most significantly scoring genetic variant interactions are highlighted across the four cohorts and combined total.
Fig. 2
Fig. 2. Heat map of distinguishing genetic variation of the five genetic clusters that were determined via Akaike information criterion (n = 713).
A Subtypes are specified by color. Black perimeter boxes indicate genetic variation aggregates that most confidently contribute to cluster characterization. The right-hand bar plot shows the enrichment for genetic variants within each cluster, with a logarithmic q-value scale. Of 57 targeted genes, only those listed were identified as significantly enriched for the given group, as determined by Benjamini-Hochberg adjusted q < 0.05 from a X2 test of independence. The horizontal bars located above the clustering graph indicate the distribution of samples according to grade, BCL2 translocation status, stage, FLIPI, sex, and age, across each cluster group (where white strokes denote the absence of information). The bottom legend shows the distribution of samples from each of the four sample cohorts. BD Boxplots of the number of mutations, number of mutated genes, and number of mutations consistent with somatic hyper-mutation, per sample per genetic subtype. The Kruskal-Wallis derived p-value is shown for each analysis. E The relational stability score of each subtype is shown in the bar plot.
Fig. 3
Fig. 3. Relation between the genetic subtypes and clinico-pathological attributes.
AC Proportion of samples with FL grade 1 to 2 and 3 A, t(14;18) translocation status, and Ann Arbor stage I to IV. D, E. Progression-free survival (PFS) of 519 patients in the overall cohort regardless of treatment and 247 patients treated with immunochemotherapy, stratified by cluster (Log-rank p = 0.041 and 0.045, respectively). F Cox multivariable regression analysis for progression-free survival (PFS) in 239 patients treated with immunochemotherapy. The plot visually represents the impact of TT cluster assignment and the FLIPI on the hazard of experiencing a PFS event. The positioning of the squares relative to the vertical line shows the directional association of the hazard ratio.
Fig. 4
Fig. 4. Genetic subtypes over the course of histological transformation.
A, B AIC subtype assignment of samples at initial collection (FL) and after transformation (tFL), for patients with time to transformation occurring earlier than 2.97 years (n = 57), and patients with time to transformation occurring at or succeeding 2.97 years (n = 59). Color corresponds to AIC subtype assignment at initial collection. C Time to transformation given in years determined by Kaplan–Meier analysis, n = 116. Stratified according to whether patients had an identical (n = 55, salmon color) or dissimilar (n = 61, teal) FL and tFL genetic subtype assignment, Log-rank p = 0.0014.
Fig. 5
Fig. 5. Validation of the genetic subtypes in an external dataset.
A Enrichment of gene mutations in genetic subtypes predicted in the GALLIUM trial (n = 418 patients). B Progression-free survival of the TT genetic subtype compared to the other genetic subtypes (CS, GM, Q, and AR) in the GALLIUM trial. C Multivariable Cox regression analysis incorporating clinical risk factors as well as treatment characteristics (chemotherapy backbone and anti-CD20 antibody).
Fig. 6
Fig. 6. DNA methylation patterns.
A Principal component analysis (PCA) considering methylation profiling of total genome-wide CpGs across 343 samples of reactive lymph node samples (RLN, n = 5), follicular lymphoma (FL, n = 328), and diffuse large B-cell lymphoma (DLBCL, n = 10). B, C Distribution of mean methylation for all CpGs and for CpG islands. DF Distribution of total relative proliferative history of B-cells by tumor type, FL subtype, and Ann Arbor stage.
Fig. 7
Fig. 7. Immunoglobulin variable and constant heavy chain analysis by genetic subtype.
A The expression of heavy chain isotypes was inferred using TRUST4 and available for 233 cases with genetic subtype assignment. Comparisons were assessed via two-sided exact binomial tests. B Proportion of cases expressing IGHM, as detected by immunohistochemistry. Cases with undetermined IGHM expression were included. C Follicular lymphoma expressing IGHM. The centrocyte-like follicular lymphoma cells within the nodule, as well as small lymphoma cells in the extranodular area variably display expression of IGHM. Strong cytoplasmic expression of IGHM is seen in a subset of small and large centroblast-like cells within the nodule (peroxidase immunohistochemistry, magnification 200×). D Percent identity of V gene from dominant immunoglobulin sequences, comparing FL cases expressing IGHM versus IGHG. E Percent identity of V gene from dominant immunoglobulin sequences, comparing FL subtypes.

References

    1. Anderson JR, Armitage JO, Weisenburger DD. Epidemiology of the non-Hodgkin’s lymphomas: distributions of the major subtypes differ by geographic locations. Non-Hodgkin’s Lymphoma Classification Project. Ann Oncol. 1998;9:717–20. 10.1023/A:1008265532487 - DOI - PubMed
    1. Casulo C, Byrtek M, Dawson KL, Zhou X, Farber CM, Flowers CR, et al. Early relapse of follicular lymphoma after rituximab plus cyclophosphamide, doxorubicin, vincristine, and prednisone defines patients at high risk for death: an analysis from the National LymphoCare Study. J Clin Oncol. 2015;33:2516–22. 10.1200/JCO.2014.59.7534 - DOI - PMC - PubMed
    1. Mozessohn L, Cheung MC, Crump M, Buckstein R, Berinstein N, Imrie K, et al. Chemoimmunotherapy resistant follicular lymphoma: predictors of resistance, association with transformation and prognosis. Leuk Lymphoma. 2014;55:2502–7. 10.3109/10428194.2014.885513 - DOI - PubMed
    1. Freeman CL, Kridel R, Moccia AA, Savage KJ, Villa DR, Scott DW, et al. Early progression after bendamustine-rituximab is associated with high risk of transformation in advanced stage follicular lymphoma. Blood. 2019;134:761–4. 10.1182/blood.2019000258 - DOI - PubMed
    1. Casulo C, Dixon JG, Le-Rademacher J, Hoster E, Hochster HS, Hiddemann W, et al. Validation of POD24 as a robust early clinical end point of poor survival in FL from 5225 patients on 13 clinical trials. Blood. 2022;139:1684–93. 10.1182/blood.2020010263 - DOI - PMC - PubMed

Publication types

Substances

LinkOut - more resources