. 2024 Aug 7;15(1):6718.
doi: 10.1038/s41467-024-50993-8.

Skin hepcidin initiates psoriasiform skin inflammation via Fe-driven hyperproliferation and neutrophil recruitment

Affiliations

Skin hepcidin initiates psoriasiform skin inflammation via Fe-driven hyperproliferation and neutrophil recruitment

Elise Abboud et al. Nat Commun. .

Abstract

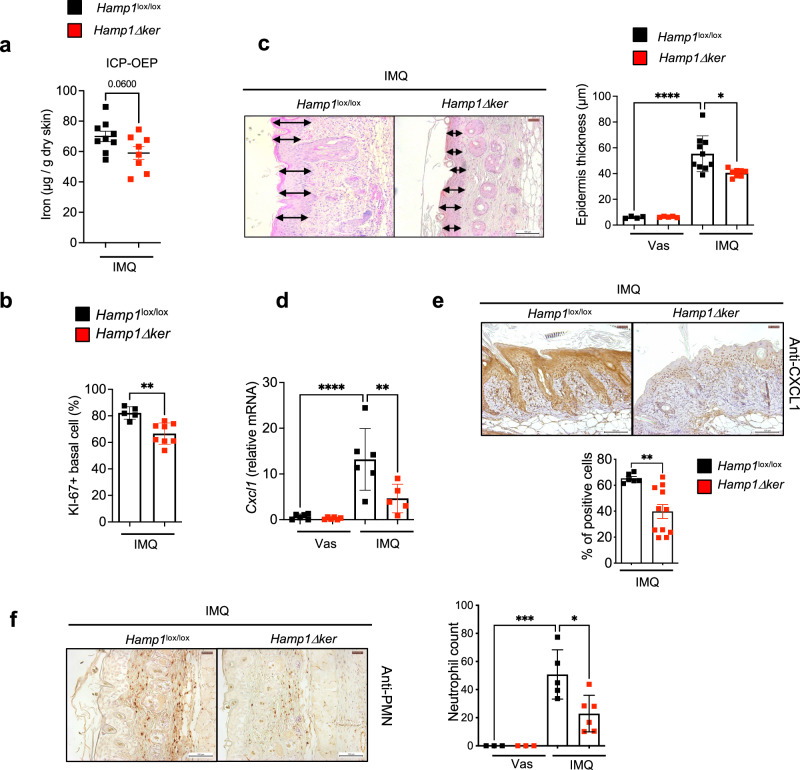
Psoriasis is a multifactorial, chronic inflammatory skin disease with unresolved questions on its primary events. Iron overload has been described in the epidermis of psoriasis patients, but its relevance remains unknown. We found that the key iron regulatory hormone hepcidin was highly expressed in the epidermis of psoriasis patients, especially the pustular variants resistant to treatments. In a murine model of acute skin inflammation, keratinocyte-derived hepcidin was required for iron retention in keratinocytes, leading to hyperproliferation of the epidermal layer and neutrophil recruitment, two main features of psoriatic skin lesions. Keratinocytes overexpressing hepcidin were sufficient to elicit these psoriasiform features in a transgenic mouse model. Furthermore, transcriptome analysis of these keratinocytes revealed canonical pathways found in human psoriasis, pointing to a causal role for hepcidin in the pathogenesis of the disease. Altogether, our data suggest that hepcidin could be an actionable target for skin psoriasis treatment, in addition to current therapeutics, or targeted as maintenance therapy during remission to prevent recurrence.


Conflict of interest statement

The authors declare no competing interests.

Figures

Fig. 1
Fig. 1. Analysis of hepcidin expression in psoriasis patients.
a Representative IHC (from n = 14 healthy controls; n = 24 psoriasis vulgaris patients; n = 14 pustular proriasis patients) with or without primary antibody detecting hepcidin, ferroportin (in brown) on sections of cutaneous human biopsies of psoriasis patients and healthy controls. The bar represents 100 μm. Leica DMI3000B microscope; Leica LAS Core software. b Correlation between hepcidin expression (quantified by Image J) and epidermis thickness. Spearman’s r test with 95% confidence intervals. c Hepcidin expression measured by Real-time reverse transcription PCR (qPCR) in the skin of pustular patients (characteristics in supplementary table 2; red dot: IL36RN mutation, blue dots: AP1S3 mutation, green dots: CARD14 mutation, black dots: no mutations identified in IL36RN, CARD14, AP1S3, MPO, SERPINA; n = 3 healthy controls, n = 12 pustular patients (Data are means ± SEM. Two-sided Mann–Whitney test; *p = 0.0176). Source data are provided as a Source Data file.
Fig. 2
Fig. 2. Increase in skin hepcidin and skin iron levels in the IMQ-induced skin inflammation model.
a Protocol of the IMQ-induced skin inflammation model. b Hepcidin expression measured by qPCR in the skin of IMQ and Vas-treated WT mice (n ≥ 3 mice per group); 24 h vs 6 h:*p = 0.042; 48 h vs 6 h: *p = 0.0324; 96 h vs 6 h: *p = 0.0398 or (c) by ELISA in skin biopsies from IMQ and Vas-treated WT mice (n ≥ 3 mice per group); 24 h vs Vas: **p = 0.0026; 48 h vs Vas: ****p < 0.0001; 24 h vs 3 h: *p = 0.0147; 48 h vs 3 h: ***p = 0.0005; 24 h vs 6 h: *p = 0.0460; 48 h vs 6 h: **p = 0.0014; 96 h vs 24 h: **p = 0.0058; 96 h vs 48 h: ***p = 0.0002. d FPN IHC on the skin of IMQ- or Vas-treated WT mice for 48 h. Scale bar = 100 μm. Representative IHC (n = 5 vas-treated mice and n = 4 IMQ-treated mice). e Hepcidin expression measured by qPCR in the skin of mice with daily intradermal injection of IL-36a (n ≥ 4 mice per group); ****p < 0.0001. f Iron measurement by Inductively Coupled Plasma-Optical Emission Spectrometry (ICP-OEP) in the epidermis of IMQ- or Vas-treated WT mice (n ≥ 4 mice per group); 96 h vs Vas: ***p = 0.0001; 96 h vs 3 h: ***p = 0.0001; 96 h vs 6 h: ***p = 0.0002; 96 h vs 24 h: *p = 0.0428; 96 h vs 48 h: *p = 0.0447. g Image of In situ Iron mapping by secondary ion mass spectrometry (SIMS) of skin biopsies from IMQ and Vas-treated WT mice (n = 2 mice per group). Images of CN- ion and PO2- ion allow the identification of cellular str‡uctures. They are used to define the region of interest (ROI). (n = 18 ROI for Vas; n = 24 ROI for IMQ); ****p < 0.0001. Scale bar = 10 μm. FeO- intensity readout for individual nucleus on defined ROIs (yellow circles). Data are means ± SEM. Source data are provided as a Source Data file.
Fig. 3
Fig. 3. Hepcidin controls intracellular iron levels of keratinocytes.
a Exponentially growing Normal Human Keratinocytes were treated with (green curve) or without (black curve) 100 μM DFO for 48 h (n = 3 biological replicates); ****p < 0.0001. b Morphological study of 3 DED-Raft made from matched primary human keratinocytes and fibroblasts KCP7 and FCP7, respectively treated or not with 100 μM DFO for 72 h following haematoxylin and Eosin staining. Scale bar = 200 μm. c Calcein fluorescence quenching assay in Normal Human Keratinocytes incubated or not (black curve) with Ferric Ammonium Citrate (FAC) (500 μM) ± synthetic hepcidin (3,6 μM) (blue/red curve), for measurement of the labile iron pool. n ≥ 3 biological replicates. ****p < 0.0001; *p = 0.0138. d Left: Representative MTT proliferation assay analysis in NHEK cells, incubated or not (black dots) with FAC ± synthetic hepcidin (blue/red dots). n ≥ 3 biological replicates. ****p = 0.0005; *p = 0.0157. Right: Ratio of KI67-positive cells in NHEK cells incubated with or without (black dots) FAC ± synthetic hepcidin (blue/red dots). Digital images of the immunocyto chemistry-stained slides were acquired using a Widefield Olympus BX63 microscope, and KI-67-positive cells were quantified using the automated software QuPath. Each dot represents the measurement taken from one microscopic slide. (n ≥ 3 biological replicates). ****p = 0.0002; FAC vs -: *p = 0.0305; FAC+hepcidin vs FAC: *p = 0.0430. e MTT proliferation assay analysis in NHEK cells, incubated with DMSO (CTRL: black) with or without Vamifeport ± FAC (resuspended in DMSO) (blue/red/green dots); n = 3 biological replicates. Vamifeport vs CTRL: ***p = 0.0009; FAC vs CTRL: ***p = 0.0002; FAC+Vamifeport vs control: ****p < 0.0001. Data are means ± SEM. Data were analyzed by a one-way Analysis of Variance followed by a Tukey analysis (d), (e), a two-way Analysis of Variance followed by a Tukey analysis (a), (c). Source data are provided as a Source Data file.
Fig. 4
Fig. 4. Targeting hepcidin decreases iron-driven hyperproliferation and neutrophil infiltration.
a Iron measurement by ICP-OEP in the epidermis of Hamp1lox/lox and Hamp1∆ker mice treated with IMQ for 5 days. n ≥ 7 mice per group; p = 0.06. b Percentage of Ki-67+ cells in epidermal basal cells, quantified in skin sections of Hamp1lox/lox and Hamp1∆ker mice treated with IMQ for 5 days; n ≥ 5 mice per group; **p = 0.0025. c Representative H&E staining and epidermis thickness measurement of Hamp1lox/lox and Hamp1∆ker mice treated with IMQ or Vas for 5 days. n ≥ 4 mice per group; ****p < 0.0001, **p = 0.0106. Scale bar = 100 μm. d Cxcl1 expression measured by qPCR. n ≥ 5 mice per group; ****p < 0.0001, **p = 0.0082. e Representative CXCL1 IHC (n ≥ 4 mice per group) in the skin of Hamp1lox/lox and Hamp1∆ker mice treated with IMQ or Vas for 5 days. Scale bar = 100 μm. Quantification of IHC staining analysis by « ImageJ plugin IHC profiler ». Each dot represents the mean of three measurements taken from one microscopic slide. n ≥ 6 mice per group; **p = 0.0037. f Representative PMN IHC (n ≥ 3 mice per group) on skin biopsies of IMQ-treated Hamp1lox/lox and Hamp1∆ker mice for 5 days and neutrophil count (n ≥ 3 mice per group). ***p = 0.0006; **p = 0.0180. Scale bar = 100 μm (c), (e), (f). Data were analyzed by unpaired two-tailed Student t test (a), (b), (e), a one-way Analysis of Variance followed by a Tukey analysis (c), (d), (f). Hamp1lox/lox are represented by black dots and Hamp1∆ker mice by red dots. Source data are provided as a Source Data file. Pool of three independent experiments. Data are means ± SEM.
Fig. 5
Fig. 5. Keratinocyte-derived hepcidin contributes to psoriasis pathogenesis.
a Scheme of the knock-in strategy. b Photography of Hamp1 KI-Ker (top) and control littermate. c Hepcidin expression measured by Q-PCR or ELISA in the skin of male and female Hamp1 KI-Ker and control littermates. N ≥ 3 mice per group; ****p < 0.0001; **p = 0.0015. (d) Iron measurement by ICP-OEP in the epidermis of Hamp1 KI-Ker and WT littermates. N≥ 3 mice per group; *p = 0.0361. (e) Percentage of Ki-67+ cells in epidermal basal cells, quantified in skin sections of Hamp1 KI-Ker and control littermates. N ≥ 5 mice per group; *p = 0.0348. f H&E staining (representative of n ≥ 5 mice per group) and epidermis thickness measurement of Hamp1 KI-Ker and control littermates. N ≥ 5 mice per group; ***p = 0.0006. Cxcl1 expression evaluated by Q-PCR; N ≥ 5 mice per group; **p = 0.0011 (g) or IHC (representative of n ≥ 5 mice per group) (h) in the skin of Hamp1 KI-Ker and control littermates. Quantification of IHC staining analysis by « ImageJ plugin IHC profiler » Each dot represents the mean of 3 measurements taken from one microscopic slide. n ≥ 5 mice per group; *p = 0.0415. i Representative PMN IHC on the skin of Hamp1 KI-Ker and control littermate (N ≥ 5 mice per group). Scale bar = 100 μm (f), (h), (i). Data were analyzed by unpaired two-tailed Student’s t test (ch). Data are means ± SEM. Hamp1CMV lox-STOP-lox are represented by black dots and Hamp1 KI-Ker mice by blue dots. 3-week-old female and male (cf. source data) mice were used. Source data are provided as a Source Data file. Pool of three independent experiments.
Fig. 6
Fig. 6. RNA sequencing (RNA-seq) and GSEA analysis in the skin of Hamp1 KI-Ker mice and control littermates.
a GSEA plots showing a significant enrichment (p.val = 0.00) of involved genes among upregulated transcripts in Hamp1 KI-Ker samples compared to controls. b Venn diagram comparing differentially expressed genes (DEGs) identified by RNA-seq and those identified involved in psoriasis. Overlap associated with a significant overlap p-value: 6.9E-10 (1.51E-7 after Benjamini-Hochberg adjustment) and a significant z-score: 2.251. c Analysis match between curated IPA analyses and the DEG identified in RNA-seq (overall Z-score). n = 75 analyses (psoriasis vs normal) and n = 45 (post-treated vs pre-treated psoriasis). Data were analyzed by two-sided weighted Kolmogorov–Smirnov test with Benjamini–Hochberg adjustment (a), and One-sided Fisher Exact test with Benjamini–Hochberg adjustment (c). Source data are provided as a Source Data file.

References

    1. Griffiths, C. E. M., Armstrong, A. W., Gudjonsson, J. E. & Barker, J. N. W. N. Psoriasis. Lancet397, 1301–1315 (2021). 10.1016/S0140-6736(20)32549-6 - DOI - PubMed
    1. Uppala, R. et al. Autoinflammatory psoriasis’-genetics and biology of pustular psoriasis. Cell. Mol. Immunol.18, 307–317 (2021). 10.1038/s41423-020-0519-3 - DOI - PMC - PubMed
    1. Onoufriadis, A. et al. Mutations in IL36RN/IL1F5 are associated with the severe episodic inflammatory skin disease known as generalized pustular psoriasis. Am. J. Hum. Genet.89, 432–437 (2011). 10.1016/j.ajhg.2011.07.022 - DOI - PMC - PubMed
    1. Bachelez, H. Pustular psoriasis: the dawn of a new era. Acta Derm. Venereol.100, adv00034 (2020). 10.2340/00015555-3388 - DOI - PMC - PubMed
    1. Zhou, X., Chen, Y., Cui, L., Shi, Y. & Guo, C. Advances in the pathogenesis of psoriasis: from keratinocyte perspective. Cell Death Dis.13, 81 (2022). 10.1038/s41419-022-04523-3 - DOI - PMC - PubMed

MeSH terms