. 2024 Aug 7;15(1):6726.
doi: 10.1038/s41467-024-51142-x.

The neonatal Fc receptor (FcRn) is a pan-arterivirus receptor

Affiliations

The neonatal Fc receptor (FcRn) is a pan-arterivirus receptor

Teressa M Shaw et al. Nat Commun. .

Abstract

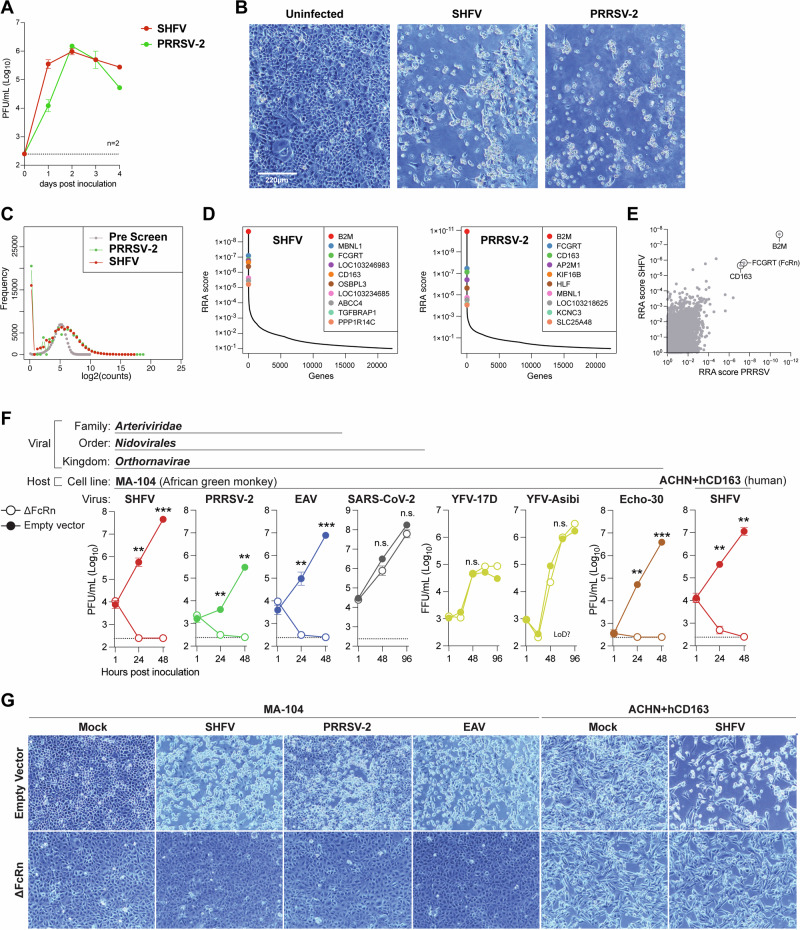
Arteriviruses infect a variety of mammalian hosts, but the receptors used by these viruses to enter cells are poorly understood. We identified the neonatal Fc receptor (FcRn) as an important pro-viral host factor via comparative genome-wide CRISPR-knockout screens with multiple arteriviruses. Using a panel of cell lines and divergent arteriviruses, we demonstrate that FcRn is required for the entry step of arterivirus infection and serves as a molecular barrier to arterivirus cross-species infection. We also show that FcRn synergizes with another known arterivirus entry factor, CD163, to mediate arterivirus entry. Overexpression of FcRn and CD163 sensitizes non-permissive cells to infection and enables the culture of fastidious arteriviruses. Treatment of multiple cell lines with a pre-clinical anti-FcRn monoclonal antibody blocked infection and rescued cells from arterivirus-induced death. Altogether, this study identifies FcRn as a novel pan-arterivirus receptor, with implications for arterivirus emergence, cross-species infection, and host-directed pan-arterivirus countermeasure development.


Conflict of interest statement

The authors declare no competing interests.

Figures

Fig. 1
Fig. 1. FcRn is a pro-arteriviral host factor.
A Growth of SHFV and PRRSV-2 in wild-type MA-104 cells, inoculated at MOI = 0.01 (n = 2 biological replicates). Data shows representative results from one of two independent experiments. B Cytopathic effect (CPE) of arterivirus infection of MA-104 cells at 4 days post-inoculation, taken at ×100 magnification. Data shows representative results from one of two independent experiments. C Frequency of sgRNAs, as determined via deep sequencing of genomic DNA from MA-104 cells, prior to and after infection with arteriviruses. D Robust rank aggregation scores (RRA) scores for gene knockouts enriched in surviving MA-104 cells compared to pre-infection; top 10 hits for each screen are shown as colored datapoints. E RRA scores of SHFV vs. PRRSV-2, with CD163, FCGRT (FcRn), and B2M circled and labeled. F Infection of cells transduced with single-guide RNA targeting grivet (for MA-104) or human (for ACHN) FCGRT (ΔFcRn), or empty vector control. Viruses tested on these cells are arranged in terms of relatedness to arteriviruses from left to right, with taxonomic relationships shown along the top. Data are presented as mean values ± SEM. Infections were performed with n = 3 biological replicates at an MOI of 0.01. Supernatant was titrated via plaque assay or focus-forming assay at the indicated time points; asterisks represent p-values (**p ≤ 0.01; ***p ≤ 0.001) derived from a two-tailed unpaired t-test with Welch correction and multiple comparisons testing. G Brightfield photographs of arterivirus infections from F taken at ×100 magnification at 3 days post-inoculation. Data shows representative results from one of two independent experiments. Source data are provided as a Source Data file.
Fig. 2
Fig. 2. Transcomplementation of FcRn restores arterivirus infectivity in FcRn-knockout cells.
A Western blot of wild-type (WT) MA-104 cells or MA-104ΔFcRn cells transcomplemented with grivet FcRn (gFcRn) or empty vector (EV). B Cytopathic effect in MA-104 cells from A, 24 hrs post-inoculation with SHFV at an MOI of 0.3. C Fluorescence in situ hybridization flow cytometry (FISH-Flow) targeting the SHFV ORF1a and hybridized to an ATTO-663 probe in the same cell types shown in A, 24 h after inoculation with SHFV at an MOI of 0.3. All flow-cytometric events were first gated on FSC x SSC properties, followed by singlet discrimination. All gates were drawn based on mock-infected cells. D Graphical representation of cells in C with data presented as mean values ± SEM, n = 3 biological replicates, one-way ANOVA,****p ≤ 0.0001. E Percent of cells positive for SHFV viral RNA (vRNA) by RNA FISH-Flow at early time points following inoculation with SHFV at an MOI of 10 (n = 3 biological replicates). Source data are provided as a Source Data file.
Fig. 3
Fig. 3. FcRn is involved in the entry step of the arterivirus life cycle.
A Transfection of a cDNA-launch SHFV rescue plasmid into wild-type (WT) and ΔFcRn MA-104 cells as a means of bypassing viral entry. Production of infectious virus in cell supernatant was quantified by plaque assay at various time points post-transfection (n = 3 biological replicates). All plots include error bars; no error bars are shown when the SEM was smaller than the size of the symbols. B Comparison of SHFV infectious virus production from cells either transfected with SHFV cDNA-launch clone or infected with virus (MOI = 0.01), 48 hrs after transfection/infection; n = 3 biological replicates per group with error bars showing SEM; statistical significance was determined using an two-tailed unpaired t-test with ** representing P < 0.01. C Wildtype, FcRn knockout (ΔFcRn), or ΔFcRn complemented with grivet FcRn (gFcRn) MA-104 cells were evaluated for SHFV internalization (MOI = 10) by SHFV-specific RT-qPCR-based internalization assay. The extent of internalization is shown as fold from wild-type control (mean ± SD, n = 3 biological replicates). Data shown is representative of three independent experiments. Significance determined by one-way ANOVA with multiple comparisons, **p ≤ 0.01; ***p ≤ 0.001. D Wild-type MA-104 cells were incubated with orilanolimab (open circles) or isotype control (IgG4,k, solid circles) at the indicated concentration (n = 2 biological replicates) in serum free media for 1 hr at 4 °C. Cells were then infected with SHFV (MOI 0.1) and incubated at 37 °C for an additional 24 hrs, followed by plaque assay. Error bars show SEM. E Production of SHFV RNA in cell-culture supernatant for wells containing no cells (grey) wild-type MA-104 cells, ACHN+hCD163 cells, or macaque iPSC-derived macrophages incubated with 80 μg/mL orilanolimab (open circles) or isotype control (closed circles). Wells were inoculated with an MOI = 0.1 and RNA extraction was performed 24 hrs after inoculation on n = 2 biological replicates. Significance determined by unpaired t-test, ***p ≤ 0.001; ****p ≤ 0.0001. F, G Production of KRCV-1 (purple) or PBJV (yellow) RNA in cell-culture supernatant for wells containing no cells (grey) or macaque iPSC-derived macrophages incubated with 80 μg/mL orilanolimab (open circles) or isotype control (closed circles). Wells were inoculated with KRCV-1 or PBJV and RNA extraction was performed 24 hrs after inoculation on n = 2 biological replicates. Significance determined by ANOVA with correction for multiple comparison testing, **p ≤ 0.01; ***p ≤ 0.001; ****p ≤ 0.0001. H Cytopathic effect and identification of infected cells via mCherry-expressing SHFV reporter-virus in uninfected cells, wild-type MA-104 cells, ACHN+hCD163 cells, or macaque iPSC-derived macrophages, incubated with 80 μg/mL orilanolimab or isotype control, imaged 24 hrs after inoculation with SHFV (MOI = 0.1). Data shows results from one experiment. I Viability, as determined by an ATP-based luminescence assay, of mac iPSC-macs inoculated 24 hrs prior with SHFV, KRCV-1, or PBJV in the presence of 80 μg/mL orilanolimab (open circles) or isotype control (closed circles), n = 2 biological replicates. Significance determined by unpaired t-test, *p ≤ 0.05; **p ≤ 0.01. Source data are provided as a Source Data file.
Fig. 4
Fig. 4. FcRn overexpression enhances arterivirus infection.
A Western blot showing gCD163 and gFcRn expression in wild-type (WT) MA-104 cells and MA-104 cells with ectopic expression of gCD163, gFcRn, or both. B Cells from A were infected with SHFV (MOI = 30) and assayed for intracellular SHFV RNA 4 h later using single molecule RNA fluorescence in situ hybridization (smRNA FISH). Confocal microscopy (×600 magnification) was used to capture 16–18 fields of view taken at random (one representative shown). Blue = nuclei; red = smFISH detecting viral (v)RNA, Scale bar = 25 μm. C Quantification of microscopy performed in B. From each field of view, the percent vRNA positive cells, average number of puncta per infected cell, and average puncta FISH intensity per infected cell were determined and graphed as independent points. Error bars represent the mean ± SEM. Data shows results from one experiment. D Time course of SHFV production from wild-type (WT) MA-104 cells (red) compared to dual-overexpressing gCD163/gFcRn cells (black) at a low (0.03, left) and high (3, right) MOI, n = 3 biological replicates. E Cytopathic effect of SHFV infection of wild-type (WT) MA-104 cells (red) compared to dual-overexpressing gCD163/gFcRn cells (black) at a low MOI (0.03) 24 hrs after inoculation. Data shows results from one representative experiment in D. F Photographs of plaque assay wells (6-well plate) fixed and stained with crystal violet 2 days after inoculation. Note the larger and more well-circumscribed plaques in the CD163/FcRn-dual-expressing cells. G Quantification of SHFV via plaque assay using MA-104 cells (WT, +gCD163, +gFcRn, or +gCD163 & +gFcRn) as substrate for infection with data presented as mean values ± SEM, n = 3 biological replicates, normalized to WT cells and analyzed using one-way ANOVA with multiple comparisons relative to WT cells: ns, not significant; ***p ≤ 0.001; ****p ≤ 0.0001. Source data are provided as a Source Data file.
Fig. 5
Fig. 5. CD163 overexpression does not compensate for the absence of FcRn.
A Western blot showing gCD163 and gFcRn expression in wild-type (WT) MA-104 cells, overexpression of gCD163 in MA-104ΔFcRn cells, and gFcRn overexpression in MA-104ΔCD163 cells. B Kinetics of SHFV production from cells in (A) after inoculation with SHFV, MOI of 3. Graph shows mean ± SEM from three independent experiments. All plots include error bars; no error bars are shown when the SEM was smaller than the size of the symbols. C Cells from A were infected with SHFV (MOI = 30) and assayed for intracellular SHFV RNA 4 h later using single molecule RNA  fluorescence in situ hybridization (smRNA FISH). Confocal microscopy (×600 magnification) was used to capture 17–21 fields of view taken at random. From each field of view, the percent viral RNA positive cells, average number of puncta per infected cell, and average puncta FISH intensity per infected cell were determined and graphed as independent points. Error bars represent the mean ± SEM. Note that data for the WT condition is the same as that shown in Fig. 4C. Data shows results from one experiment. Source data are provided as a Source Data file.
Fig. 6
Fig. 6. FcRn and CD163 synergize to sensitize non-susceptible cells to arterivirus infection.
A Western blot showing gCD163 and gFcRn expression in wild-type (WT) Vero cells and Vero cells ectopically expressing gCD163, gFcRn, or both. B Kinetics of SHFV production from cells in A after inoculation with SHFV, MOI of 0.03, n = 3 biological replicates, graph show mean ± SEM. All plots include error bars; no error bars are shown when the SEM was smaller than the size of the symbols. C Cytopathic effect of cells in B at 72 hrs post-inoculation (colors match those in B). Source data are provided as a Source Data file.
Fig. 7
Fig. 7. FcRn is a molecular barrier to arterivirus cross-species infection.
A FcRn orthologs from natural and potential arterivirus hosts—grivet (g), human (hu), mouse (m), pig (p), and horse (ho)–were introduced into MA-104ΔFcRn cells and inoculated with SHFV (red), PRRSV-2 (green), or EAV (blue) at an MOI of 0.01, n = 2 biological replicates. FcRn orthologs derived from the natural host of an arterivirus (i.e., positive control) are denoted by a black outline. Productive infection was then assessed via plaque assay of supernatant at 2 days post inoculation. B Similar experimental setup to A, except with CD163 orthologs in MA-104ΔCD163 cells. Source data are provided as a Source Data file.
Fig. 8
Fig. 8. FcRn/CD163-overexpressing cells can be used to isolate new arteriviruses.
A Growth kinetics of three simian arteriviruses, SHFV (red), KRCV-1 (purple), and PBJV (yellow), on wild-type MA-104 cells (open circle) versus MA-104 cells ectopically expressing gFcRn and gCD163. Data are presented as mean values ± SEM, MOI = 1, n = 3 biological replicates. Ct values are shown on a reverse axis, with the SHFV standard curve (in N-gene copies per mL) shown on the right Y-axis of the SHFV plot for comparison, along with the limit of detection (dashed line). B Cytopathic effect of these viruses on these cells at 6 days post inoculation. Data shows representative results from one of two independent experiments. C Plaques of KRCV-1 on MA-104+gFcRn+gCD163 cells. D Production of infectious KRCV-1 on MA-104+gFcRn+gCD163 cells, plaqued on MA-104+gFcRn+gCD163 cells 4 days post inoculation Data are presented as mean values ± SEM, n = 3 biological replicates. Significance was determined using an two-tailed unpaired t test, ***p ≤ 0.001.

References

    1. Fields virology. (Wolters Kluwer/Lippincott Williams & Wilkins Health, Philadelphia, PA, 2013).
    1. Shi, M. et al. The evolutionary history of vertebrate RNA viruses. Nature556, 197–202 (2018). 10.1038/s41586-018-0012-7 - DOI - PubMed
    1. Kuhn, J. H. et al. Reorganization and expansion of the nidoviral family Arteriviridae. Arch. Virol.161, 755–768 (2015). - PMC - PubMed
    1. Bailey, A. L. et al. Arteriviruses, pegiviruses, and lentiviruses are common among wild African monkeys. J. Virol.90, 6724–6737 (2016). 10.1128/JVI.00573-16 - DOI - PMC - PubMed
    1. Carossino, M. et al. Equine arteritis virus long-term persistence is orchestrated by CD8+ T lymphocyte transcription factors, inhibitory receptors, and the CXCL16/CXCR6 axis. PLoS Pathog.15, e1007950 (2019). 10.1371/journal.ppat.1007950 - DOI - PMC - PubMed

LinkOut - more resources