. 2024 Aug 7;7(1):206.
doi: 10.1038/s41746-024-01204-7.

A deep learning system for myopia onset prediction and intervention effectiveness evaluation in children

Affiliations

A deep learning system for myopia onset prediction and intervention effectiveness evaluation in children

Ziyi Qi et al. NPJ Digit Med. .

Abstract

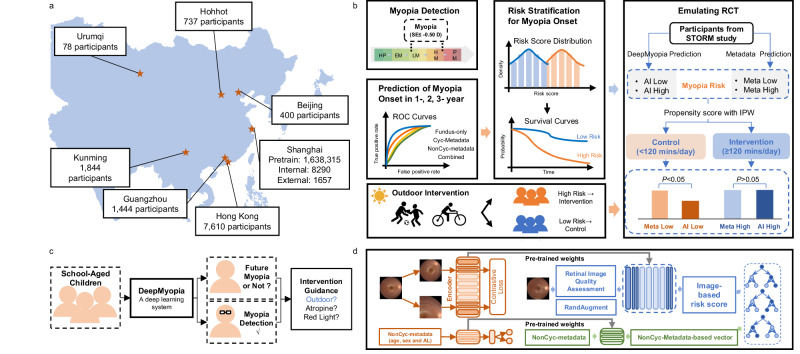
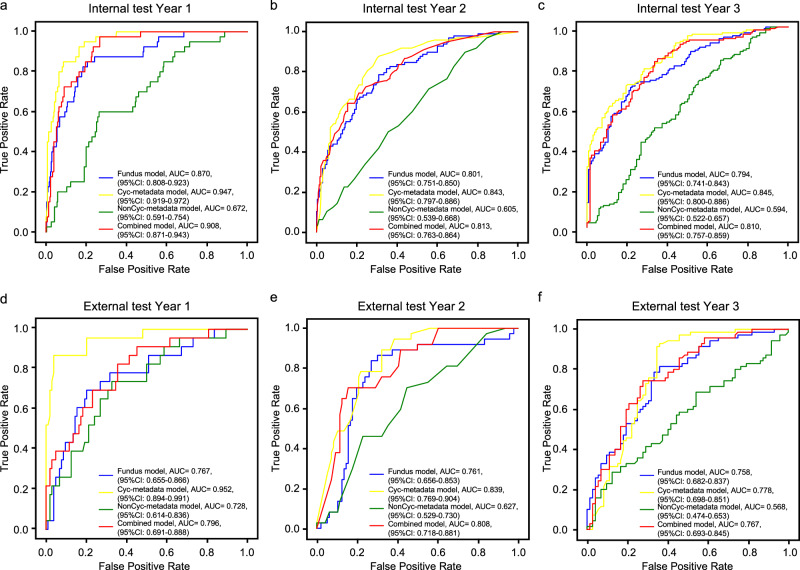
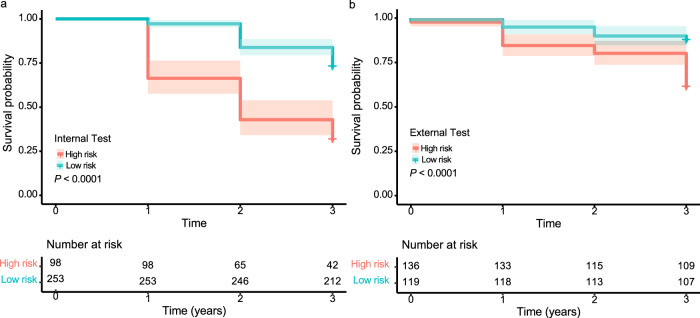
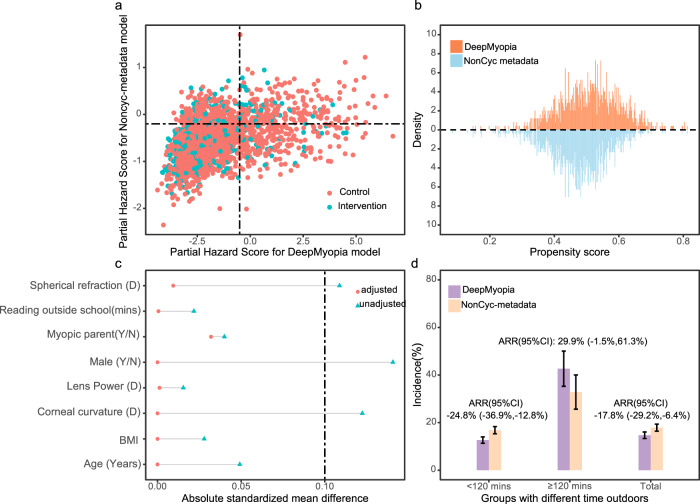
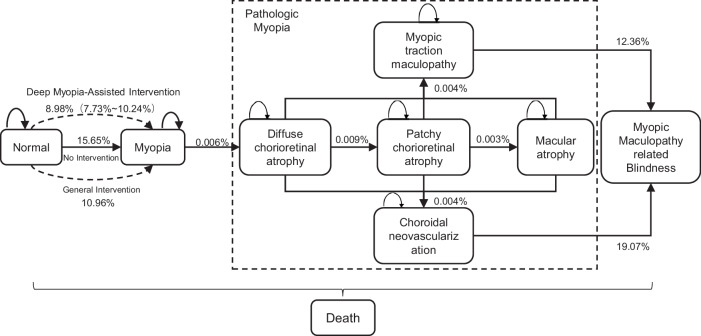
The increasing prevalence of myopia worldwide presents a significant public health challenge. A key strategy to combat myopia is with early detection and prediction in children as such examination allows for effective intervention using readily accessible imaging technique. To this end, we introduced DeepMyopia, an artificial intelligence (AI)-enabled decision support system to detect and predict myopia onset and facilitate targeted interventions for children at risk using routine retinal fundus images. Based on deep learning architecture, DeepMyopia had been trained and internally validated on a large cohort of retinal fundus images (n = 1,638,315) and then externally tested on datasets from seven sites in China (n = 22,060). Our results demonstrated robustness of DeepMyopia, with AUCs of 0.908, 0.813, and 0.810 for 1-, 2-, and 3-year myopia onset prediction with the internal test set, and AUCs of 0.796, 0.808, and 0.767 with the external test set. DeepMyopia also effectively stratified children into low- and high-risk groups (p < 0.001) in both test sets. In an emulated randomized controlled trial (eRCT) on the Shanghai outdoor cohort (n = 3303) where DeepMyopia showed effectiveness in myopia prevention compared to NonCyc-based model, with an adjusted relative reduction (ARR) of -17.8%, 95% CI: -29.4%, -6.4%. DeepMyopia-assisted interventions attained quality-adjusted life years (QALYs) of 0.75 (95% CI: 0.53, 1.04) per person and avoided blindness years of 13.54 (95% CI: 9.57, 18.83) per 1 million persons compared to natural lifestyle with no active intervention. Our findings demonstrated DeepMyopia as a reliable and efficient AI-based decision support system for intervention guidance for children.


Conflict of interest statement

The authors declare no competing interests.

Figures

Fig. 1
Fig. 1. Schematic overview of DeepMyopia.
a Dataset used in this study. b Evaluation and application of DeepMyopia. DeepMyopia enables myopia detection, myopia onset prediction within a 3-year timeframe, as well as risk stratification of myopia onset. An emulating randomized controlled trial (eRCT) was performed based on the risk stratification, extending the applicability of DeepMyopia in public health. c Application scenarios for DeepMyopia. DeepMyopia could identify myopic children among children population and predict the risk for the future myopia onset in non-myopic children, such that provided guided intervention. d The architecture of the proposed DeepMyopia. AL axial length.
Fig. 2
Fig. 2. Performance of four models to predict myopia onset at various time points.
The receiver operating characteristic (ROC) curves with the areas under the curve (AUCs) to depict the predictive performance for myopia onset across years 1 to 3. Year 1 (a), year 2 (b), year 3 (c) in the internal test set and in the external test set for year 1 (d), year 2 (e), year 3 (f). The fundus model utilized fundus images as input, while Cyc-metadata model incorporated age, sex, and SE from cycloplegic exams. NonCyc-metadata model included age, sex, and AL from non-cycloplegic examinations. The combined model integrated fundus images, age, sex, and AL.
Fig. 3
Fig. 3. Kaplan–Meier plots to predict myopia onset according to risk stratification.
Red and blue curves represent the survival probabilities of high and low risk groups respectively, and shaded areas represent 95% confidence intervals (CI). The number of individuals at risk at each time point is presented. The survival probability of DeepMyopia not becoming myopic in the internal longitudinal test set (a) and external longitudinal test set (b) over time progression. Statistical significance was tested using log-rank tests.
Fig. 4
Fig. 4. Emulating randomized controlled trial for DeepMyopia-assisted Intervention.
a The distribution of the partial hazard score over the control (orange) and the intervention (blue) groups, with the DeepMyopia in the horizontal axis and the NonCyc-metadata model in the vertical axis. b The distribution of estimated propensity scores over the DeepMyopia (orange) and the NonCyc-metadata model (blue), with the DeepMyopia above the dashed line and the NonCyc-metadata model below the dashed line. c The standardized mean differences (SMD) of the top eight well-balanced covariates. The dashed line indicates the threshold of balancing. d Incidence of myopia and adjusted relative reduction of myopia incidence within subgroups with different time outdoors between the DeepMyopia (purple) and NonCyc-metadata model (pink). The error bars represent 95% confidence intervals (CI).
Fig. 5
Fig. 5. Markov model for simulating the lifetime experience from normal to myopia, pathologic myopia, and myopic maculopathy-related blindness.
The transition probabilities indicated the incidence per year and the probabilities were retrieved from published literatures,,.
Fig. 6
Fig. 6. Explainability of myopia onset predictions.
Representative fundus images and their corresponding saliency maps for predicting myopia (a) and high myopia (b) onset. The images were from a participant who developed myopia (a) and (b) high myopia during the follow-up period. From left to right are the fundus images at the baseline, saliency map overlaid on the fundus images and follow-up images with developed myopia and high myopia. The color gradients used in the saliency maps indicate the degree of importance of the corresponding regions in the fundus image for prediction. Specifically, the regions with warmer colors indicate higher importance, while the cooler colors indicate lower importance. Zoomed view shows lesion areas, which align well with the saliency maps. SHAP-based model explainability is shown in (c), where each point represents a participant in the bee swarm plot. Different colors indicate the value of the feature, where red and blue represent high and low values, respectively. d Pie chart of the feature contributions, which was calculated by summing the SHAP values based on individual sets.

References

    1. World Health Organization. Vision impairment and blindness. https://www.who.int/news-room/fact-sheets/detail/blindness-and-visual-im... (2023).
    1. Ohno-Matsui, K., Lai, T. Y. Y., Lai, C.-C. & Cheung, C. M. G. Updates of pathologic myopia. Prog. Retin. Eye Res.52, 156–187 (2016). 10.1016/j.preteyeres.2015.12.001 - DOI - PubMed
    1. Han, X., Liu, C., Chen, Y. & He, M. Myopia prediction: a systematic review. Eye36, 921–929 (2022). 10.1038/s41433-021-01805-6 - DOI - PMC - PubMed
    1. Zadnik, K. et al. Prediction of juvenile-onset myopia. JAMA Ophthalmol.133, 683–689 (2015). 10.1001/jamaophthalmol.2015.0471 - DOI - PMC - PubMed
    1. Jones-Jordan, L. A. et al. Early childhood refractive error and parental history of myopia as predictors of myopia. Invest. Ophthalmol. Vis. Sci.51, 115–121 (2010). 10.1167/iovs.08-3210 - DOI - PMC - PubMed

LinkOut - more resources