. 2024 Aug 7;14(1):18298.
doi: 10.1038/s41598-024-69248-z.

A visual representation of the hand in the resting somatomotor regions of the human brain

Affiliations

A visual representation of the hand in the resting somatomotor regions of the human brain

Yara El Rassi et al. Sci Rep. .

Abstract

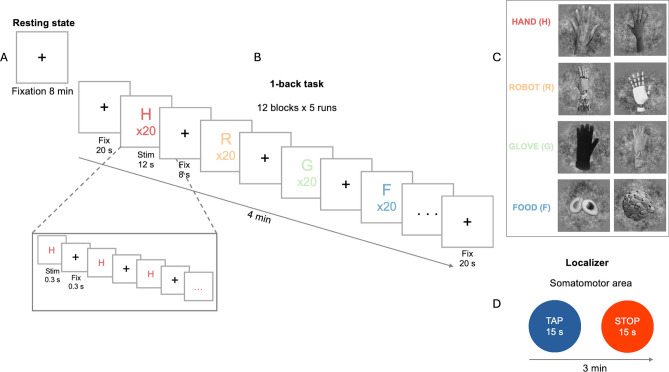
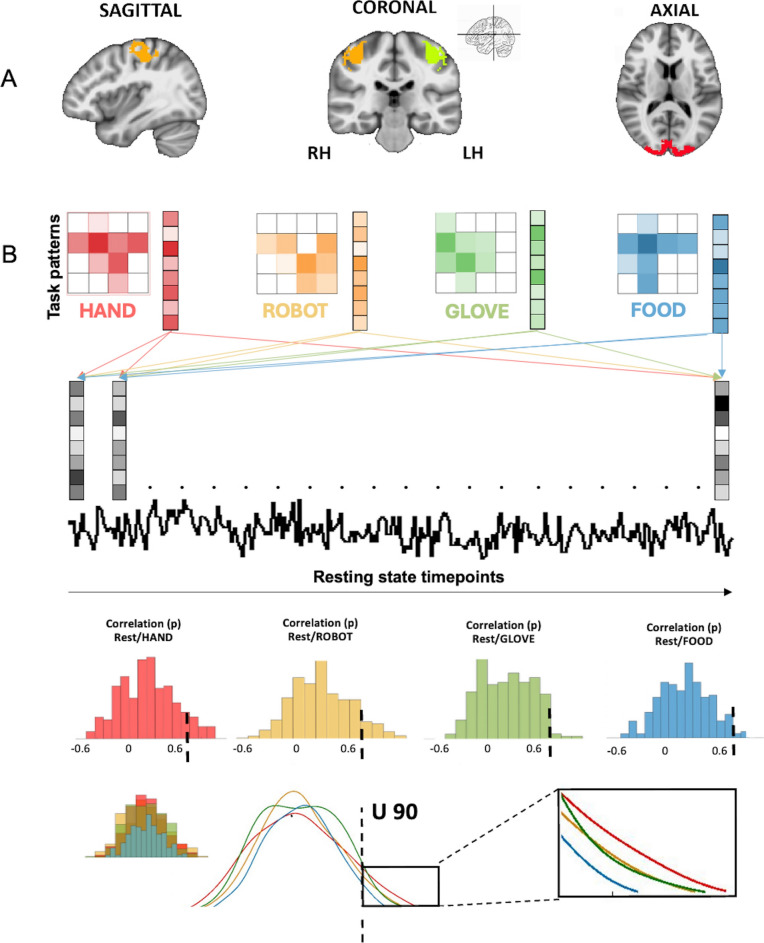
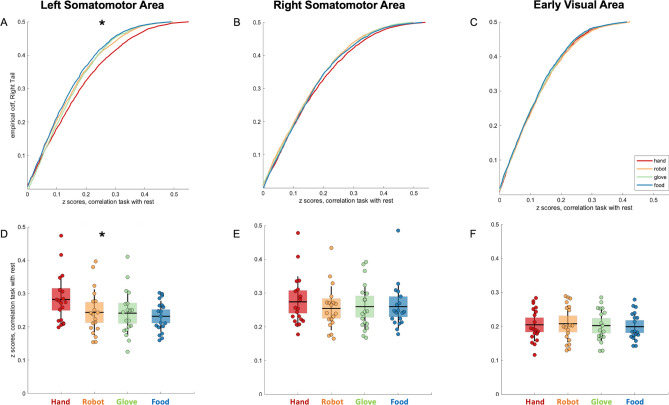
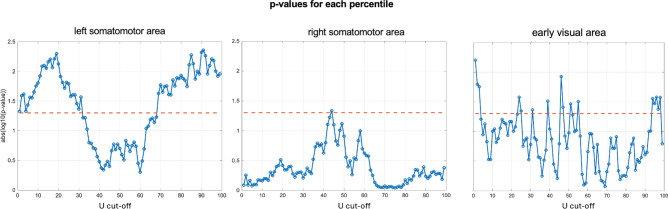
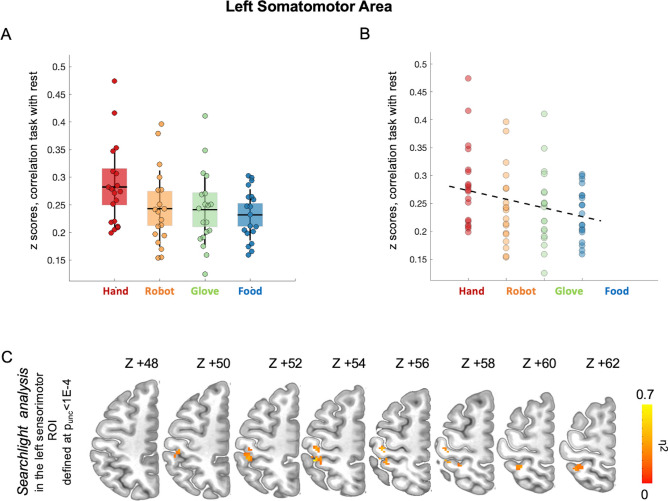
Hand visibility affects motor control, perception, and attention, as visual information is integrated into an internal model of somatomotor control. Spontaneous brain activity, i.e., at rest, in the absence of an active task, is correlated among somatomotor regions that are jointly activated during motor tasks. Recent studies suggest that spontaneous activity patterns not only replay task activation patterns but also maintain a model of the body's and environment's statistical regularities (priors), which may be used to predict upcoming behavior. Here, we test whether spontaneous activity in the human somatomotor cortex as measured using fMRI is modulated by visual stimuli that display hands vs. non-hand stimuli and by the use/action they represent. A multivariate pattern analysis was performed to examine the similarity between spontaneous activity patterns and task-evoked patterns to the presentation of natural hands, robot hands, gloves, or control stimuli (food). In the left somatomotor cortex, we observed a stronger (multivoxel) spatial correlation between resting state activity and natural hand picture patterns compared to other stimuli. No task-rest similarity was found in the visual cortex. Spontaneous activity patterns in somatomotor brain regions code for the visual representation of human hands and their use.

Keywords: Somatomotor area; Spontaneous activity; Task-evoked activity; fMRI.


Conflict of interest statement

The authors declare no competing interests.

Figures

Figure 1
Figure 1
fMRI experimental design and stimuli. (A) Before the task session, participants performed an 8 min resting state scan without performing any cognitive, motor, or sensory task; (B) In the task session, participants performed a covert working memory one-back task detecting the repetition of images depicting four stimulus categories (human hands, robot hands, gloves, and food) randomly selected and presented. The task consists of five runs, each lasting four minutes. Each run began and ended with 20 s of rest and consisted of 12 blocks. Each block lasted 12 s, followed by 8 s of fixation, and included 20 randomized repetitions of the six category stimuli (each presented for 0.3 s and followed by fixation for 0.3 s); (C) Representative figures of videos and static images used for the experiment. (D) Following the resting state (A) and visual stimulation sessions (B), participants performed a 3-min finger tapping task to localize the somatomotor regions (blocks of 15 s of activity -blue circle- followed by 15 s of rest -red circle).
Figure 2
Figure 2
(A) ROIs selection. We selected three regions of interest (ROIs) (LH: left hemisphere; RH: right hemisphere): left somatomotor area (orange) obtained from the finger tapping localizer task and resulting in an ROI (~ 5000 μL) encompassing the precentral and postcentral gyri; right somatomotor area (yellow), obtained by left/right flipping the ROI mentioned above; bilateral early visual cortex (V1, V2, V3) (in red) selected using a functional atlas of the visual cortex, as a further early sensory control region; (B) Task-rest multivoxel similarity analysis. For each subject and ROI, we extracted the patterns of task-evoked activity of the four stimulus categories (hand, robot, glove, food). Four averaged task-evoked vectors were computed, one for each category. A vector of the same length was computed for each resting state frame. Then, we correlated the z-scored multivoxel activity of task conditions with the patterns of all resting state timepoints. For each category group, we computed a cumulative distribution function that represents the strength of the correlation between the average multivoxel category representation and the patterns from every time point of the resting-state signal. Finally, we identified the upper 90% value of the distribution (U90 value) to measure task-rest similarity. The data presented here are simulated for illustrative purposes.
Figure 3
Figure 3
The empirical cumulative distribution functions (ECDFs) represent the correlation between rest and task category (hand/robot/glove/food) in the left somatomotor (A), right somatomotor (B), and early visual areas (C). (A) Using the KS statistic, the ANOVA shows that the distributions of correlation (red, yellow, green, blue) are significantly higher for the hand category (red distribution) in the left somatomotor area (F(3,54) = 4.194, p = .01, ηp2 = 0.189). The ANOVA does not show any significant effects for the (B) right somatomotor area (F(3,54) = 0.847, p = .47, ηp2 = 0.45) or (C) early visual area (F(3,54) = 1.133, p = .34, ηp2 = 0.059). (DEF). We further used the approach of, who used the upper 90% cutoff (U90) of the distribution of correlation values to measure task-rest multivoxel pattern similarity. The boxplots represent subjects’ U90 z-scored values for the four categories. Specifically, the y-axis shows the z scores at the 90th percentile cutoff of the correlation between task and rest in the multivoxel patterns analysis, and the x-axis shows the different category groups. Each dot represents a subject. Results are shown in the left somatomotor (D), right somatomotor (E), and early visual areas (F). In the right somatomotor hand region (E), and early visual areas (F), the ANOVA showed no significant main effect of conditions (right somatomotor hand region (F(3,54) = 0.664, p = .578, ηp2 = 0.036) early visual area (F(3,54) = 1.266, p = .295, ηp2 = .066). Instead, in the left somatomotor area (D), the ANOVA shows a similar significant main effect of visual categories (F(3,54) = 4.932, p = .004, ηp2 = 0.215), where the hand stimuli yielded the strongest rest-task similarity.
Figure 4
Figure 4
Absolute log-10 of the raw p values across all the tested cut-offs. The red dotted line represents the significance threshold at an uncorrected p = 0.05, and values above that line indicate cut-offs that resulted to be significant. In the left somatomotor area, we obtained significant effects at the extremes of the distribution (< 30th and > 70th percentiles), suggesting that the results were not dependent on the specific choice (e.g., U90).
Figure 5
Figure 5
(A) ANOVA: The x-axis shows the four categories, and the y-axis shows the z scores of the correlation between task and rest in the multivoxel patterns analysis. Each dot represents a subject. The ANOVA shows a significant main effect of visual categories (F(3,54) = 4.932, p = .004, ηp2 = 0.215); (B) The graph shows a significant linear trend (hand > robot > glove > food) (F(1,18) = 8.463, p = .009, ηp2 = .320). The x-axis shows the four categories, and the y-axis shows the z scores at the 90th percentile cutoff. Each dot represents a subject; (C) The searchlight analysis shows the task-rest association critically depends on the postcentral gyrus activity. We reported the significant voxels (uncorrected p value < 0.05) in orange.

Similar articles

Cited by

References

    1. Ernst, M. O. & Banks, M. S. Humans integrate visual and haptic information in a statistically optimal fashion. Nature415, 429–433 (2002). 10.1038/415429a - DOI - PubMed
    1. Penfield, W. & Boldrey, E. Somatic motor and sensory representation in the cerebral cortex of main as studied by electrical stimulation. Brain60, 389–443 (1937).10.1093/brain/60.4.389 - DOI
    1. Merzenich, M. M., Kaas, J. H., Sur, M. & Lin, C. Double representation of the body surface within cytoarchitectonic area 3b and 1 in “SI” in the owl monkey (aotus trivirgatus). J. Comp. Neurol.181, 41–73 (1978). 10.1002/cne.901810104 - DOI - PubMed
    1. Rizzolatti, G. & Luppino, G. The cortical motor system. Neuron31, 889–901 (2001). 10.1016/S0896-6273(01)00423-8 - DOI - PubMed
    1. Schieber, M. H. Constraints on somatotopic organization in the primary motor cortex. J. Neurophysiol.86, 2125–2143 (2001). 10.1152/jn.2001.86.5.2125 - DOI - PubMed

LinkOut - more resources