. 2024 Sep;25(9):1593-1606.
doi: 10.1038/s41590-024-01915-9. Epub 2024 Aug 7.

Age-related epithelial defects limit thymic function and regeneration

Affiliations

Age-related epithelial defects limit thymic function and regeneration

Anastasia I Kousa et al. Nat Immunol. 2024 Sep.

Abstract

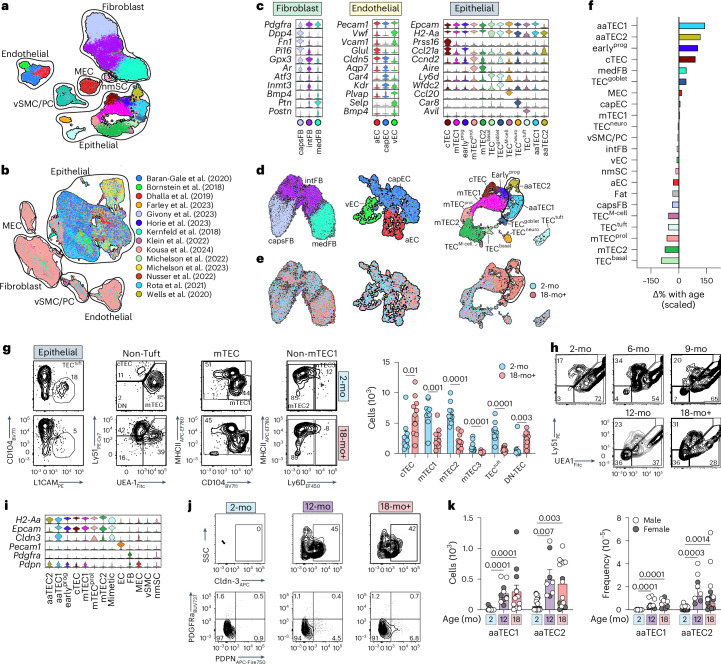
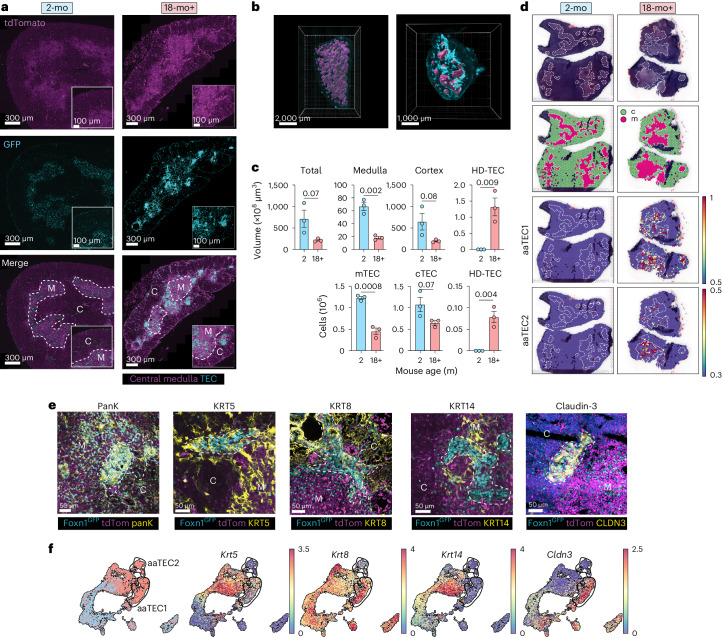
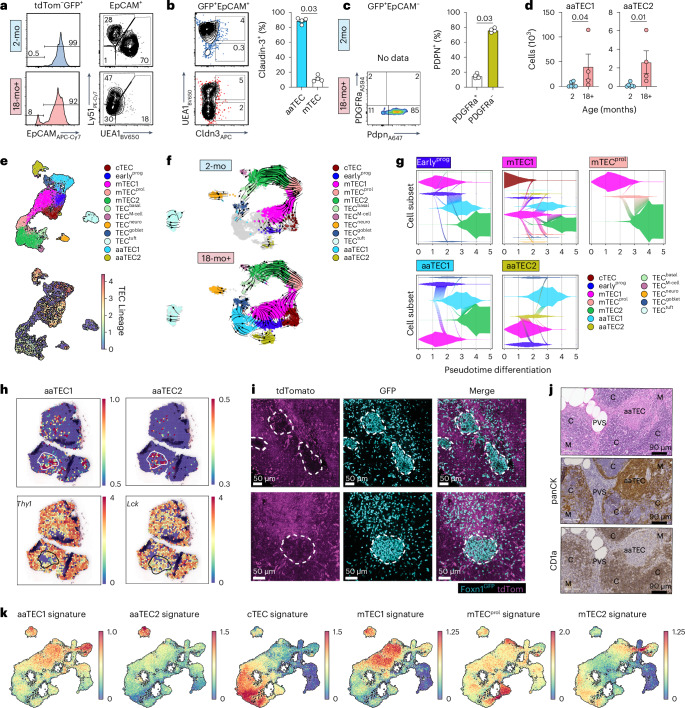
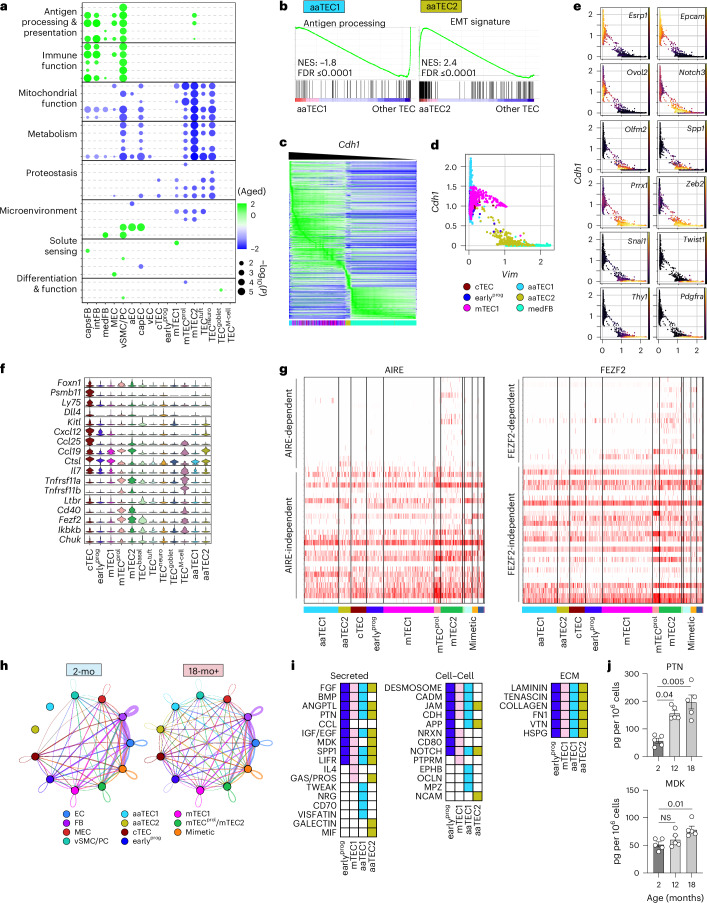
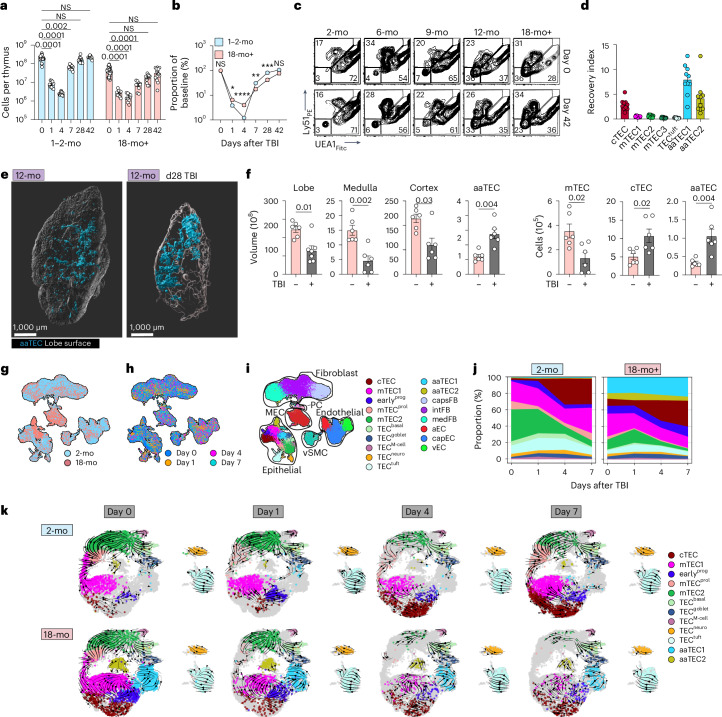
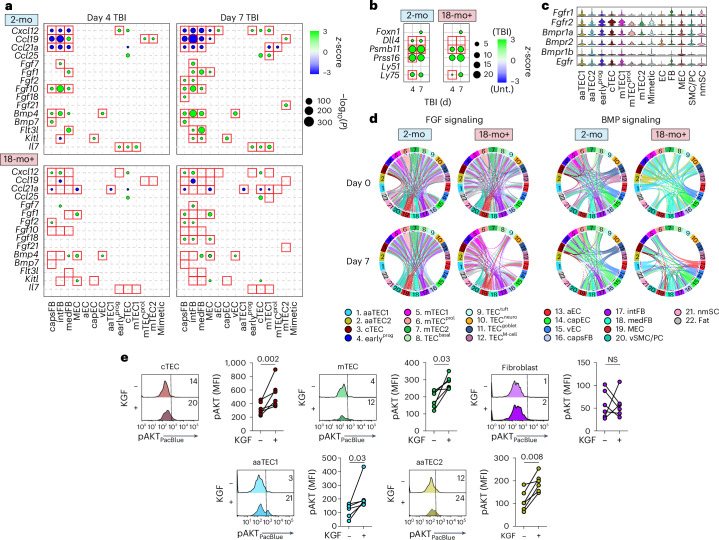
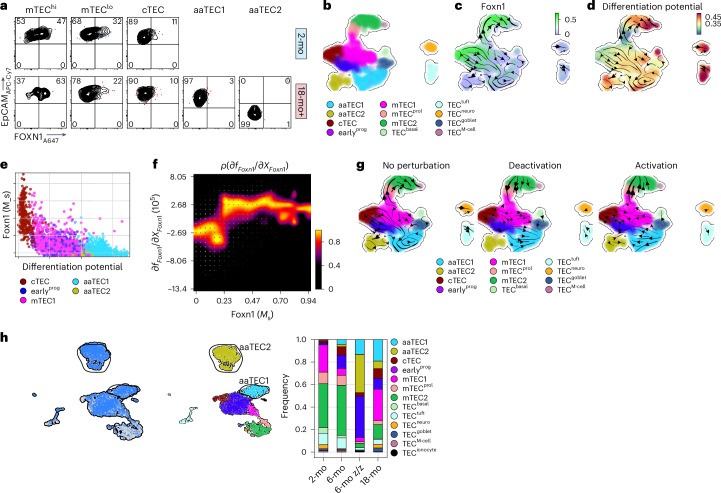
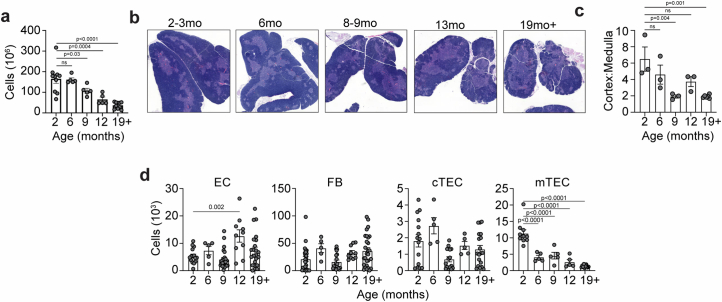
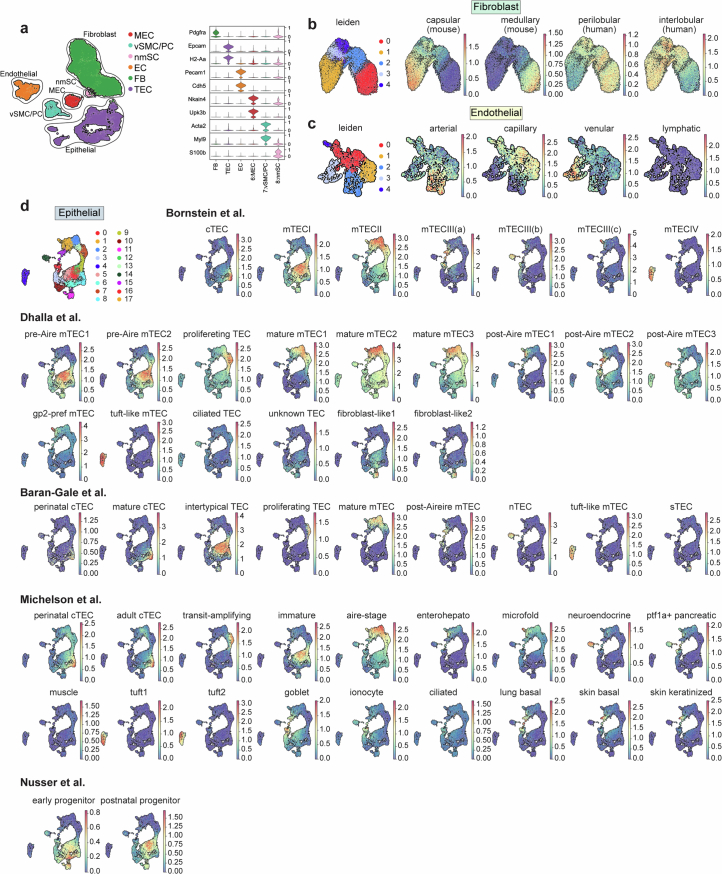
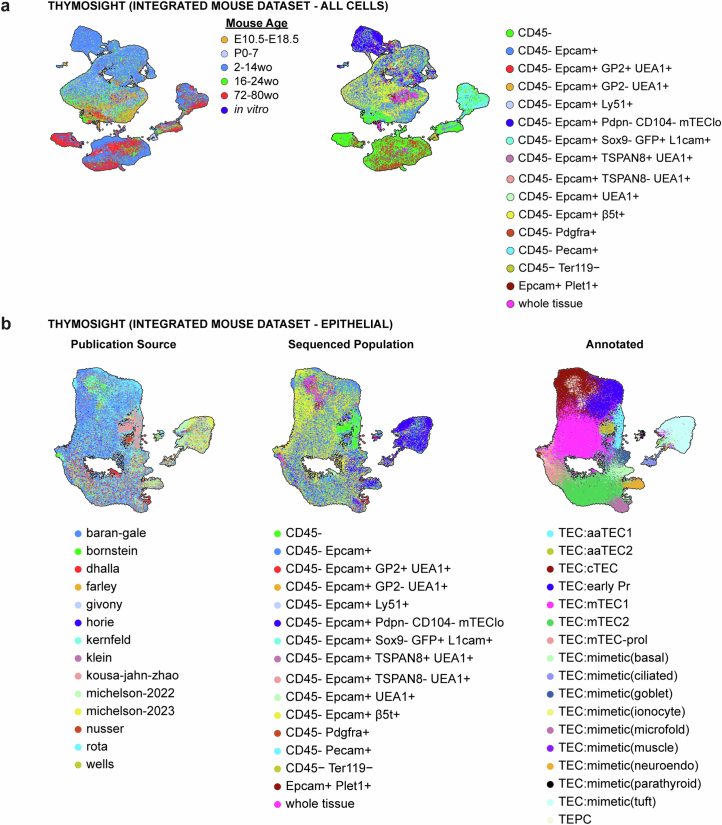
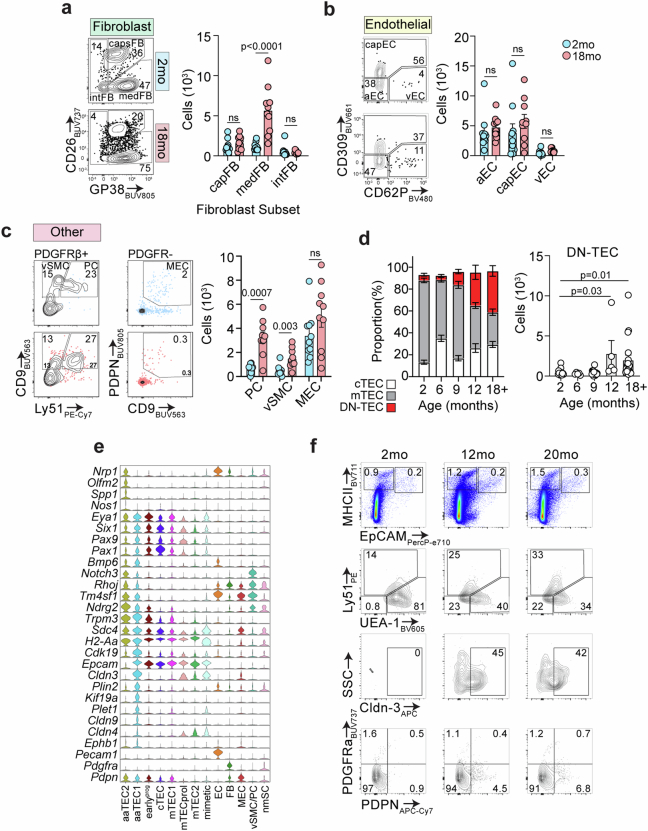
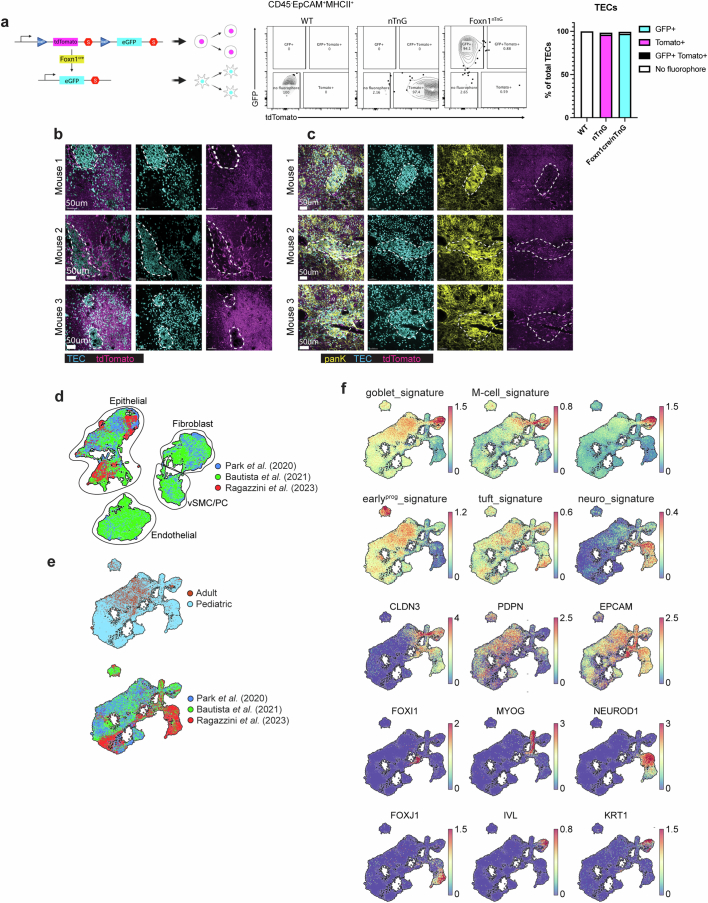
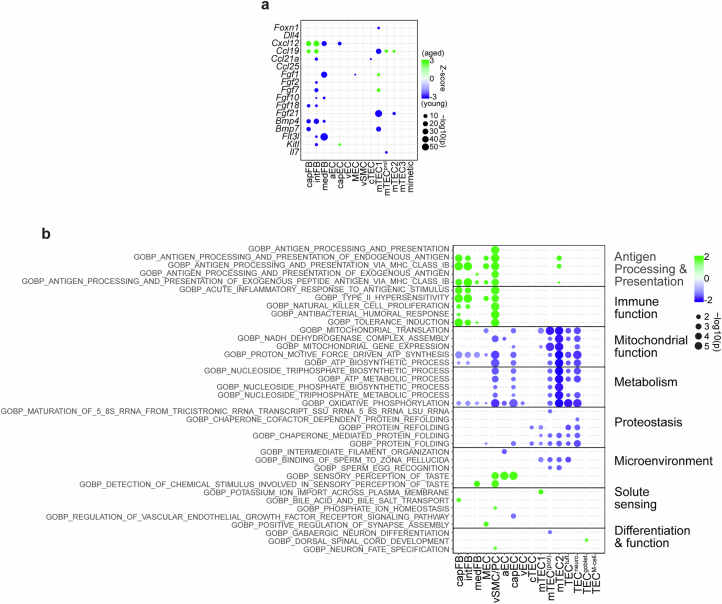
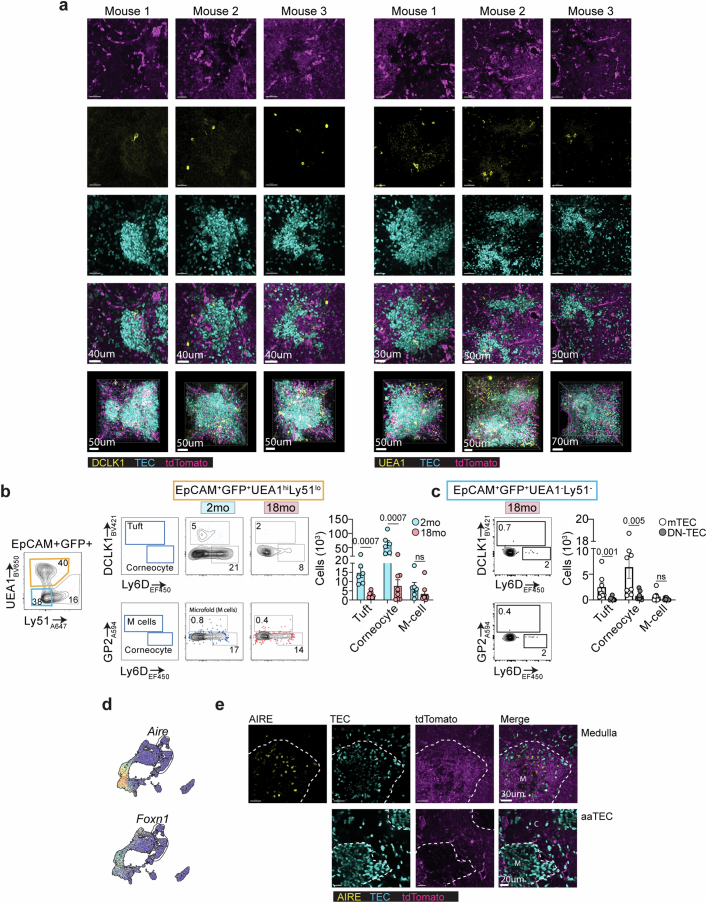
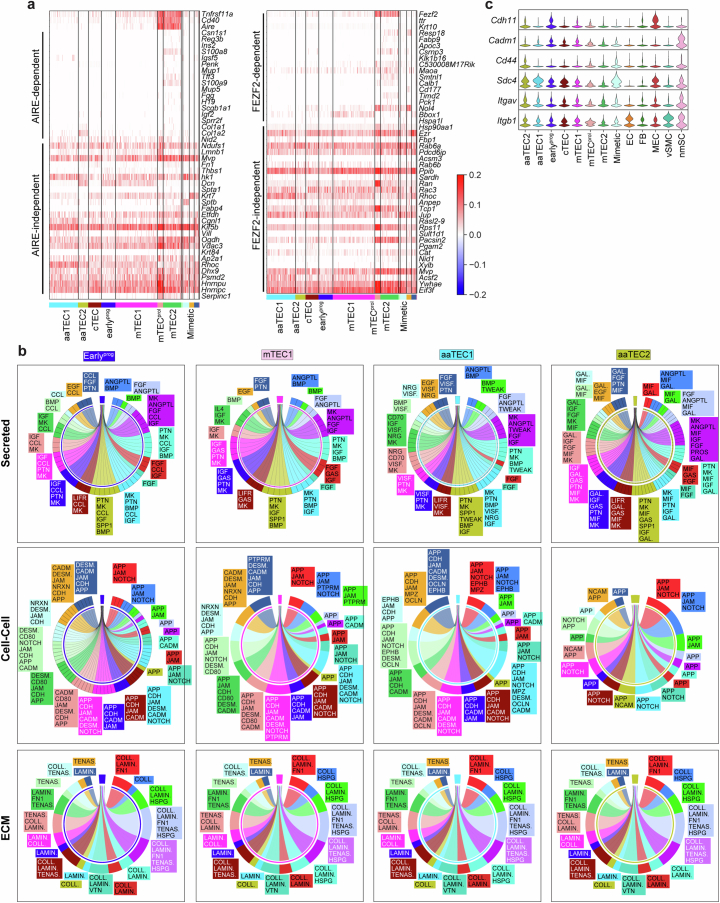
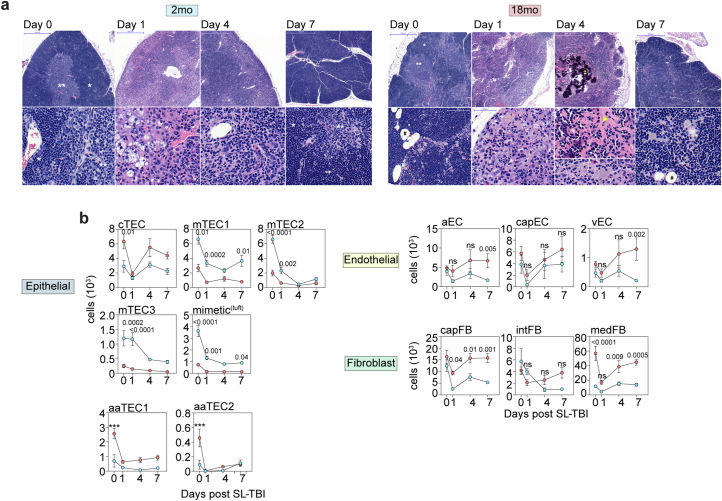
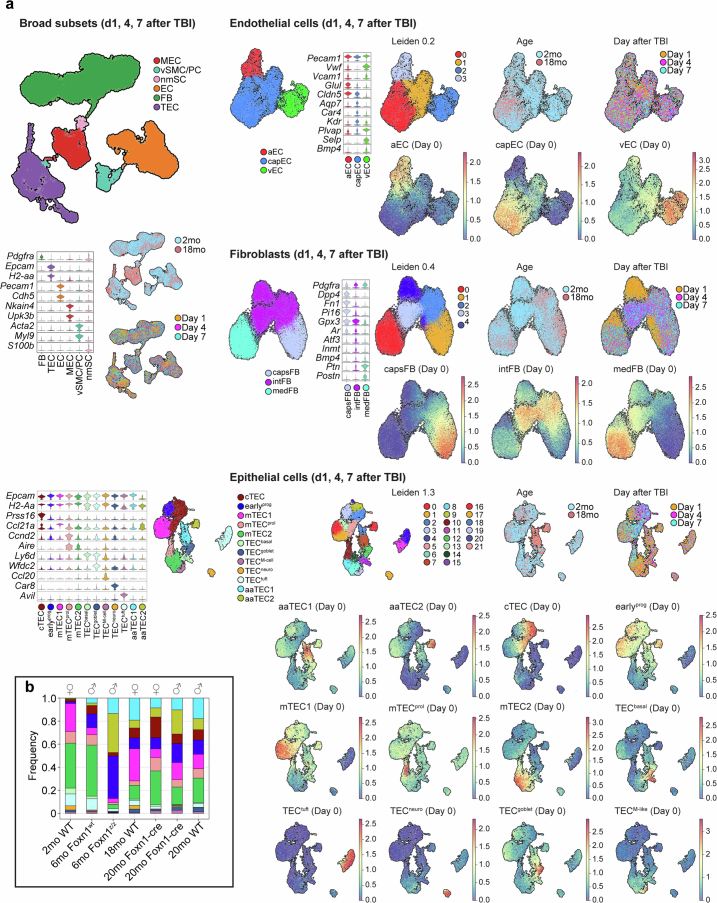
The thymus is essential for establishing adaptive immunity yet undergoes age-related involution that leads to compromised immune responsiveness. The thymus is also extremely sensitive to acute insult and although capable of regeneration, this capacity declines with age for unknown reasons. We applied single-cell and spatial transcriptomics, lineage-tracing and advanced imaging to define age-related changes in nonhematopoietic stromal cells and discovered the emergence of two atypical thymic epithelial cell (TEC) states. These age-associated TECs (aaTECs) formed high-density peri-medullary epithelial clusters that were devoid of thymocytes; an accretion of nonproductive thymic tissue that worsened with age, exhibited features of epithelial-to-mesenchymal transition and was associated with downregulation of FOXN1. Interaction analysis revealed that the emergence of aaTECs drew tonic signals from other functional TEC populations at baseline acting as a sink for TEC growth factors. Following acute injury, aaTECs expanded substantially, further perturbing trophic regeneration pathways and correlating with defective repair of the involuted thymus. These findings therefore define a unique feature of thymic involution linked to immune aging and could have implications for developing immune-boosting therapies in older individuals.


Conflict of interest statement

M.R.M.vdB. has received research support and stock options from Seres Therapeutics and stock options from Notch Therapeutics and Pluto Therapeutics; has consulted, received honorarium from or participated in advisory boards for Seres Therapeutics, WindMIL Therapeutics, Rheos Medicines, Merck & Co, Magenta Therapeutics, Frazier Healthcare Partners, Nektar Therapeutics, Notch Therapeutics, Forty Seven, Priothera, Ceramedix, Lygenesis, Pluto Therapeutics, GlaskoSmithKline, Da Volterra, Vor BioPharma, Novartis (Spouse), Synthekine (Spouse) and Beigene (Spouse); he has IP Licensing with Seres Therapeutics and Juno Therapeutics; and holds a fiduciary role on the Foundation Board of DKMS (a nonprofit organization). J.A.D. and M.R.M.vdB. are founders of, and receive stock options, from ThymoFox; and both have received royalties from Wolters Kluwer. The Walter and Eliza Hall Institute of Medical Research receives milestone and royalty payments related to venetoclax. Employees are entitled to receive benefits related to these payments; D.H.D.G. reports receiving benefits. D.H.D.G. has received research funding from Servier. The remaining authors declare no competing interests.

Figures

Fig. 1
Fig. 1. Emergence of atypical epithelial populations with age.
a, Uniform Manifold Approximation and Projection (UMAP) of 22,932 CD45 thymic cells from 2-mo and 18-mo female C57BL/6 mice, annotated by cell type subset and outlined by cell compartment (epithelial; fibroblast; endothelial; MEC; vSMC/PC; nmSC). b, ThymoSight integration of public data for murine nonhematopoietic thymic stromal cells, including our own dataset (n = 297,988) annotated by publication source and outlined by cell type and compartment. c, Violin plots highlighting key genes marking individual subsets within individual structural compartments (fibroblast, endothelium and epithelium). d,e, UMAPs of individual structural compartments color-coded by cell type subset (d) and age cohort (e). nEC = 1,661; nFB = 13,240; nTEC = 6,175. f, Scaled change in frequency for each individual structural cell subset with age. g, Gating strategy and quantities for cell populations within the epithelial lineage (based on previous work) in 2-mo (n = 10) and 18-mo (n = 10) mice. First, based on a CD45EpCAM+ parent gate, tuft cells were identified by expression of L1CAM, then all other TECs were assessed for expression of conventional TEC markers UEA1 and Ly51. Within the UEA1hiLy51lo mTEC population CD104+MHCIIlo cells were identified as mTEC1. Cells that were deemed as non-mTEC1 were then fractionated based on MHCII and Ly6D. h, Concatenated flow cytometry plots and graphs highlighting the frequency of Ly51UEA1 (DN-TECs) across lifespan (gated on CD45EpCAM+MHCII+ cells). i, Violin plots of aaTEC1 and aaTEC2 novel markers. j,k, Flow cytometry plots (j) and quantities (k) for aaTEC1 and aaTEC2 populations in 2-mo (n = 15), 12-mo (n = 10) or 18-mo (n = 13) male and female C57BL/6 mice. Summary data represent mean ± s.e.m.; each dot represents an individual biological replicate. Statistics were generated using a two-tailed Mann–Whitney test comparing within individual subsets (g) or Kruskal–Wallis (k) test with Dunn’s correction.
Fig. 2
Fig. 2. Age-associated TECs form distinct high-density peri-medullary ‘scars’.
a, Representative images of thymus in 2-mo and 24-mo male Foxn1nTnG mice with medulla marked by dotted line. HD-TEC regions are apparent in aged but not young mice. b, Images of whole-tissue light-sheet imaging showing central medulla (magenta) in 2-mo and 24-mo male Foxn1nTnG mice with HD-TEC (cyan) only apparent in aged mice. Medulla surface was defined on the basis of the frequency of GFP+ cells and tdTomato expression (with high tdTom correlating with medullary regions) and confirmed by confocal imaging of KRT14. c, Quantification of total thymus volume, volume of cortex, medulla and HD-TEC regions and the number of mTECs, cTECs and HD-TECs calculated from whole-tissue and confocal imaging in 2-mo (n = 3) and 18-mo (n = 3) mice. Summary data represent the mean ± s.e.m.; statistics were derived from independent biological replicates (individual animals) using a two-tailed unpaired t-test. d, Visium spatial sequencing performed on 2-mo or 18-mo C57BL/6 thymus. Displayed are H&E sections, cortex and medulla identified by Leiden clustering and heatmaps of aaTEC1 and aaTEC2 signatures (top 20 differentially expressed genes for each subset versus other TECs; Extended Data Fig. 3 and Supplementary Table 3) overlaid. e, Expression of pan-keratin and keratin subunits 8, 5, 14 and claudin-3 on HD-TEC regions of thymus from 12–18-mo male Foxn1nTnG mice. Scale bar, 50 μm. f, Transcriptional expression of keratin subunits and claudin-3 in the epithelial scRNA-seq dataset. nTEC = 6,175.
Fig. 3
Fig. 3. Age-associated TECs are derived from FOXN1-expressing cells.
a, Representative flow cytometry plots from 12–18-mo male and female Foxn1nTnG mice at the indicated ages, gated on tdTomGFP+ cells. tdTomGFP+EpCAM+ cells were then assessed for expression of the conventional TEC markers UEA1 and Ly51. b, Claudin-3 and UEA1 expression on tdTomGFP+EpCAM+ cells in Foxn1nTnG mice, and quantification of claudin-3 on UEA1+ mTEC and UEA1Ly51 DN-TECs (n = 4 biological replicates representing individual mice). c, Podoplanin (Pdpn) and PDGFRa expression on tdTomGFP+EpCAM cells (n = 4 biological replicates representing individual mice). d, Number of GFP+EpCAM+UEA1Ly51Cldn3+ aaTEC1 and GFP+EpCAMPDPN+PDGFRα aaTEC2 cells in 2-mo (n = 6) and 18-mo (n = 4) mice. e, scRNA-seq was performed on CD45 cells isolated from male and female 20-mo Foxn1tdTom and age-matched WT mice, and integrated into the epithelial data described in Fig. 1c–e. UMAP of 8,505 cells of the epithelial compartment in the integrated data showing the TEC annotated subsets (top) and overlaid expression of tdTomato (bottom). Scale represents log-transformed average expression of the tdTomato-WPRE element. f, RNA velocity on selected TEC populations in 2-mo (top) or 18-mo (bottom) mice. n2mo = 1,989; n18mo = 3,382. g, Vein plots describing the continuous transition of 18-mo earlyprog, mTEC1, mTECprol and aaTEC subsets to their predicted descendants (represented by diagonal flows) and the dynamic relative frequencies (vein width on the y axis) of these TEC subsets in the thymus over the binned pseudotime. h, Expression of thymocyte markers Thy1 and Lck overlaid on the 18-mo spatial transcriptomics dataset. Outline represents thymocyte-poor area overlaid onto heatmap showing aaTEC1 or aaTEC2 signatures. i, Two representative images in 12–18-mo male and female Foxn1nTnG mice showing tdTomato and GFP expression with HD-TEC areas highlighted, with few or no tdTomato+ cells. Scale bar, 50 μm. j, Human tissue sections from a 50-year-old woman. Shown are consecutive sections with H&E, cytokeratin or CD1a staining. k, aaTEC1 and aaTEC2 gene signatures (top 20 marker genes from our mouse data converted to human orthologs; Supplementary Fig. 3 and Supplementary Table 3) were overlaid on human thymic epithelial cells (nTEC = 40,144) from single-cell sequencing datasets generated and published elsewhere,,. Summary data represents mean ± s.e.m. and each dot represents an individual biological replicate. Statistics were generated (bd) using a two-tailed Mann–Whitney test.
Fig. 4
Fig. 4. Age-associated TEC regions are non-functional and associated with EMT.
a, GSEA pathway analysis was performed for each subset based on differentially expressed genes in 18-mo versus 2-mo mice (Supplementary Tables 4 and 5) and Cytoscape network analysis was used to integrate enriched pathways (false discovery rate (FDR) ≤ 0.05) sharing a core set of genes. Dotplot of top five pathways within each category (Supplementary Table 5). b, GSEA pathway enrichment within aaTEC1 or aaTEC2 subsets (generated by comparing aaTEC1 and aaTEC2 to all other TECs; Supplementary Table 6). c, Heatmap of 8,795 genes within cTEC, mTEC1, aaTEC1, aaTEC2 and medFB subsets ranked by cadherin-1 (encoded by Cdh1) expression. d, Scatter-plot of Cdh1 and Vim with cTEC, mTEC1, aaTEC1, aaTEC2 and medFB subsets. e, Scatter-plot of Cdh1 and Vim transcription overlaid with expression of epithelial and mesenchymal genes and EMT known regulators. f, Expression of key epithelial genes and thymopoietic factors by various 18-mo TEC subsets, including aaTECs. g, Heatmap of AIRE- (left) and FEZF2-dependent/independent (right) genes reported previously. Heatmap shows scaled normalized gene expression. h, CellChat interaction overview summarizing number of interactions between grouped populations in 2-mo and 18-mo mice. i, CellChat interaction analysis between stromal cell populations with earlyprog, mTEC1, aaTEC1 or aaTEC2 as cellular receivers (see also Extended Data Fig. 8b). Matrix represents all significantly enriched pathways targeting either earlyprog, mTEC1, aaTEC1 or aaTEC2 (color-coded by the receiver population) and split by the type of CellChat signaling (secreted, cell–cell and ECM). j, Levels of PTN and MK in thymus at 2-mo (n = 5), 12-mo (n = 5) or 18-mo (n = 5) female C57BL/6 mice. Summary data represents mean ± s.e.m. and each dot represents an individual biological replicate. Statistics for j were generated using the Kruskal–Wallis test with Dunn’s correction. ECM, extracellular matrix.
Fig. 5
Fig. 5. Aging negatively impacts thymic regeneration.
a,b, 2-mo or 18-mo female C57BL/6 mice were given a sublethal dose of TBI (550 cGy) and the thymus was assessed at the indicated time points (n = 30, 2-mo day 0; 10, 2-mo day 1; 10, 2-mo day 4; 10, 2-mo day 7; 10, 2-mo day 28; 10, 2-mo day 42; and 35, 18-mo day 0; 10, 18-mo day 1; 10, 18-mo day 4; 10, 18-mo day 7; 10, 18-mo day 28; 15, 18-mo day 42). Total thymic cellularity (a). Proportion of total thymic cellularity at the indicated time points as a function of steady-state age-matched cellularity (b). c, Flow cytometry plots (gated on CD45EpCAM+) showing DN-TECs at day 42 after TBI in C57BL/6 mice at the indicated ages. d, Depletion and recovery of indicated populations were quantified by flow cytometry over the first 7 days after TBI in 2-mo or 18-mo mice and area under the curve was calculated (Extended Data Fig. 9b). An aging index was generated by calculating the ratio of aged to young AUC for each indicated population (n = 10 per cell type). e, Whole-tissue imaging of 12-mo male Foxn1nTnG mice at baseline or 28 days after TBI (550 cGy). f, Total volume and volume of cortex, medulla and aaTEC regions, as well as the number of cTECs, mTECs and aaTECs of the thymic right lobe. gj, scRNA-seq was performed on CD45 cells isolated from 2-mo or 18-mo thymus at baseline (day 0) and days 1, 4 and 7 after TBI. UMAP of 81,241 CD45 cells annotated by age cohort (g), day after TBI (h) or structural cell subset mapped from Fig. 1c and Extended Data Fig. 10a (i). j Associated frequency analysis of all TEC subsets after TBI within each age cohort. k, RNA velocity analysis on all TEC subsets at days 0, 1, 4 and 7 after TBI in 2-mo or 18-mo mice. Summary data represent mean ± s.e.m. and each dot represents an individual biological replicate. Statistics were generated using the Kruskal–Wallis test with Dunn’s correction (a,d) and two-tailed Mann–Whitney test (b,f). For b, statistics represent a comparison of 2-mo to 18-mo mice within each time point. *P = 0.02; **P = 0.004; ***P = 0.002; ****P < 0.0001.
Fig. 6
Fig. 6. Muted transcriptional response to irradiation in the aged thymic stroma linked to aaTEC disruption of trophic signals.
a, Differential expression after damage within stromal cell subsets of key thymopoietic and epithelial growth factors in 2-mo or 18-mo female C57BL/6 mice at days 4 and 7 after TBI (compared to day 1). b, Differential expression of cTECs associated genes at days 4 and 7 after TBI in 2-mo and 18-mo mice. c, Expression of receptors for epithelial growth factors across stromal cell subsets. d, Chord diagram interaction analysis of FGF and BMP signaling pathways in 2-mo or 18-mo mice at baseline and at day 7 after TBI. e, CD45 nonhematopoietic stromal cells were isolated from 18-mo female mice and incubated for 5 min with KGF (100 ng ml−1) when cells were stained for phosphorylated AKT by flow cytometry (n = 6 thymuses isolated from individual mice). Summary data represent mean ± s.e.m. and each dot represents an individual biological replicate. Statistics were generated using a two-tailed paired t-test.
Fig. 7
Fig. 7. FOXN1 loss of function accelerates aaTEC emergence with age.
a, FOXN1 expression across TEC subsets by flow cytometry. bd, UMAP of 18-mo TEC data at steady state, color-coded for TEC subset (b), Foxn1 expression (c) and differentiation potential (d) with projected RNA velocity data. e, Scatter-plot of differentiation potential (d) versus Foxn1 expression levels color-coded by subset annotation. f, Response heatmap showing the RNA Jacobian element for Foxn1 self-induction (dfFoxn1/dXFoxn1) versus the Foxn1 expression (Foxn1 (Ms)). g, In silico perturbation analysis of Foxn1 in the 18-mo epithelium at steady state and accompanied cell fate diversions. Velocity arrows in UMAPs show cell fate directionality in the unperturbed dataset (left) and after in silico suppression (middle) or induction (right) of Foxn1. h, scRNA-seq was performed on CD45 cells from 6-mo Foxn1Z/Z mice and controls. UMAPs of 3,594 cells color-coded by sample and mapped to our TEC subsets.
Extended Data Fig. 1
Extended Data Fig. 1. General stromal features of thymic aging.
a, Thymic cellularity of female C57BL/6 mice at 2, 6, 9, 12 or 19+ months of age. b-c, Representative images of hematoxylin and eosin (H&E) stained mouse thymi from 2, 6, 8-9, 13, and 19+mo female C57BL/6 mice (b) used to calculate ratio of cortical (dark) to medullary (light) region (c). In (c), each dot represents a biological replicate. d, Flow cytometric analysis of enzymatically digested thymus and absolute cell numbers for major cell types (TECs; cTECs and mTECs; ECs and FBs) in 2, 6, 9, 12, and 18+ mo female C57BL/6 mice. Summary data represents mean ± SEM; each dot represents an individual biological replicate; statistics were generated for a, c, and d using one-way ANOVA with the Dunnett correction for multiple comparisons.
Extended Data Fig. 2
Extended Data Fig. 2. Mapping of pre-existing thymic stromal sequencing datasets.
a, Broad structural cell subsets were annotated based on expression of canonical markers such as Pdgfra, Epcam, H2-aa, Pecam, and Cdh5. b, Leiden clustering of our fibroblast population (nFB=13,240) and signatures for murine capsular-medullary and human perilobular-interlobular fibroblasts based on previously published datasets,. c, Leiden clustering of our endothelial population (nEC=1,661) and signatures for arterial, capillary, venular, and lymphatic endothelial cells based on previously published datasets. d, Leiden clustering of our thymic epithelial population (nTEC=6,175) and signatures of previously published literature and overlaid on our sequencing dataset–,.
Extended Data Fig. 3
Extended Data Fig. 3. Thymosight: Integration of thymic sequencing datasets.
a-b, UMAPs of (a) all mouse non-hematopoietic thymic stroma cells (ThymoSight integration of public data and ours; n = 297,988) annotated by age and sequenced population, and (b) all mouse thymic epithelial cells (n = 205,625; subset of CD45 ThymoSight data) annotated by publication source, sequenced population, and TEC subset.
Extended Data Fig. 4
Extended Data Fig. 4. Quantification of non-epithelial stromal cells subsets and aaTEC gating.
a–c, Concatenated flow cytometry plots and quantities for cell populations within the fibroblast (a), endothelial (b), and “other” (c) cell lineages in 2-mo (n = 10) and 18-mo (n = 10) mice. c, Concatenated flow cytometry plots and quantities for pericytes (PC), vascular smooth muscle cells (vSMC) and mesothelial cells (MEC) (n = 10/age). d, Frequency and numbers of DN-TEC across lifespan: 2-mo (n = 14), 6-mo (n = 5), 9mo (n = 15), 12-mo (n = 5), and 18+mo (n = 18). e, Violin plots with extensive list of aaTEC1 and aaTEC2 markers. f, Gating strategy for aaTECs. aaTEC1 were first gated on CD45TER119 then PDGFRα-CD31 cells. EpCAM+MHCII+ cells were gated as the whole TEC compartment, then mTECs and cTECs were excluded by taking the UEA1Ly51 double negative fraction and gating on CLDN3. aaTEC2 were also first gated on CD45TER119 then PDGFRα-CD31 cells. EpCAMMHCII+ cells were then gated and PDPN+PDGFRβ- were classed at aaTEC2. Summary data represents mean ± SEM; each dot represents an individual biological replicate. Statistics for a–c were generated using two-tailed Mann–Whitney tests comparing within individual populations and for d using the Kruskal–Wallis test with Dunns correction.
Extended Data Fig. 5
Extended Data Fig. 5. Validation of aaTEC identification and imaging.
a, Generation of Foxn1nTnG mice. ROSAnT-nG (nT/nG) mice were intercrossed with Foxn1Cre mice. Representative flow cytometric plots of TEC from 11 weeks old WT, nT/nG and Foxn1nTnG show specific detection of GFP in nearly all TEC only in the latter strain. Quantification of the relative proportions of TEC expressing the reporters are shown in the bar graph on the right (n = 2 to 3 from 2 experiments). b, Representative confocal images of thymic sections from 12-mo Foxn1nTnG mice with high-density TECs located in peri-medullary region. c, Representative confocal images of thymic sections from 12-mo Foxn1nTnG mice stained with anti-pan-keratin, with high-density TEC regions highlighted. d, UMAPs integrating all human CD45 non-hematopoietic cells from published datasets,, (ThymoSight) annotated by age and dataset (n = 115,536). e, UMAPs integrating all human thymic epithelial cells from public datasets,, (ThymoSight) annotated by age and dataset (n = 40,144). f, Signatures of our mouse epithelial cell subsets (Supplementary Table 3), including aaTEC, overlaid onto the integrated human TEC data derived from,,.
Extended Data Fig. 6
Extended Data Fig. 6. Age related changes in gene expression in thymic stromal cells.
a, Differential expression of key epithelial genes and thymopoietic factors with age. b, As in Fig. 4a, GSEA pathway analysis was performed for each subset based on differentially expressed genes within each population between 2-mo and 18-mo mice (Supplementary Table 4-5) and Cytoscape network analysis was used to integrate enriched pathways (FDR≤0.05) sharing a core set of genes. Dotplot of top 5 pathways within each category. Individual pathways are listed.
Extended Data Fig. 7
Extended Data Fig. 7. Comparison of aaTECs with conventional TECs and mimetic cells.
a, 3D reconstruction and representative images of high-density TEC region from 12-mo Foxn1nTnG mice stained with DCLK1 or UEA1 to highlight tuft cells and M-like cells, respectively. b, Flow cytometry plots showing proportion of selected mimetic cells (tuft, corneocyte and M-cells) in 2-mo (n = 6) and 18-mo (n = 8) Foxn1nTnG mice. Mimetic cells were first gated on EpCAM+GFP+ cells, then mTECs (UEA1hiLy51lo) were assessed for the mimetic cell markers DCLK1 (tuft cells), GP2 (microfold cells), and Ly6D (corneocytes). Bar graph shows quantification of mimetic cell numbers. c, Flow cytometry plots showing mimetic cell frequency in 18-mo Foxn1nTnG mice (n = 8) gated on EpCAM+GFP+UEA1Ly51 DN-TECs. Bar graph shows quantification of mimetic cells comparing mTECs (as in Extended Data Fig. 7b) and DN-TECs. d, Aire and Foxn1 expression in TEC subsets. e, Representative confocal images of thymic sections from 12-mo Foxn1nTnG mice stained with anti-AIRE, with the medulla or high-density TECs highlighted. Scale bar: 50μm. Summary data represents mean ± SEM; each dot represents an individual biological replicate. Statistics for b-c were generated using two-tailed Mann–Whitney tests comparing within individual mimetic cell subsets.
Extended Data Fig. 8
Extended Data Fig. 8. aaTEC function and interactome with age.
a, As in Fig. 4g, heatmap of AIRE- (left) and FEZF2- (right) dependent/independent genes from. Heatmap shows scaled normalized gene expression. Individual genes are listed. b, As in Fig. 4i, CellChat chord diagrams showing outgoing signals from all stromal cell populations towards earlyprog, mTEC1, aaTEC1 or aaTEC2 cellular receivers. Chord diagrams are color-coded by the sender population and split by the type of CellChat signaling (secreted, cell-cell and ECM). Specific outgoing signals per sender are listed in color-matching boxes on the side of each plot. c, Violin plot of receptors for putative EMT factors Midkine and Pleiotrophin.
Extended Data Fig. 9
Extended Data Fig. 9. Acute thymic recovery following ionizing radiation.
a, Morphologic alterations in the context of acute thymic involution after TBI and thymic reconstitution in 2-mo and 18-mo mice. Top and bottom rows represent low- and high-power images from each timepoint, respectively. Annotations: cortex (*), medulla (**), adipocytes (#), areas of dystrophic calcification (†), areas of dense fibrosis (arrowhead). b, Kinetics of recovery for the epithelial, endothelial and fibroblast defined subsets on day 0 (n = 10, 2-mo and 10, 18-mo), 1 (n = 10, 2-mo and 10, 18-mo), 4 (n = 10, 2-mo and 10, 18-mo) and 7 (n = 10, 2-mo and 10, 18-mo) after TBI in 2-mo and 18-mo mice. Total cellularity for each subset. Statistics compare across ages for each timepoint. Asterisks denote when recovery in either age cohort on a specific timepoint was significantly different to the other cohort. Summary data represents mean ± SEM. Statistics for b were generated using a two-way ANOVA with Šídák correction.
Extended Data Fig. 10
Extended Data Fig. 10. Mapping of pre-existing thymic stromal sequencing datasets after acute damage.
a, Broad structural cell subsets were annotated based on expression of canonical markers such as Pdgfra, Epcam, H2-aa, Pecam, and Cdh5 and steady-state subset signatures(top 20 marker genes). Leiden clustering and cell subset signatures derived from Supplementary Table 3 across endothelial, fibroblast and epithelial cells isolated at days 1, 4, and 7 after TBI. b, Stacked barplots comparing TEC subsets frequency in the 6-mo Foxn1Z/Z mice and controls to our own TEC subsets in 2-mo and 18-mo wild-type mice at steady state. ♀: female mice, ♂: male mice.

References

    1. Takahama, Y. Journey through the thymus: stromal guides for T-cell development and selection. Nat. Rev. Immunol.6, 127–135 (2006). 10.1038/nri1781 - DOI - PubMed
    1. Granadier, D., Iovino, L., Kinsella, S. & Dudakov, J. A. Dynamics of thymus function and T cell receptor repertoire breadth in health and disease. Semin. Immunopathol.43, 119–134 (2021). 10.1007/s00281-021-00840-5 - DOI - PMC - PubMed
    1. Velardi, E., Tsai, J. J. & van den Brink, M. R. M. T cell regeneration after immunological injury. Nat. Rev. Immunol.21, 277–291 (2021). 10.1038/s41577-020-00457-z - DOI - PMC - PubMed
    1. Boelens, J. J., Hosszu, K. K. & Nierkens, S. Immune monitoring after allogeneic hematopoietic cell transplantation: toward practical guidelines and standardization. Front. Pediatr.8, 454 (2020). 10.3389/fped.2020.00454 - DOI - PMC - PubMed
    1. Baran-Gale, J. et al. Ageing compromises mouse thymus function and remodels epithelial cell differentiation. eLife10.7554/eLife.56221 (2020). - PMC - PubMed

Grants and funding