. 2024 Aug 7;81(1):333.
doi: 10.1007/s00018-024-05382-1.

Neuroprotection by ADAM10 inhibition requires TrkB signaling in the Huntington's disease hippocampus

Affiliations

Neuroprotection by ADAM10 inhibition requires TrkB signaling in the Huntington's disease hippocampus

Andrea Scolz et al. Cell Mol Life Sci. .

Abstract

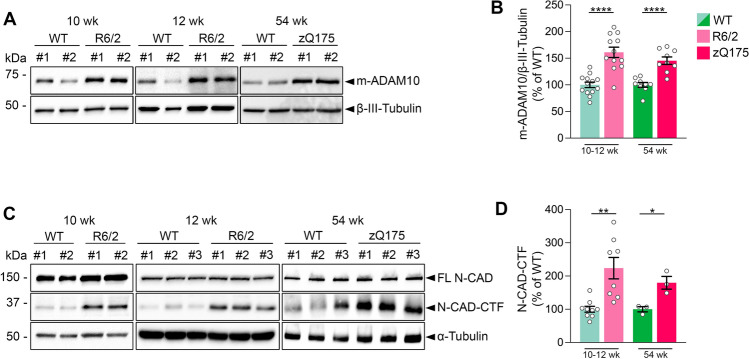
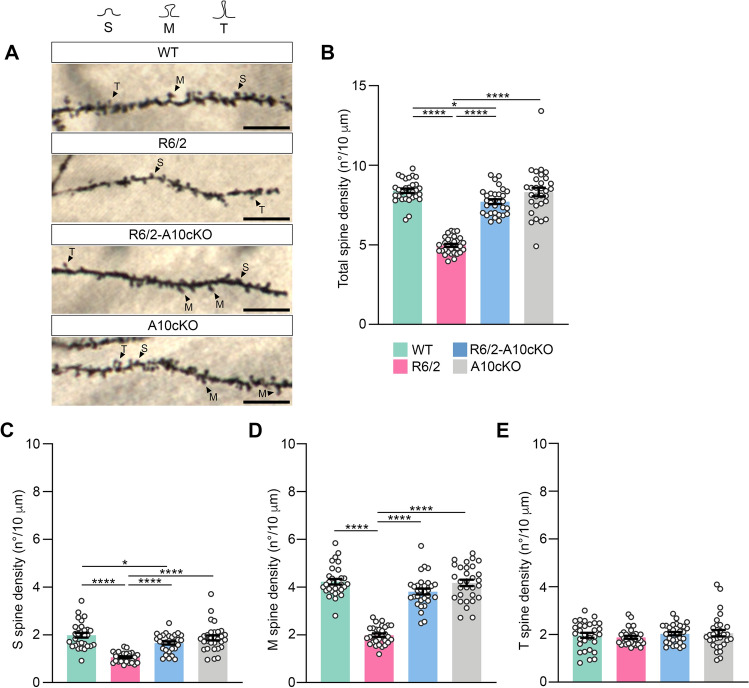
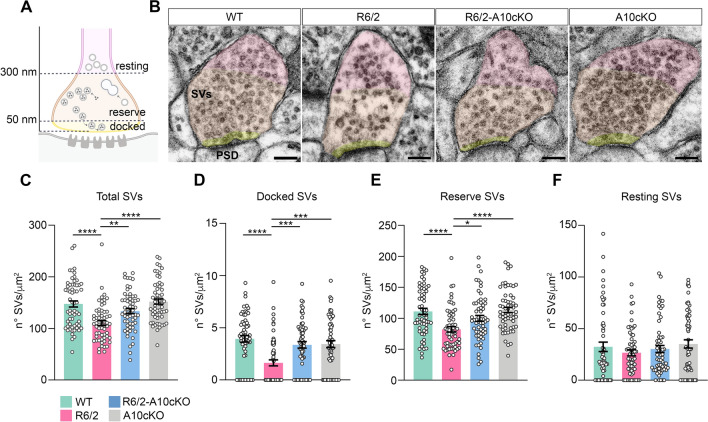
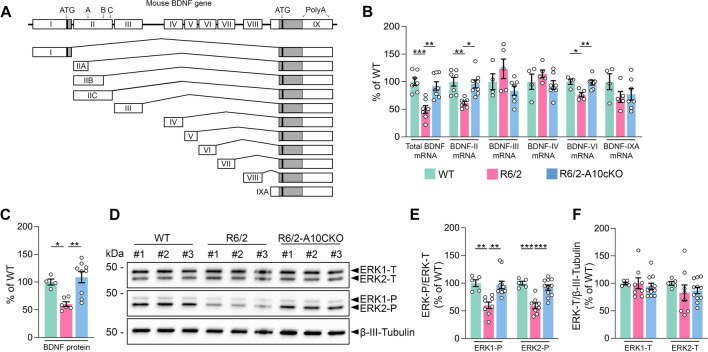
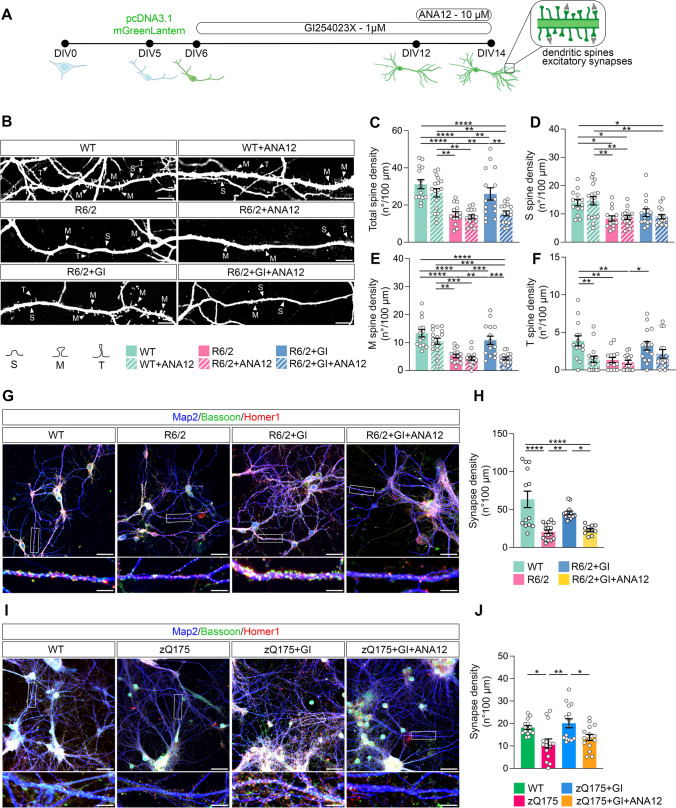
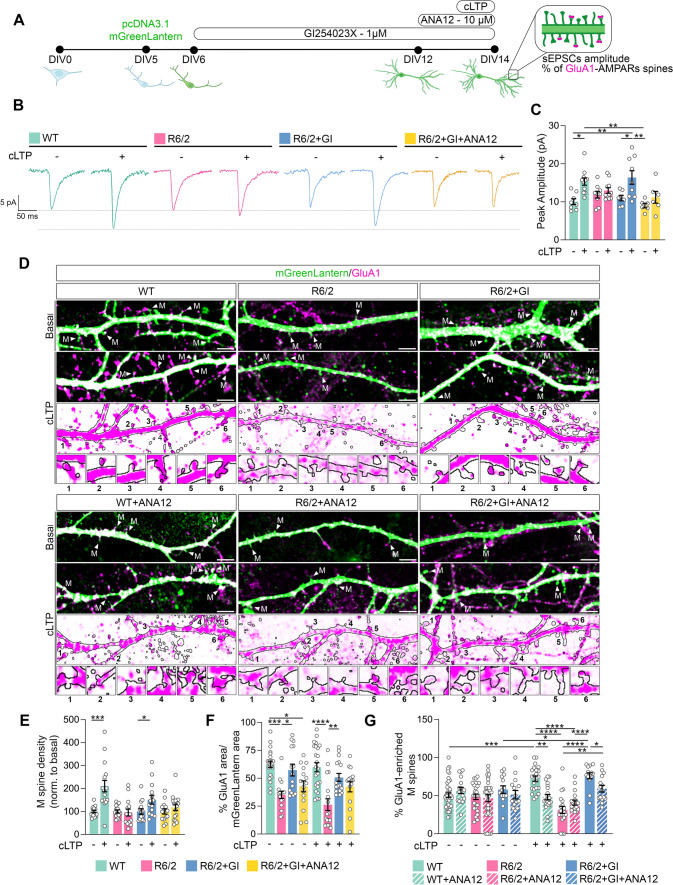
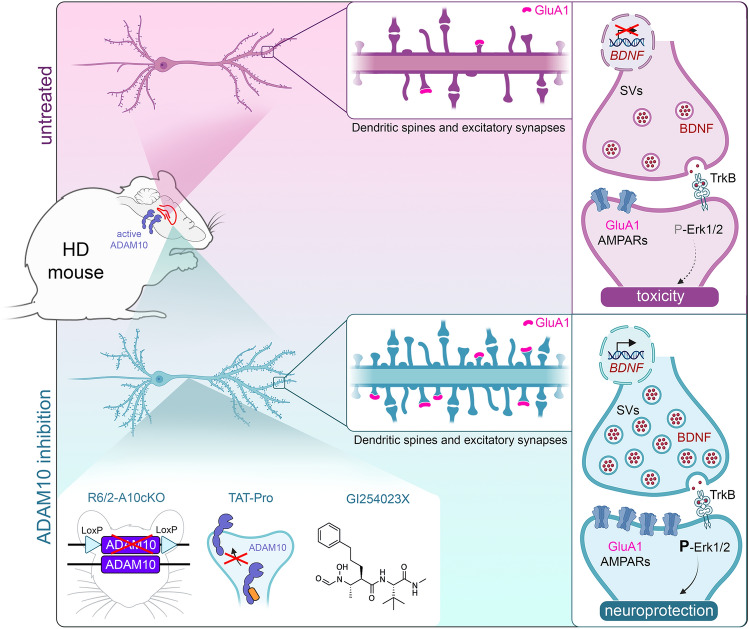
Synaptic dysfunction is an early pathogenic event leading to cognitive decline in Huntington's disease (HD). We previously reported that the active ADAM10 level is increased in the HD cortex and striatum, causing excessive proteolysis of the synaptic cell adhesion protein N-Cadherin. Conversely, ADAM10 inhibition is neuroprotective and prevents cognitive decline in HD mice. Although the breakdown of cortico-striatal connection has been historically linked to cognitive deterioration in HD, dendritic spine loss and long-term potentiation (LTP) defects identified in the HD hippocampus are also thought to contribute to the cognitive symptoms of the disease. The aim of this study is to investigate the contribution of ADAM10 to spine pathology and LTP defects of the HD hippocampus. We provide evidence that active ADAM10 is increased in the hippocampus of two mouse models of HD, leading to extensive proteolysis of N-Cadherin, which has a widely recognized role in spine morphology and synaptic plasticity. Importantly, the conditional heterozygous deletion of ADAM10 in the forebrain of HD mice resulted in the recovery of spine loss and ultrastructural synaptic defects in CA1 pyramidal neurons. Meanwhile, normalization of the active ADAM10 level increased the pool of synaptic BDNF protein and activated ERK neuroprotective signaling in the HD hippocampus. We also show that the ADAM10 inhibitor GI254023X restored LTP defects and increased the density of mushroom spines enriched with GluA1-AMPA receptors in HD hippocampal neurons. Notably, we report that administration of the TrkB antagonist ANA12 to HD hippocampal neurons reduced the beneficial effect of GI254023X, indicating that the BDNF receptor TrkB contributes to mediate the neuroprotective activity exerted by ADAM10 inhibition in HD. Collectively, these findings indicate that ADAM10 inhibition coupled with TrkB signaling represents an efficacious strategy to prevent hippocampal synaptic plasticity defects and cognitive dysfunction in HD.

Keywords: ADAM10; BDNF; Huntingtin; Synaptic dysfunctions.


Conflict of interest statement

The authors declare no competing interests.

Figures

Fig. 1
Fig. 1
The mature active form of ADAM10 is increased in the HD mouse hippocampus and causes N-CAD proteolysis. A Representative Western blot for the mature active form of ADAM10 (m-ADAM10) in synaptosomal fractions obtained from the hippocampus of R6/2 transgenic mice and zQ175 heterozygous knock-in mice. β-III Tubulin, loading control. B Quantification of data shown in A. WT and R6/2 mice at 10–12 weeks of age:  n=12–13 mice/genotype. WT and zQ175 mice at 54 weeks of age: n=9 mice/genotype. Data are represented as mean ± SEM. ****P < 0.0001, unpaired t test. C Representative Western blot of N-CAD-CTF in the hippocampus from WT and HD mice (R6/2 and zQ175). α-Tubulin, loading control. D Quantification of results shown in C. The N-CAD-CTF signal intensity has been divided for the FL N-CAD content, which has been determined by dividing FL N-CAD intensity over the α-Tubulin intensity. WT and R6/2 mice at 10–12 weeks of age: n=8–9 mice/genotype; WT and zQ175 mice at 54 weeks: n=3 mice/genotype. Data are represented as mean ± SEM. *P < 0.05, **P < 0.01, unpaired t test
Fig. 2
Fig. 2
ADAM10 heterozygous deletion in the forebrain rescues dendritic spine loss in the CA1 region of the hippocampus in R6/2 mice. A Representative examples of secondary apical dendritic segments of CA1 pyramidal neurons from 13-week-old WT, R6/2, R6/2-A10cKO and A10cKO mice. Scale bars: 10 µm, 80 × Objective. S, stubby spines; M, mushroom spines; T, thin spines. B Total dendritic spine density. C Stubby spine density. D Mushroom spine density. E Thin spine density. In B-E n = 3 mice/genotype were analyzed for a total of n = 30 neurons/genotype. Each dot in the graphs represents the mean ± SEM of the spine density in 10 µm dendrite for each neuron analyzed. *P < 0.05, ****P < 0.0001, One-way ANOVA with Tukey’s post hoc test
Fig. 3
Fig. 3
ADAM10 heterozygous deletion in the forebrain rescues ultrastructural defects of the HD hippocampal synapse. A Diagram showing SVs classification based on distance from the presynaptic membrane (docked: 0–50 nm, reserve: 50–300 nm, resting: > 300 nm) with corresponding tenuous background colors added as a guide for the eye in TEM images reported in panel (B). B Representative TEM images of excitatory synapses in pyramidal neurons of the CA1 region of the hippocampus of WT, R6/2, R6/2-A10cKO and A10cKO mice at 13 weeks of age. Scale bars: 100 nm. PSD, post-synaptic density. C Density of total SVs. D Density of docked SVs. E Density of reserve SVs. F Density of resting SVs. In C-F, n = 3 mice/genotype and n = 60 excitatory synapses/genotype were analyzed. Each dot in the graphs represents the n° SVs/µm2 for each excitatory synapse analyzed. Data are presented as mean ± SEM. *P < 0.05, **P < 0.01, ***P < 0.001, ****P < 0.0001, Kruskal–Wallis with Dunn’s multiple comparisons test
Fig. 4
Fig. 4
ADAM10 heterozygous deletion in the forebrain enhances BDNF synthesis and promotes ERK phosphorylation in the R6/2 hippocampus. A Scheme of the mouse BDNF gene and BDNF mRNA isoforms. B Total BDNF mRNA level and level of BDNF mRNA isoforms in the hippocampus of WT, R6/2 and R6/2-A10cKO mice at 13 weeks of age. WT: n = 4–7; R6/2: n = 5–7; R6/2-A10cKO: n = 7–8. Data are represented as mean ± SEM. *P < 0.05, **P < 0.01, ***P < 0.001, One-way ANOVA with Bonferroni’s post hoc test. For BDNF mRNA isoform II the forward and reverse primers (see Methods) led to simultaneous amplification of the transcript variant IIA, IIB, and IIC. C ELISA for BDNF in the hippocampus of WT, R6/2 and R6/2-A10cKO mice at 13 weeks of age. WT: n = 4; R6/2: n = 6; R6/2-A10cKO: n = 9. Data are represented as mean ± SEM. *P < 0.05, **P < 0.01, One-way ANOVA with Bonferroni’s post hoc test. D Representative Western blot for total and phosphorylated ERK1/2 in the hippocampus of WT, R6/2 and R6/2-A10cKO mice at 13 weeks of age. β-III Tubulin, loading control. E, F Quantification of data in D. WT: n = 5; R6/2: n = 8; R6/2-A10cKO: n = 11. Data are represented as mean ± SEM. **P < 0.01, ***P < 0.001, One-way ANOVA with Bonferroni’s post hoc test
Fig. 5
Fig. 5
TrkB mediates the neuroprotective effect determined by ADAM10 inhibition on long-lasting spine loss in HD hippocampal neurons. A Hippocampal neurons from WT and R6/2 mice were transfected at DIV5 with pcDNA3.1-mGreenLantern plasmid. The ADAM10 inhibitor GI254023X (GI, 1 µM) was administered from DIV6 until DIV14. The TrkB antagonist ANA12 (10 µM) was administered at DIV12 and cells were fixed at DIV14 for spine analyses and excitatory synapses quantification. B Immunofluorescence images of dendritic spines in hippocampal cultures: WT, WT + ANA12, R6/2, R6/2 + ANA12, R6/2 + GI; R6/2 + GI + ANA12. Scale bars: 10 µm. M, mushroom spines; T, thin spines; S, stubby spines. C-F Density of total, stubby, mushroom, and thin spines. Data are from n = 3 independent primary culture preparations. Each dot in the graphs represents the number of spines in a 100-µm-long dendrite. Data are presented as mean ± SEM. *P < 0.05, **P < 0.01, ***P < 0.001, ****P < 0.0001, One-way ANOVA with Tukey’s post hoc test. G Immunofluorescence images of excitatory synapses in hippocampal cultures: WT, R6/2, R6/2 + GI; R6/2 + GI + ANA12. I Immunofluorescence images of excitatory synapses in hippocampal cultures: WT, zQ175, zQ175 + GI; zQ175 + GI + ANA12. Excitatory synapses in G and I were visualized by Bassoon/Homer1 immunostaining. Map2, pan neuronal marker. Upper panel scale bars: 50 μm; bottom panel scale bars: 10 μm. H, J Synapses quantification. Data are from n = 3 independent primary culture preparations. Each dot in the graphs represents the number of excitatory synapses in a 100-µm-long dendrite. Data are presented as mean ± SEM. *P < 0.05, **P < 0.01, ****P < 0.0001, One-way ANOVA with Tukey’s post-hoc test
Fig. 6
Fig. 6
Blocking active ADAM10 with GI254023X promotes LTP induction through the TrkB signaling pathway. A Experimental scheme of treatment of WT and R6/2 primary hippocampal neurons. The ADAM10 inhibitor GI254023X (GI, 1 µM) was administered from DIV6 until DIV14. The TrkB antagonist ANA12 (10 µM) was administered at DIV12 until DIV14. Chemical LTP was induced at DIV14 with 0.2 mM glycine for 15 min. For dendritic spine analyses hippocampal neurons were transfected at DIV5 with pcDNA3.1-mGreenLantern plasmid. B Representative traces of spontaneous EPSCs (sEPSCs) recorded at a holding potential of -70 mV in baseline condition and following chemical LTP-induction (cLTP) in primary hippocampal cell cultures obtained from WT and R6/2 mice. + GI and + ANA12 indicate the presence of these substances in culture medium and during electrophysiological recordings. C Graph comparing the amplitudes of sEPSCs in baseline condition and after cLTP induction in the different experimental conditions. Each dot corresponds to the value obtained from a single cell. Data are expressed as mean ± SEM and were analyzed by Two-way ANOVA with Bonferroni’s post hoc test. *P < 0.05, **P < 0.01. D Representative images of dendritic segments (mGreenLantern signal) and GluA1 immunostaining in basal condition and after cLTP induction. M, mushroom spines. Image crops of representative M spines were numbered from 1 to 6. Scale bars: 10 µm. E Quantification of mushroom spine density. Data are from n = 3 independent primary culture preparations. Each dot in the graph represents the number of mushroom spines in a 100-µm-long dendrite. Data are shown as % over the basal condition, which was set to 100, and are expressed as mean ± SEM. *P < 0.05, ***P < 0.001, unpaired t test. F Quantification of GluA1 signal. Data are from n = 3 independent primary culture preparations. Each dot in the graph represents GluA1 signal in a 100-µm-long dendrite. Data are expressed as mean ± SEM and were analyzed by Two-way ANOVA with Tukey’s post hoc test. P* < 0.05, **P < 0.01, ***P < 0.001, ****P < 0.0001. G Percentage of mushroom spines enriched in GluA1 in basal condition and after cLTP induction. Data are from n = 3–5 independent primary culture preparations. Each dot in the graph represents the number of mushroom spines in a 100-µm-long dendrite. Data are expressed as mean ± SEM and statistical analysis was performed by using Two-way ANOVA with Tukey’s post hoc test. P* < 0.05, **P < 0.01, ***P < 0.001, ****P < 0.0001. Supplementary Table 1 and 2: detailed statistical outputs related to panel F and G
Fig. 7
Fig. 7
The ADAM10 and the BDNF/TrkB pathways at the HD hippocampal synapse. Defects in synaptic plasticity imply increased amounts of active ADAM10 in the HD hippocampus and downregulation of the BDNF/TrkB pathway. ADAM10 inhibition prevents the loss of long-lasting spines and enhances GluA1-AMPARs recruitment and LTP induction in mushroom spines, while also restoring BDNF and ERK signaling

References

    1. Bates GP, Dorsey R, Gusella JF, Hayden MR, Kay C, Leavitt BR, Nance M, Ross CA, Scahill RI, Wetzel R, Wild EJ, Tabrizi SJ (2015) Huntington disease. Nat Rev Dis Primers 1:15005. 10.1038/nrdp.2015.5 10.1038/nrdp.2015.5 - DOI - PubMed
    1. Paulsen JS, Langbehn DR, Stout JC, Aylward E, Ross CA, Nance M, Guttman M, Johnson S, MacDonald M, Beglinger LJ, Duff K, Kayson E, Biglan K, Shoulson I, Oakes D, Hayden M, Predict-HD Investigators and Coordinators of the Huntington Study Group (2008) Detection of Huntington’s disease decades before diagnosis: the Predict-HD study. J Neurol Neurosurg Psychiatry 79:874–880. 10.1136/jnnp.2007.128728 10.1136/jnnp.2007.128728 - DOI - PMC - PubMed
    1. Duff K, Paulsen J, Mills J, Beglinger LJ, Moser DJ, Smith MM, Langbehn D, Stout J, Queller S, Harrington DL, PREDICT-HD Investigators and Coordinators of the Huntington Study Group (2010) Mild cognitive impairment in prediagnosed Huntington disease. Neurology 75:500–507. 10.1212/WNL.0b013e3181eccfa2 10.1212/WNL.0b013e3181eccfa2 - DOI - PMC - PubMed
    1. Cepeda C, Wu N, André VM, Cummings DM, Levine MS (2007) The corticostriatal pathway in Huntington’s disease. Prog Neurobiol 81:253–721. 10.1016/j.pneurobio.2006.11.001 10.1016/j.pneurobio.2006.11.001 - DOI - PMC - PubMed
    1. Veldman MB, Yang XW (2018) Molecular insights into cortico-striatal miscommunications in Huntington’s disease. Curr Opin Neurobiol 48:79–89. 10.1016/j.conb.2017.10.019 10.1016/j.conb.2017.10.019 - DOI - PMC - PubMed

MeSH terms