. 2024 Aug;632(8025):622-629.
doi: 10.1038/s41586-024-07722-4. Epub 2024 Aug 7.

Molecular mimicry in multisystem inflammatory syndrome in children

Collaborators, Affiliations

Molecular mimicry in multisystem inflammatory syndrome in children

Aaron Bodansky et al. Nature. 2024 Aug.

Abstract

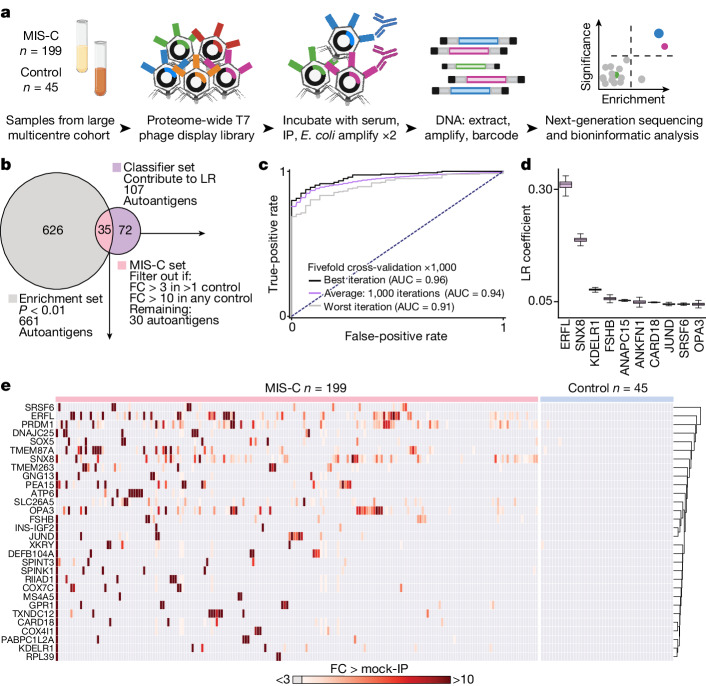
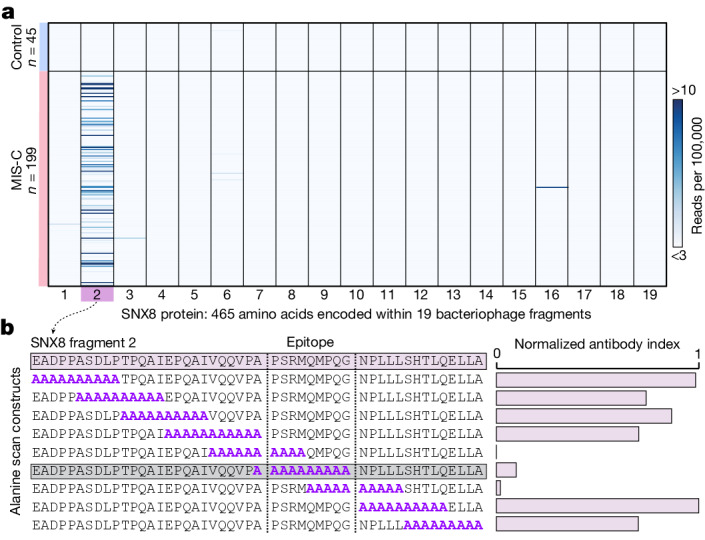
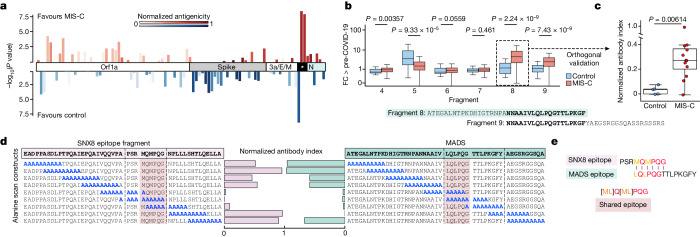
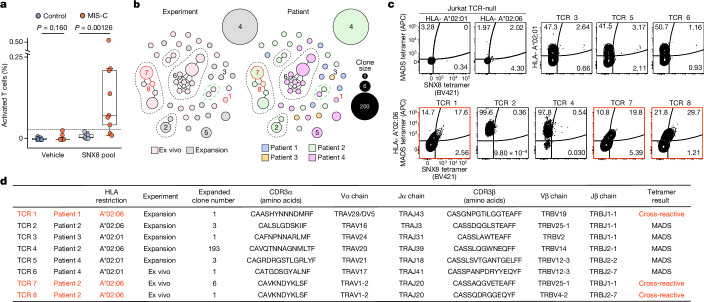
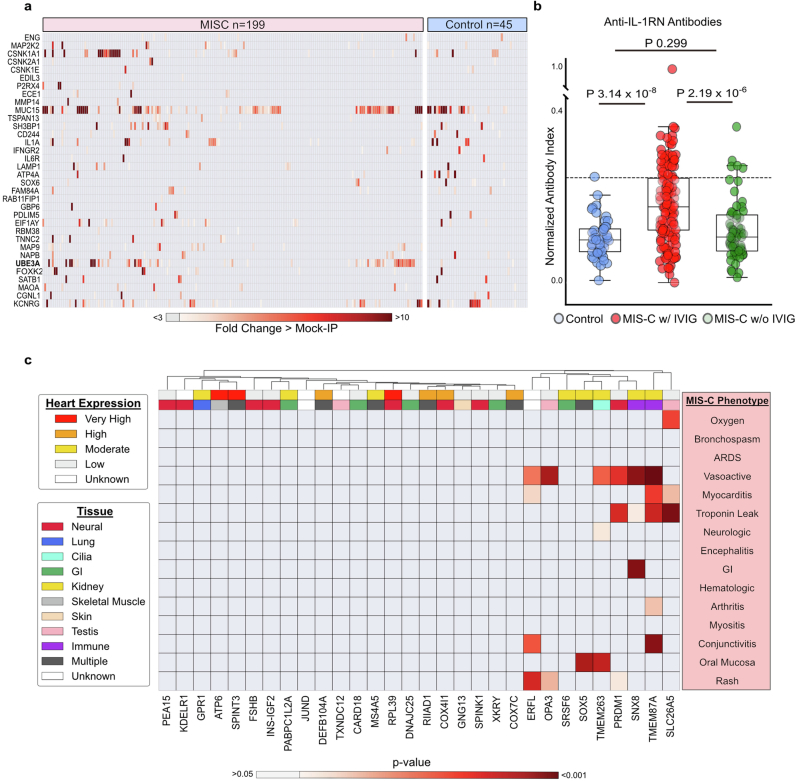
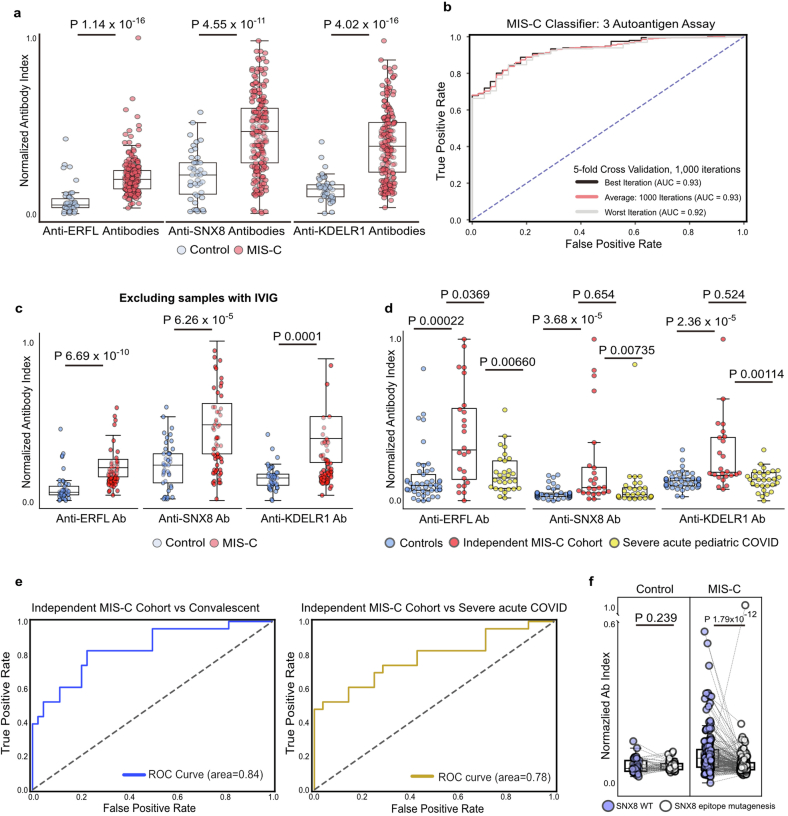
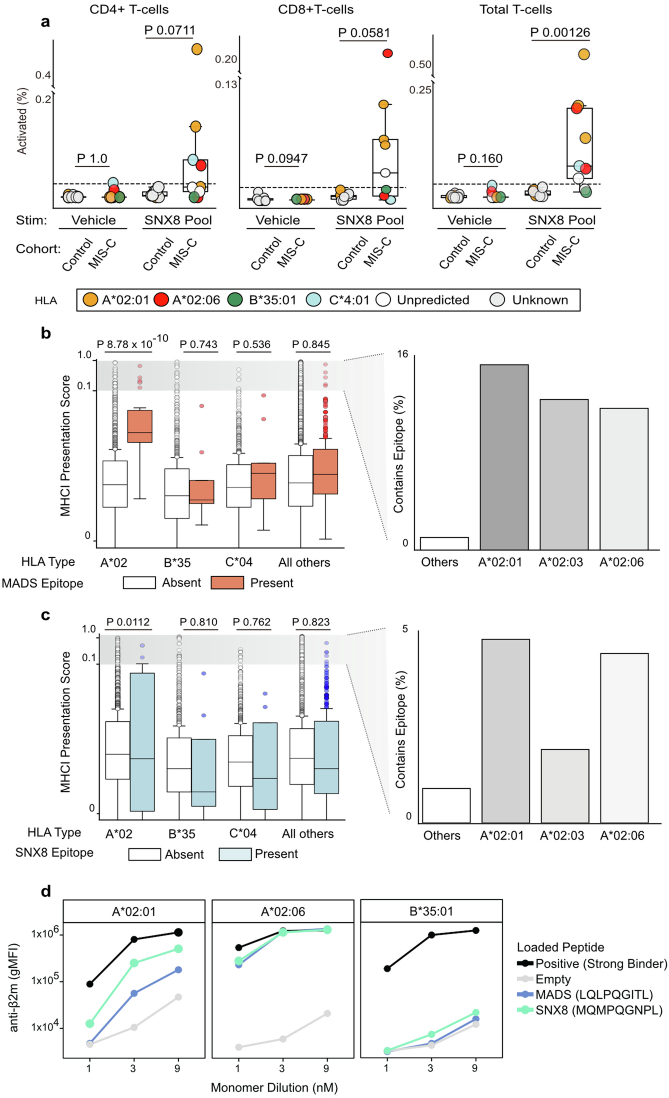
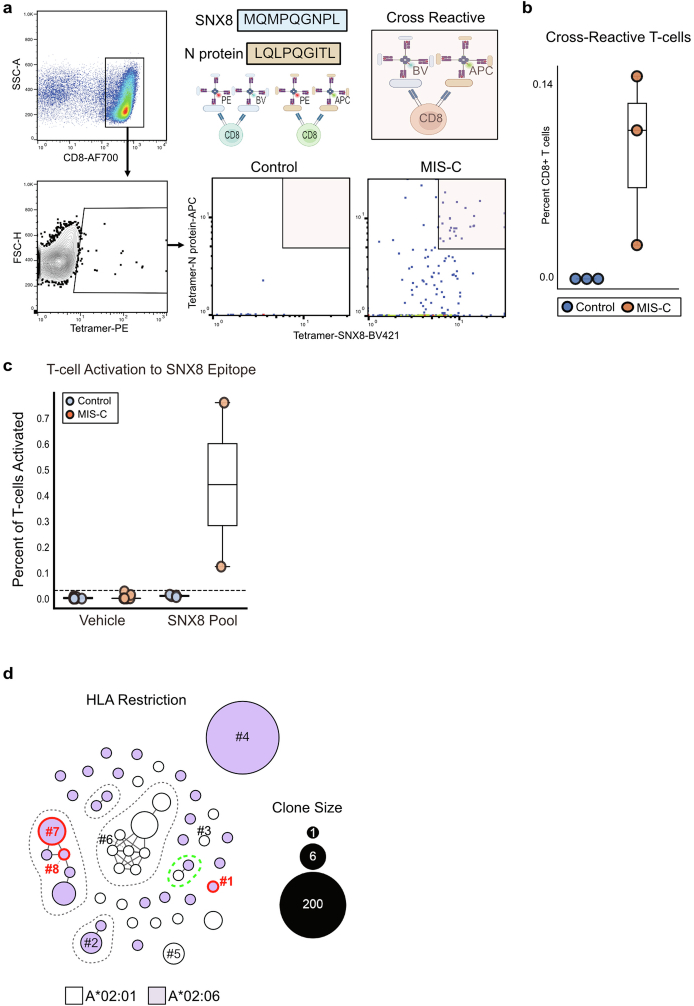
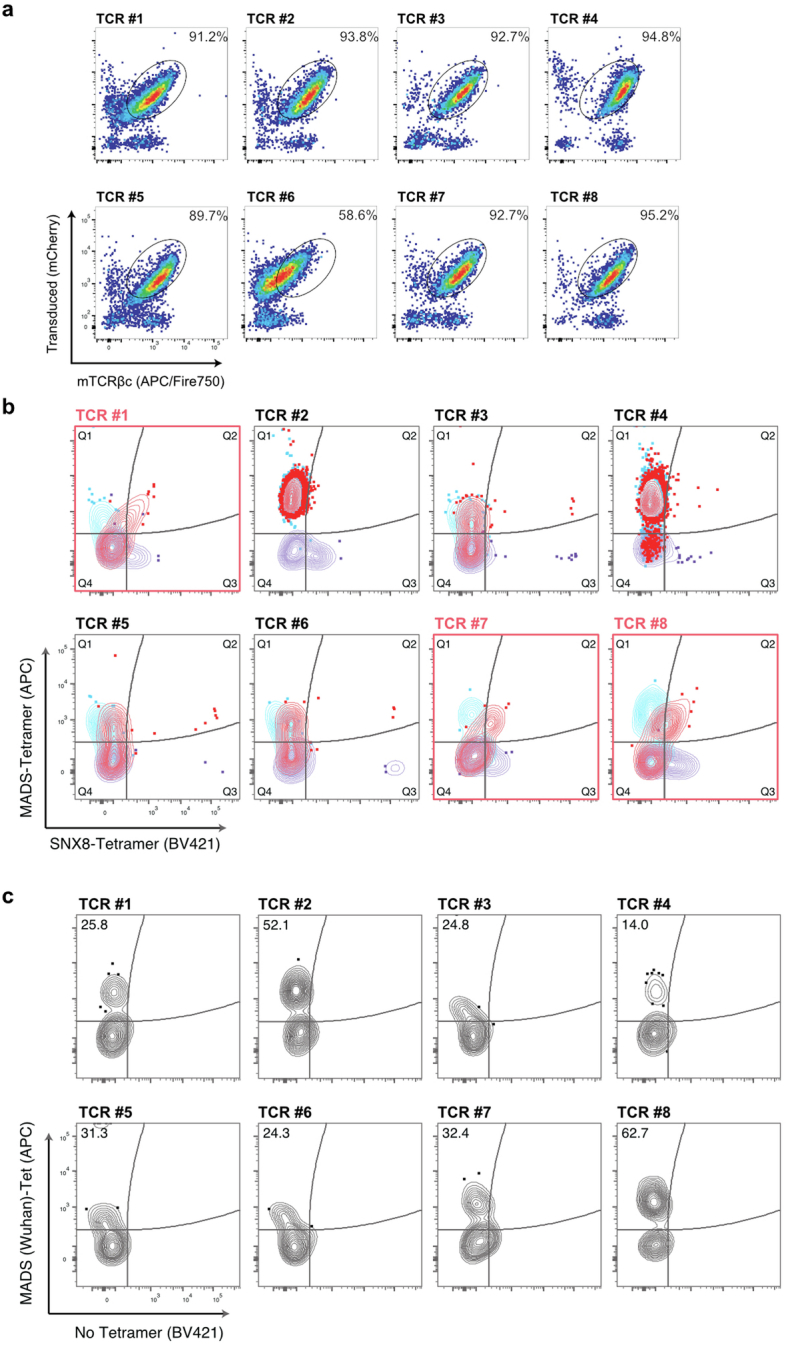
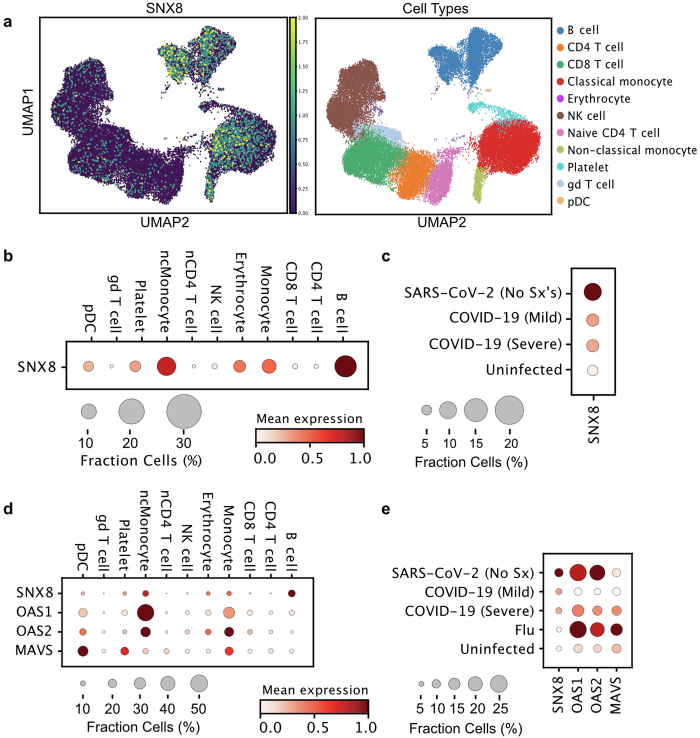
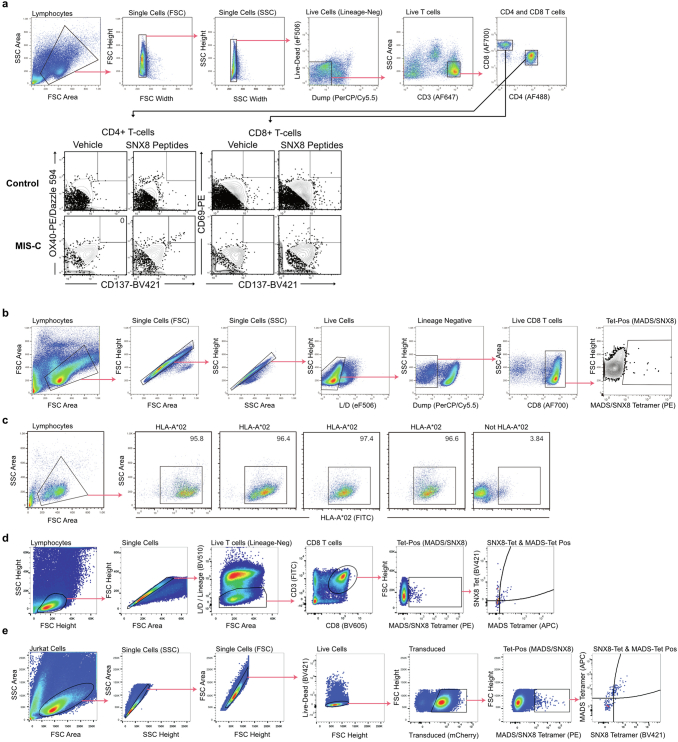
Multisystem inflammatory syndrome in children (MIS-C) is a severe, post-infectious sequela of SARS-CoV-2 infection1,2, yet the pathophysiological mechanism connecting the infection to the broad inflammatory syndrome remains unknown. Here we leveraged a large set of samples from patients with MIS-C to identify a distinct set of host proteins targeted by patient autoantibodies including a particular autoreactive epitope within SNX8, a protein involved in regulating an antiviral pathway associated with MIS-C pathogenesis. In parallel, we also probed antibody responses from patients with MIS-C to the complete SARS-CoV-2 proteome and found enriched reactivity against a distinct domain of the SARS-CoV-2 nucleocapsid protein. The immunogenic regions of the viral nucleocapsid and host SNX8 proteins bear remarkable sequence similarity. Consequently, we found that many children with anti-SNX8 autoantibodies also have cross-reactive T cells engaging both the SNX8 and the SARS-CoV-2 nucleocapsid protein epitopes. Together, these findings suggest that patients with MIS-C develop a characteristic immune response to the SARS-CoV-2 nucleocapsid protein that is associated with cross-reactivity to the self-protein SNX8, demonstrating a mechanistic link between the infection and the inflammatory syndrome, with implications for better understanding a range of post-infectious autoinflammatory diseases.


Conflict of interest statement

J.L.D. reports being a founder and paid consultant for Delve Bio, Inc., and a paid consultant for the Public Health Company and Allen & Co. M.A.S. receives unrelated research funding from the National Institutes of Health, the Centers for Disease Control and Prevention, Cepheid and Merck and unrelated honoria from UpToDate, Inc. M.R.W. receives unrelated research grant funding from Roche/Genentech and Novartis, and received speaking honoraria from Genentech, Takeda, WebMD and Novartis. J.C. reports consulting fees from GLG group, payments from Elsevier for work as an Associate Editor, a patent pending for methods and compositions for treating and preventing T cell-driven diseases, payments related to participation on a Data Safety Monitoring Board or Advisory Board for Enzyvant, and is a member of the Diagnostic Laboratory Immunology Committee of the Clinical Immunology Society. M.S.Z. receives unrelated funding from the National Heart, Lung, and Blood Institute and consults for Sobi. N.B.H. reports unrelated previous grant support from Sanofi and Quidel, and current grant support from Merck. C.V.H. reports being a speaker for Biofire and a reviewer for UpToDate, Inc. and Dynamed.com. A.G.R. receives royalties as a section editor for Pediatric Critical Care Medicine UpToDate, Inc., and received honoraria for MIS-C-related Grand Round Presentations. A.G.R. is also on the medical advisor board of Families Fighting Flu and is Chair of the International Sepsis Forum, which is supported by industry and has received reagents from Illumina, Inc. P.G.T. is on the Scientific Advisory Board of Immunoscape and Shennon Bio, has received research support and personal fees from Elevate Bio, and consulted for 10X Genomics, Illumina, Pfizer, Cytoagents, Merck and JNJ. The findings and conclusions in this report are those of the authors and do not necessarily represent the views of the Centers for Disease Control and Prevention nor the National Institute of Allergy and Infectious Diseases. All other authors declare no competing interests.

Figures

Fig. 1
Fig. 1. Autoantigens distinguish MIS-C from at-risk controls.
a, Design of the PhIP-seq experiment comparing patients with MIS-C (n = 199) and at-risk controls (n = 45; children with SARS-CoV-2 infection at least 5 weeks before sample collection without symptoms of MIS-C). Schematics in panel a were created using BioRender (https://www.biorender.com). b, Venn diagram highlighting the number of autoantigens identified with statistically significant PhIP-seq enrichment (‘enrichment set’: grey circle; P < 0.01 on one-sided Kolmogorov–Smirnov test with false discovery rate correction) and autoantigens identified, which contribute to a logistic regression classifier of MIS-C relative to at-risk controls (‘classifier set’: purple circle). There are 35 autoantigens present in both the classifier set and the enrichment set (pink; union of the Venn diagram) of which 30 are exclusive to MIS-C and referred to as the ‘MIS-C set’ (no two controls have low reactivity as defined by the fold-change (FC) signal over the mean of protein A/G beads only (FC > mock-IP) of 3 or greater, and no single control has high reactivity defined as FC > mock-IP greater than 10). LR, logistic regression. c, Receiver operating characteristic curve for the logistic regression classifier showing upper and lower bounds of performance through 1,000 iterations. d, Bar plots with error bars showing logistic regression coefficients for the top 10 autoantigens across 1,000 iterations. The whiskers extend to 1.5 times the interquartile range (IQR) from the quartiles. The boxes represent the IQR, and the centre lines represent the median. e, Hierarchically clustered (Pearson) heatmap showing the PhIP-seq enrichment (FC > mock-IP) for the 30 autoantigens in the MIS-C set in each patient with MIS-C and each at-risk plasma control. Source Data
Fig. 2
Fig. 2. Autoantibodies in patients with MIS-C target a single epitope within SNX8.
a, PhIP-seq signal (reads per 100,000) for each patient with MIS-C (n = 199) and each at-risk control (n = 45) across each of the 19 bacteriophage-encoded peptide fragments, which together tile the full-length SNX8 protein. b, SLBA enrichments (normalized antibody indices) for each sequential alanine mutagenesis construct. Constructs were designed with 10 amino acid alanine windows (highlighted in purple) shifted by 5 amino acids until the entire immunodominant SNX8 region (SNX8 fragment 2) was scanned. Values are averages of six separate patients with MIS-C. The identified autoantibody epitope is bounded by vertical grey dotted lines. Source Data
Fig. 3
Fig. 3. Antibodies from patients with MIS-C preferentially target a distinct region of the SARS-CoV-2 nucleocapsid protein.
a, Relative PhIP-seq signal (FC over the mean) of 48 controls who are pre-COVID-19 (FC > pre-COVID-19) in patients with MIS-C (n = 181) and at-risk controls (n = 45) using a custom phage display library expressing the entire SARS-CoV-2 proteome to different regions of SARS-CoV-2. Only regions with a mean antibody signal of more than 1.5-fold above pre-COVID-19 controls are shown. Antigenicity (sum of the mean FC > pre-COVID-19 in MIS-C and at-risk controls) are represented by darker shades. The length of the bars represents the statistical difference in signal between MIS-C and at-risk controls to a particular region (−log10 of two-sided Kolmogorov–Smirnov test P values), with upward deflections representing enrichment in MIS-C versus at-risk controls, and downward deflections representing less signal in MIS-C. The asterisk indicates the differentially reactive region of the nucleocapsid (N) protein. b, Bar plots showing the PhIP-seq signal (FC > pre-COVID-19) across the specific region of the SARS-CoV-2 nucleocapsid protein (fragments 4–9) with the most divergent response in MIS-C samples (n = 181) relative to at-risk controls (n = 45), compared using a two-sided Kolmogorov–Smirnov test (exact P values are shown in the figure). The amino acid sequence of the region with the highest relative enrichment in MIS-C is highlighted in green and referred to as MADS. c, Strip plots and box plots showing MADS SLBA enrichments (normalized antibody indices) in patients with MIS-C (n = 11) relative to at-risk controls (n = 5). d, SLBA signal (normalized antibody indices) for full sequential alanine mutagenesis scans within the same three individuals for SNX8 (left) and MADS (right). Each identified epitope is bounded by black vertical dotted lines. e, Multiple sequence alignment of SNX8 and MADS epitopes with the amino acid sequence for the similarity region shown (for the text in colour, biochemically similar is in orange, and identical is in red). For the box plots (b,c), the whiskers extend to 1.5 times the IQR from the quartiles. The boxes represent the IQR, and the centre lines represent the median. Source Data
Fig. 4
Fig. 4. SNX8 autoreactive CD8+ T cells in patients with MIS-C are cross-reactive to the nucleocapsid protein.
a, Strip plots and box plots showing the distribution of T cells activated in response to either vehicle (culture media + 0.2% DMSO) or the SNX8 peptide pool (SNX8 peptide + culture media + 0.2% DMSO) in patients with MIS-C (n = 9) and controls (n = 10). The relative signal was compared using a two-sided Mann–Whitney U-test (exact P values are shown in the figure). The box plot whiskers extend to 1.5 times the IQR from the quartiles, the boxes represent the IQR, and the centre lines represent the median. The dashed line is 3 s.d. above the mean of the controls in the SNX8 pool condition. b, TCRdist similarity network of 48 unique, paired TCRαβ sequences (n = 259 sequences) obtained from four patients with MIS-C. CD8+ T cells were sorted from PBMCs directly ex vivo or after 10 days of peptide expansion and staining with A*02:01 or A*02:06 HLA class I tetramers loaded with MADS (LQLPQGITL) and SNX8 (MQMPQGNPL) peptides. Each node represents a unique TCR clonotype. Edges connect nodes with a TCRdist score of less than 150. The dashed lines surround TCR similarity clusters. The node size corresponds to the T cell clone size. Nodes are coloured based on the HLA experiment type (left) or patient (right). TCRs selected for further testing are numbered TCR 1–8. The convergent node is circled in green. c, Specificity of putative cross-reactive TCRs expressed in Jurkat-76 cells by HLA-A*02:01 or HLA-A*02:06 tetramers loaded with MADS (LQLPQGITL) and SNX8 (MQMPQGNPL) peptides. Jurkat-76 (TCR-null) cells were used as tetramer background staining controls. The gate values indicate the frequency of MADS–APC+ and/or SNX8–BV421+ cells as the percentage of the total PE+ cells (combination staining with MADS–PE and SNX8–PE tetramers). TCRs with confirmed cross-reactivity are indicated in red. Outliers are shown. Flow plots are representative of two independent evaluations. d, Summary of TCR sequencing results of the eight TCRs tested. Source Data
Extended Data Fig. 1
Extended Data Fig. 1. Previously reported autoantigens and phenotypic associations of novel autoantigens.
a, Heatmap showing distribution of PhIP-Seq enrichments (FC > Mock-IP) of previously reported MIS-C autoantibodies in MIS-C patients (n = 199) and at-risk controls (n = 45). (b) Stripplots and boxplots showing distribution of signal (normalized antibody index) for antibodies targeting IL-1 receptor antagonist (IL-1Ra) measured by RLBA in at-risk controls (blue; n = 45), MIS-C patient samples containing IVIG (red; n = 135), and MIS-C patient samples without IVIG (green; n = 61). Dotted line at 3 standard deviations above the mean of controls. Two-sided Mann-Whitney U testing was performed (exact P values shown in figure). c, Heatmap of P values (two-sided Kolmogorov-Smirnov testing) for differences in autoantibody enrichment for MIS-C patients (n = 199) with versus without each clinical phenotype (numbers vary for each phenotype and are shown in Extended Data Table 2). Significant P values in the negative direction (in which there is increased signal in individuals without the phenotype) are masked (colored as P > 0.05). For each autoantigen, tissue RNA-sequencing data from Human Protein Atlas (Proteinatlas.org) is shown. Amount of expression in cardiac tissue in top row (Very high = nTPM >1000, High=nTPM 100-1000, Moderate=nTPM 10-100, Low=nTPM <10), and predominant tissue type in second-from-top row. Explanations of criteria for MIS-C phenotypes, and distribution of each phenotype within the cohort, can be found in Extended Data Table 2. Source Data
Extended Data Fig. 2
Extended Data Fig. 2. Orthogonally validated autoantibodies classify MIS-C and can be epitope specific.
a, Stripplots and boxplots showing radioligand binding assay (RLBA) values (normalized antibody indices) for each of the top 3 autoantibodies identified by PhIP-Seq logistic regression in individuals with MIS-C (n = 197 for ERFL, n = 196 for SNX8, n = 196 for KDELR1) and each at-risk control (n = 45 for ERFL, SNX8, and KDELR1). Two-sided Mann-Whitney U testing performed (exact P values shown in figure). b, Logistic regression receiver operating characteristic (ROC) curve using RLBA values as input to distinguish MIS-C patients (n = 196) from at-risk controls (n = 45) iterated 1,000 times. c, Stripplots and boxplots showing RLBA enrichments (normalized antibody indices) only in those MIS-C samples without IVIG (n = 61 for ERFL, n = 60 for SNX8, n = 60 for KDELR1) relative to at-risk controls (n = 45 for ERFL, SNX8, and KDELR1). Two-sided Mann-Whitney U testing performed (exact P values shown in figure). d, Stripplots abd boxplots showing RLBA enrichments (normalized antibody indices) for ERFL, SNX8, and KDELR1 in an independent cohort of children with MIS-C (red; n = 24 for each RLBA) compared to children severely ill with acute COVID-19 (yellow; n = 29 for each RLBA) and at-risk controls (blue; n = 45 for each RLBA). Two-sided Mann-Whitney U testing performed (exact P values shown in figure). e, Logistic regression ROC curves for classification of the independent MIS-C cohort (n = 24) versus at-risk controls (n = 45) (left) and the independent MIS-C (n = 24) cohort versus children severely ill with acute COVID-19 (n = 29) (right). f, Paired stripplots and boxplots showing SLBA enrichments (normalized antibody indices) in MIS-C patients (n = 182) and at-risk controls (n = 45) for the full 49 amino acid SNX8 wild-type (WT) polypeptide fragment (lavender) relative to the same SNX8 fragment with alanine mutagenesis of the [PSRMQMPQG] epitope (white). SNX8 WT fragment SLBA values are the means of technical replicates, SNX8 epitope mutagenesis values are from a single experiment. Two-sided Mann-Whitney U testing performed (exact P values shown in figure). For all boxplots in the figure, the whiskers extend to 1.5 times the interquartile range (IQR) from the quartiles, the boxes represent the IQR, and centre lines represent the median. Source Data
Extended Data Fig. 3
Extended Data Fig. 3. HLA associations of SNX8 activated T cells and HLA binding characteristics of peptides containing SNX8/MADS shared epitope motif.
a, Stripplots and boxplots showing distribution of CD4+, CD8+, and total T cells which activate in response to either vehicle (culture media + 0.2% DMSO) or SNX8 peptide pool (SNX8 peptide + culture media + 0.2% DMSO) using AIM assay in MIS-C patients (n = 9) and controls (n = 10). Patient HLA type indicated by color of dot. HLA unpredicted means patient contained none of the MIS-C associated HLA types. Dotted line at 3 standard deviations above the mean of the SNX8 stimulated controls. Two-sided Mann-Whitney U testing was performed (exact P values shown in figure). b, Computationally predicted HLA class I presentation scores (Immune Epitope Database; IEDB.org) for each possible peptide fragment of full-length SARS-CoV-2 N protein for each of the three MIS-C associated HLA types (A*02, B*35 and C*04) relative to a reference set of HLA-types encompassing over 99% of humans. Those fragments containing the MADS similarity region “LQLPQG” in orange. Data normally distributed; two-sided t-tests were performed (exact P values shown in figure). Percent of fragments within each specific HLA type with a score greater than 0.1 (likely to be presented) shown on right. c, Identical analysis but using full length SNX8 protein rather than SARS-CoV-2 NP, and the SNX8 similarity region “MGMPQG” rather than the MADS region “LQLPQG”. Data normally distributed; two-sided t-tests were performed (exact P values shown in figure). d, HLA binding results from β2m folding assay for SARS-CoV-2 N and SNX8 peptides representative of two independent evaluations. Each peptide tested for binding in HLA-A*02:01, A*02:06, and B*35:01 class I monomers. Data presented as geometric mean fluorescence intensity (gMFI) of PE-conjugated anti-human β2m antibody staining of peptide-HLA monomers relative to negative (no peptide; unloaded HLA monomer) and positive (strong binding peptide; CMV pp65 495-503 [NLVPMVATV]) controls. For all boxplots in the figure, the whiskers extend to 1.5 times the interquartile range (IQR) from the quartiles, the boxes represent the IQR, and centre lines represent the median. Source Data
Extended Data Fig. 4
Extended Data Fig. 4. Identification, activation, and HLA restriction, of cross-reactive CD8+ T cells.
a, Gating strategy used to identify CD8+ T cells which bound to SNX8 epitope and/or MADS N protein epitope (CD8+ T cells positive for PE). Representative MIS-C patient and control showing each CD8+ T cell which bound to any tetramer (PE+) and the relative binding of that T cell to both the SNX8 epitope (BV421+) and the MADS N protein epitope (APC+) identifying cross-reactive T cells (PE+APC+BV421+). Schematics in panel a were created using BioRender (https://www.biorender.com). b, Stripplots and boxplots showing percentage of CD8+ T cells which are cross-reactive to both SNX8 and MADS in MIS-C patients (n = 3) and controls (n = 3). Insufficient numbers to perform robust statistical testing. c, Stripplots and boxplots showing percentage of total T cells which activate in response to either vehicle (culture media + 0.2% DMSO) or the SNX8 Epitope (SNX8 Epitope (Materials) + culture media + 0.2% DMSO) in MIS-C patients (n = 2) and at-risk controls (n = 4) measured by AIM assay. Insufficient numbers to perform robust statistical testing. Dotted line at 3 standard deviations above mean of SNX8 Epitope stimulated controls. d, TCRdist Similarity Network of 48 unique, paired TCRαβ sequences (n = 259 sequences) obtained from four patients with MIS-C. CD8+ T cells were sorted from PBMCs directly ex vivo or after 10-days of peptide expansion and staining with A*02:01 or A*02:06 HLA class I tetramers loaded with MADS [LQLPQGITL] and SNX8 [MQMPQGNPL] peptides. Each node represents a unique TCR clonotype. Edges connect nodes with a TCRdist score < 150. Dashed lines surround TCR similarity clusters. Node size corresponds to T cell clone size. Nodes are colored based on HLA restriction. TCRs selected for further testing are numbered TCR #1-8. Convergent node circled green. For all boxplots in the figure, the whiskers extend to 1.5 times the interquartile range (IQR) from the quartiles, the boxes represent the IQR, and centre lines represent the median. Source Data
Extended Data Fig. 5
Extended Data Fig. 5. Evaluation of Jurkat-TCR lines.
a, Jurkat-76 cells stably expressing putative cross-reactive TCRs (#1-8) stained with anti-murine TCRβ constant region (mTCRβc). Plots depict frequency of transduced (mCherry+) Jurkat cells with presence of surface TCR (APC/Fire 750+) as a percentage of total live cells. b, Jurkat-TCR+ cell lines expressing putative cross-reactive TCRs #1-8 stained with individual or combination of HLA-A*02:01 or A*02:06 tetramers loaded with MADS [LQLPQGITL] and SNX8 [MQMPQGNPL] peptides. Blue contour plots indicate staining with MADS-Tetramer (PE) and MADS-Tetramer (APC); purple contour plots indicate staining with SNX8-Tetramer (PE) and SNX8-Tetramer (BV421); red indicates combined staining with a pool of MADS/SNX8-Tetramer (PE), MADS-Tetramer (APC), and SNX8-Tetramer (BV421). Plots shown are gated from total PE+ cells. Plots with confirmed cross-reactive TCRs outlined in red. c, Jurkat-TCR+ cell lines expressing putative cross-reactive TCRs #1-8 stained with individual HLA-A*02:01 or A*02:06 tetramers loaded with MADS Wuhan [LQLPQGTTL] peptide. Gate values indicate frequency of MADS-APC+ cells as percentage of total MADS-PE+ cells. Outliers shown in contour plots. Flow plots representative of two independent evaluations. Source Data
Extended Data Fig. 6
Extended Data Fig. 6. SNX8 expression during viral infection.
a, UMAPs showing SNX8 expression in various peripheral blood cell types during SARS-CoV-2 infection. b, Mean expression and percent of cells expressing SNX8 in peripheral blood subsets during SARS-CoV-2 infection. c, Mean expression and percent of cells expressing SNX8 averaged across all peripheral blood mononuclear cells from SARS-CoV-2 infected individuals without symptoms, with mild symptoms, or with severe disease compared to uninfected controls. d, Mean expression and percent of cells expressing SNX8, OAS1, OAS2, and MAVS in peripheral blood subsets during SARS-CoV-2 infection. e, Relative expression of SNX8, OAS1, OAS2, and MAVS during influenza virus infection compared to different severities of SARS-CoV-2 infection.
Extended Data Fig. 7
Extended Data Fig. 7. Representative flow cytometry gating.
a, Flow cytometry gating strategy for identifying CD4 positive and CD8 positive T cells for the AIM analysis with representative activation induced marker (AIM) assay flow cytometry gating strategy measuring percent of CD4+ T cells which activate (CD137+OX40+) and percent of CD8+ T cells which activate (CD137+CD69+) in response to SNX8 protein. b, Flow cytometry gating strategy for the initial SNX8/MADS tetramer cross-reactivity assay (Extended Data Fig. 4a,b) showing isolation of PE-tetramer positive CD8 positive T cells. c, Flow cytometry plots showing results of serotyping for the PBMCs used in the initial SNX8/MADS tetramer cross-reactivity assay (Extended Data Fig. 4a,b) which did not have sufficient cells for genotyping. Shown is the 1 MIS-C patient (far left) and 3 controls (middle 3) which are positive for HLA-A*02 and were used and one control negative for HLA-A*02 (far right) which was not used. d, Index sorting strategy for patient PBMCs from ex vivo and peptide expansion experiments for TCR sequencing. Single cells were sorted from live/lineage (CD4, CD14, CD16, CD19)-negative, CD3+CD8+ T lymphocytes positive for MADS/SNX8-Tetramer (PE) and MADS-Tetramer (APC) and/or SNX8-Tetramer (BV421). e, Flow cytometry gating strategy to evaluate putative cross-reactive Jurkat-TCRs. Gates include single, live, transduced Jurkat lymphocytes triple positive for MADS/SNX8-(PE), MADS-(APC), and SNX8-(BV421) tetramers shown in Fig. 4.

References

    1. Lu, X. et al. SARS-CoV-2 infection in children. N. Engl. J. Med.382, 1663–1665 (2020). - PMC - PubMed
    1. Viner, R. M. et al. Susceptibility to SARS-CoV-2 infection among children and adolescents compared with adults: a systematic review and meta-analysis. JAMA Pediatr.175, 143–156 (2021). - PMC - PubMed
    1. Feldstein, L. R. et al. Characteristics and outcomes of US children and adolescents with multisystem inflammatory syndrome in children (MIS-C) compared with severe acute COVID-19. JAMA325, 1074–1087 (2021). - PMC - PubMed
    1. Whittaker, E. et al. Clinical characteristics of 58 children with a pediatric inflammatory multisystem syndrome temporally associated with SARS-CoV-2. JAMA324, 259–269 (2020). - PMC - PubMed
    1. Diorio, C. et al. Multisystem inflammatory syndrome in children and COVID-19 are distinct presentations of SARS-CoV-2. J. Clin. Invest.130, 5967–5975 (2020). - PMC - PubMed

MeSH terms

Supplementary concepts